Technical analysis by Thewiningtrades000 about Symbol PAXG: Buy recommendation (7/22/2025)

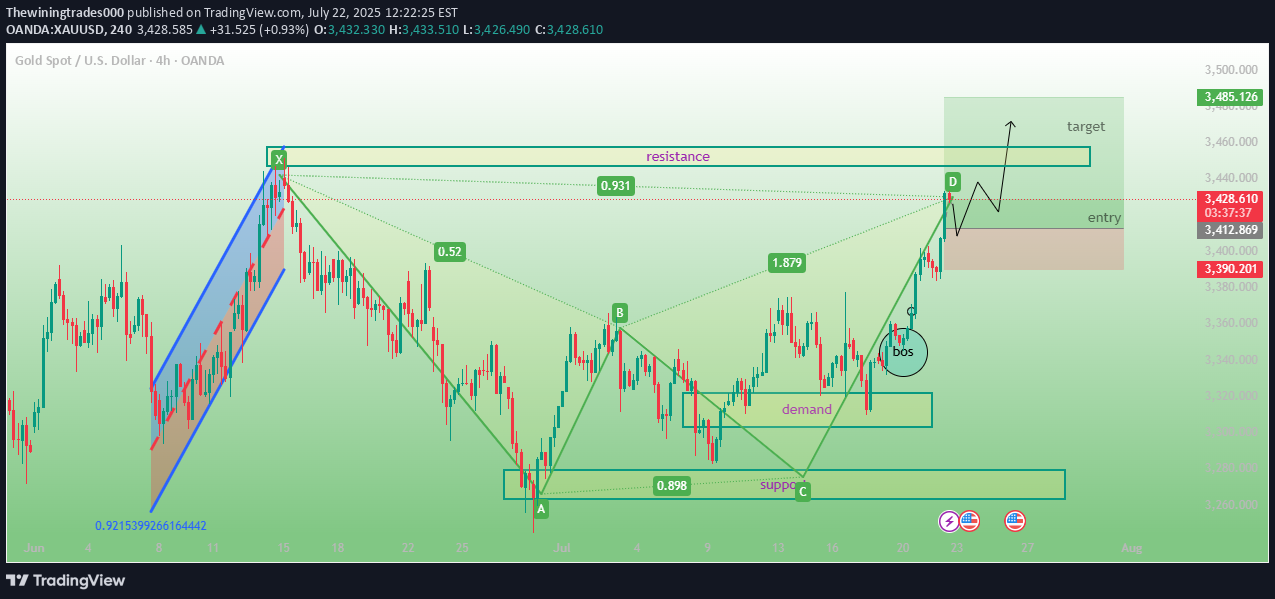
Harmonic Pattern Identified: Appears to be a Bullish Gartley or Bat pattern (labeled with X-A-B-C-D points) Completion of the pattern is at point D, signaling a potential buy entry Key Zones: Demand Zone: Marked where price previously showed strong buying interest. Support Zone: Below point C – represents a potential bounce area. Resistance Zone: Just below the target area; might act as a short-term obstacle. Break of Structure (bos): Noted in a circle, showing a bullish shift in market structure. --- 📊 Trade Setup Entry Zone: Highlighted in pink/red near point D. Target Zone: Highlighted in green above resistance (~3,485.126). Stop-loss Zone (implied): Likely below the demand zone or point C. Expected Price Movement: An upward arrow indicates anticipation of a bullish move from the entry to the target zone. --- 📚 Indicators/Tools Used Harmonic pattern drawing tool Support/resistance boxes Price labeling (e.g., 0.931, 1.679 – possibly Fibonacci ratios) Candlestick chart (no indicators like RSI or MACD are visible) --- 🔍 Analysis Summary This is a bullish setup based on harmonic and structure analysis. The trader expects the price to rise from the current level (~3,427) toward the resistance and target zone (~3,485). Entry is planned at the D-point after confirming a structure break (BOS). Risk is defined below the demand zone.300 pips runing guys wait for allclose
