
TheCoinCowboy
@t_TheCoinCowboy

What symbols does the trader recommend buying?
Purchase History
پیام های تریدر
Filter
TheCoinCowboy
۷ دلیل هشدار دهنده: زِک (ZEC) در آستانه سقوط آزاد به زیر ۳۰۰ دلار!
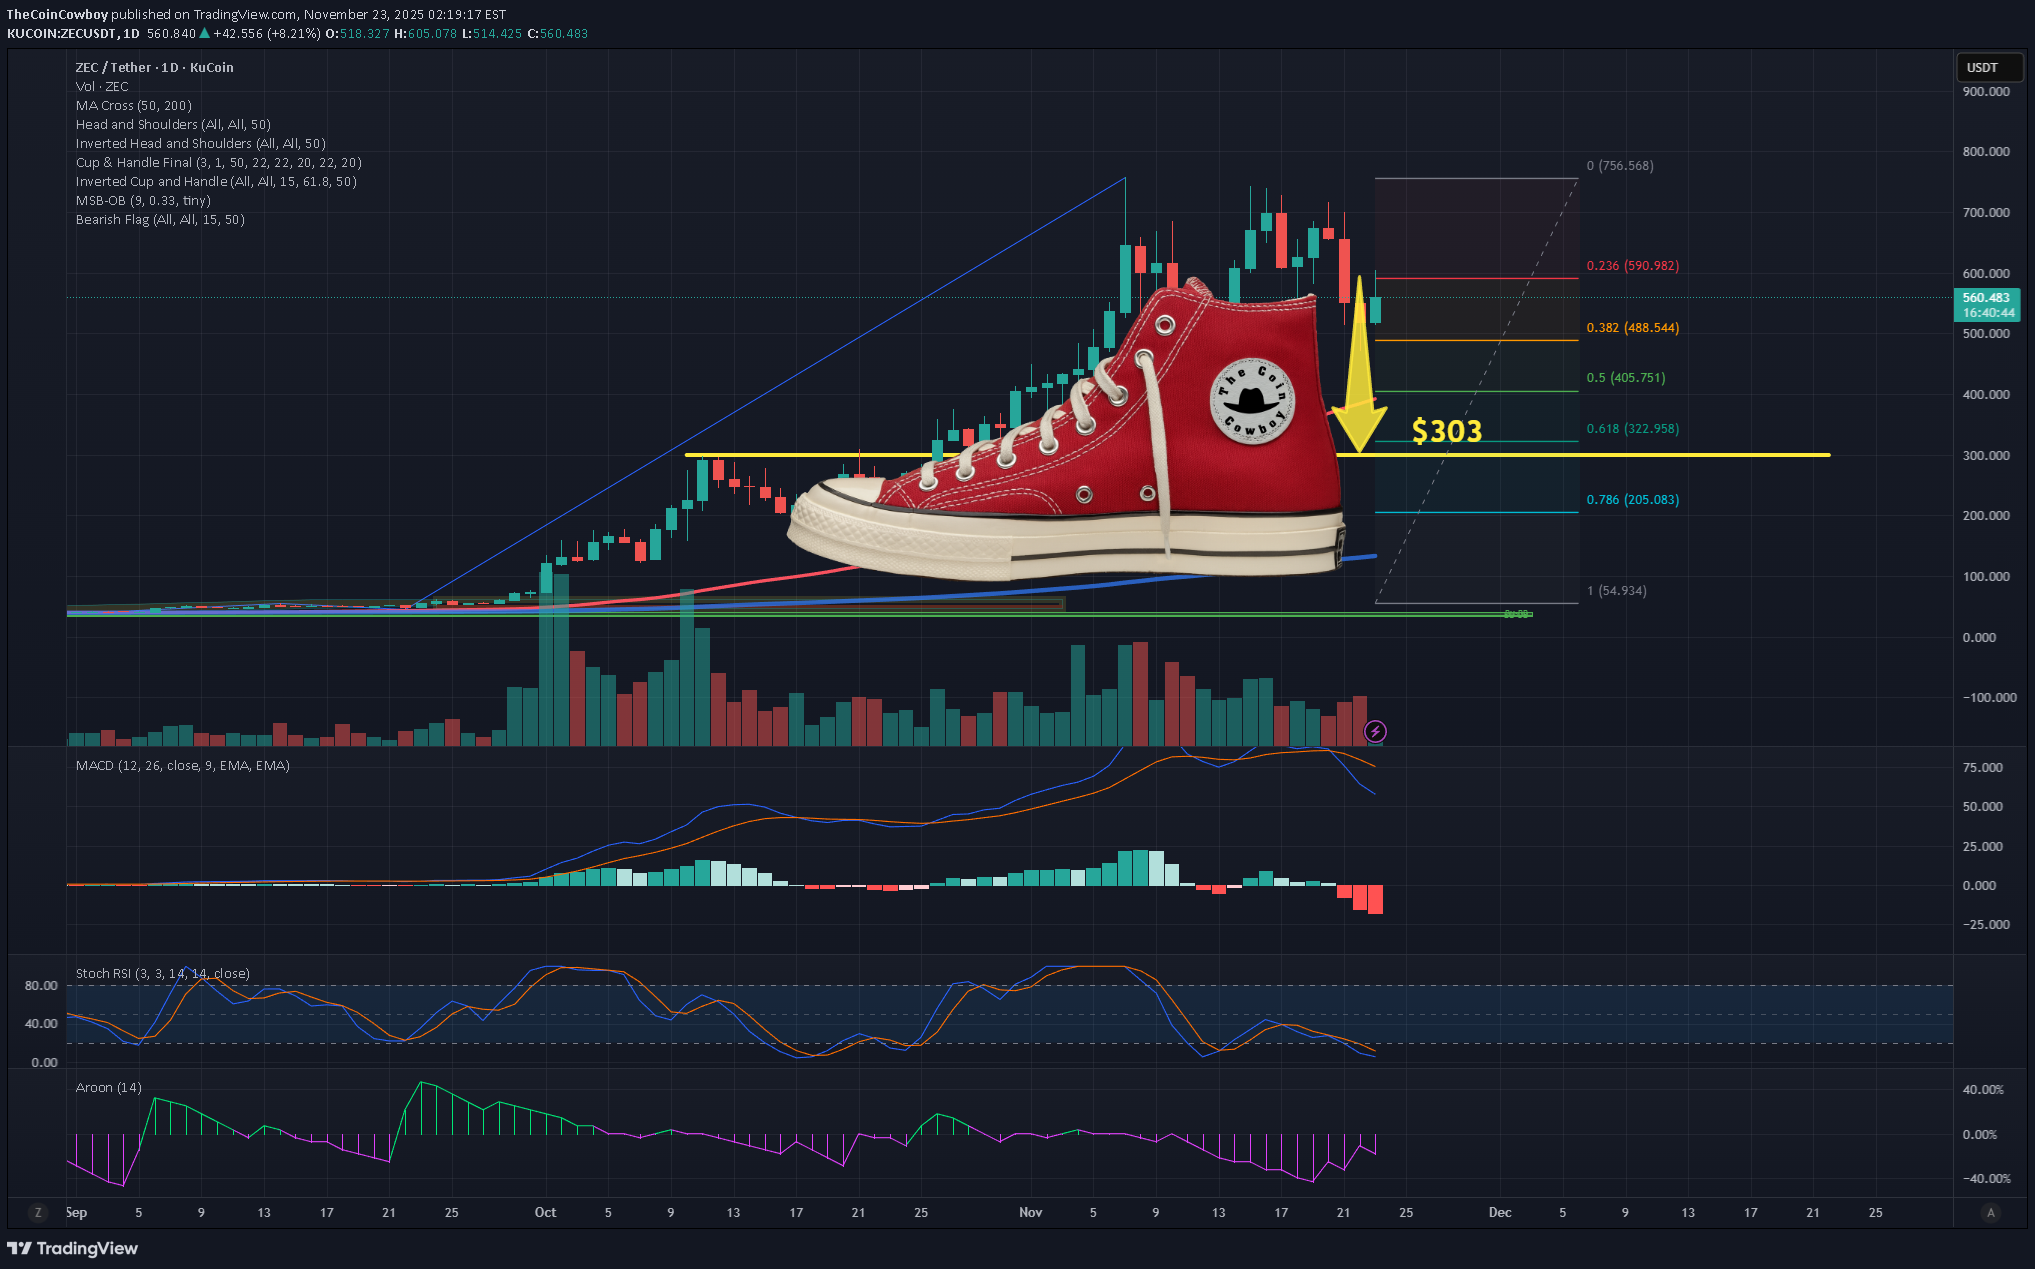
My 7 reasons why ZEC is about to drop to the heel of the shoe. 1. Price Rejected Hard at the 0.236 Fibonacci Level The recent top at $752 Strong rejection at $582 (0.236 level) Price tried to reclaim 0.236 multiple times and failed, which signals: The bullish trend has lost strength and a deeper retracement is likely. In most parabolic assets, 0.236 → 0.382 → 0.618 is the natural sequence when momentum dies. ZEC already hit 0.382 around $476, and bounced weakly. Next logical magnet is 0.618 = $306. 2. The $548 Horizontal Level Was Lost (Key Breakdown) $548 was: former support former demand zone heavy volume node (visible on histogram) Price closed below it, which makes it broken support → new resistance Losing this floor confirms that buyers couldn’t defend the mid-range. When a mid-range collapses, price usually moves to the next major liquidity pool, which here is: 👉 0.618 Fib at $306 👉 200MA cluster between $380–$400 3. Volume Profile Shows a Gap Below $480 Volume bars reveal high trading activity between $540–$620 A void / low-volume area between $470 → $380 Markets tend to fill low-volume gaps quickly because: There is little historical demand to slow price down This means once $480 breaks convincingly, price can accelerate rapidly toward: 📌 $380–$400 📌 $305–$330 4. MACD Bearish Cross With Increasing Bearish Momentum MACD shows: MACD line crossing below signal line Histogram printing deeper red bars MACD approaching the zero line A MACD cross this high up (after a parabolic run) is dangerous When MACD crosses down after a blow-off top, the retrace is usually 50–70%. That places ZEC’s ideal retrace zone between: 0.5 Fib → $391 0.618 Fib → $306 Again, pointing toward the $300 range 5. Stochastic RSI Bottoming? Not Yet — Could Stay Oversold in a Downtrend Stoch RSI is oversold, but this is misleading because: In downtrends, Stoch RSI can remain pinned down while price continues falling. This happens during macro trend reversals. Oversold Stoch does not mean reversal—it often means continuation. 6. Aroon Indicator Shows Strong Downtrend Confirmation Aroon indicator is down (purple) is dominating Aroon Up (green) is completely suppressed This means trend strength = bearish Aroon tends to be a leading indicator, so with this reading: Trend is already confirmed bearish. More downside is expected. 7. Market Structure: Lower Highs + Breakdown of Rising Structure The chart clearly shows: A lower high after the top (not a good sign) Breakdown of the parabolic rising wedge Failed retest zone around $600 Candle spreads widening on down moves (increasing sell pressure) All of that is consistent with a distribution pattern after a massive run Once distribution completes, assets typically retrace to: 📌 0.618 or 📌 the base of the breakout structure The base of ZEC’s breakout... → $300–$350 area
TheCoinCowboy
الگوی آدم و حوا بیت کوین: آیا هدف بعدی قیمت 74 هزار دلار است؟

Looks like on the 12 hour BTC has an Adam & Eve pattern. The height of the arch is the potential downside. So if it plays out, it looks like 74k is possible.Current bump up to 84k from 80k is a minor relief rally, not a reverse of trend. BTC keeps getting rejected under the descending 200 MA. The liquidity zone around 81k is still largely untapped.
TheCoinCowboy
AVAX Bear Flag on 4 hour

The bounce to ~$30 did not take out the last 4H lower-high (~$30.6–$31). Until that breaks and holds, structure is still down. This preiction is valid unless price closes above the flag’s upper trendline / last LH (~$30.6–$31). A breakdown from the flag puts the usual magnets back in play: $28.40 (0.382) → lose it on a 4H close and the path opens to $27.9 / $27.3 $26.0–$26.6 (0.5 + prior pivot) If that fails: $23.6 (0.618). Extreme measured-move risk from the full pole points toward $20–$21 (low-probability unless BTC/ETH crack).
TheCoinCowboy
AVAX soon to Jump Accross the Creek

AVAX shown here on a 15 minute time frame has been chopping a bit sideways, or what appears to be even a bull flag forming, but a closer look shows signs of a Wyckoff "Re-Accumulation" type of action that might be considered a "Jump The Creek" or "Jump Accross the Creek" formation (JAC) JAC Confirmation Checklist ✔️ Spring in place? → Yes, the $33 sweep looks like it. ✔️ Volume expansion? → Uptick on the rally, yes. ✔️ Test of resistance? → Happening right now at $34.50–35.00. ❓ Convincing breakout + retest? → Needs a clean close above $35 with a retest that holds (not just a wick). If we break below $34, this theory is invalidated.
TheCoinCowboy
AVAX Bullish Gartley Identified

This Cypher harmonic shown in yellow is bullish because all the Fibonacci ratios align within textbook structure: XA → B retrace: 0.442 (inside the valid 0.382–0.618 zone). A → C extension: 1.138 (inside the valid 1.13–1.414 zone). B → D retrace: 0.664 (close to the ideal 0.786 zone for completion). These ratios confirm that the D point at ~24.0–24.2 represents a valid PRZ (Potential Reversal Zone). Price action already bounced from that zone and is holding above 24.6–24.7, which signals buyer defense and supports further upside. 🎯 Why Price Should Continue Up The completion at D suggests the bearish swing has exhausted, and the Cypher is now entering its bullish reversal phase. Indicators (MACD turning positive, Stoch RSI rising) confirm momentum is shifting upward. Structure shows higher lows forming within the wedge, adding confluence. 📊 Next Price Targets (Profit Zones) Target 1: 25.80 (0.236 Fib + wedge resistance) First take-profit zone. Target 2: 26.50 (mid-resistance, short-squeeze potential). Target 3: 27.00–27.30 (strong resistance, wedge breakout target). Stops should remain below 23.90, just under the D completion zone. ✅ Bottom Line This Cypher is a bullish reversal pattern. With D completing near 24.0 and confirmation bounce already in play, AVAX has strong probability to climb toward 25.80 first, then 26.5–27.0 if momentum continues.
TheCoinCowboy
SUI landslide incoming

SUI has lost support and has fallen below $3.55, and then failed to regain any ground above it repeatedly. The expectation is that it will hit the March 27 high of $2.82 and then possibly fall further.This trade is still in play...On the 15 minute or 1 hour time frame, you can see a Bearish Pennant forming. I expect another leg down soon.As predicted, the bear pennant brought SUI down another leg to $2.80, and we see a nice bounce up, but the trend is still corrective and I don't think we will see SUI go beyone $3.03 before another leg down to the $2.72 range.I'm gonna say it... I told everyone...My original post on 30 May, was, "The expectation is that it will hit the March 27 high of $2.82 and then possibly fall further.".... and we are now at $2.72.Getting very close. Hit $2.46 today. The Fib retracement from the lowest point in April low to the recent May High, shows that we are now in the "Golden Pocket".Today we hit $2.30 and that was in my predicted range.
TheCoinCowboy
SUI in Wyckoff Accumulation

Here at the 30 minute time frame, SUI looks to be forming a Wyckoff Accumulation pattern. It is possible to have one or two more secondary tests (ST) and then a strong move up beyond the level of the creek (Jump Across the Creek), and if that happens, it will be boom town again. This will be invalidated if the price falls below $3.50.
TheCoinCowboy
SUI Friday Double Cupcakes

Shown here on a four hour time frame — what appears to be an almost identical reapat of the recent wave 4 consolodation. Notice the phenominon of what I call, "Double Cupcakes"... — I know... not very technical — but this double bump keeps appearing before a continuation up or reversal of a down trend. So hopefully these cupcakes make your Friday fun. NFA Best WishesFalling below $3.68 invalidaters this theory. And we will likely drop to the range of $3.00 to $3.35Yum yum...my cupcake theory is playing out so far...
TheCoinCowboy
SUI in a possilbe "Complex Wyckoff Reaccumulation"

We could be in a complex reaccumulation bouncing around between $3.85 and $4.08, as a temporary situtation before a longer elliote wave 5 up to the $4.50 range. Market makers might be testing out both sides of the range to shake out weak hands. Multiple Fakeouts or Upward Thrusts (UT) are happenign with all the over-eager buyers; these false breakouts trap breakout traders. We are seeing Multiple Spring s: where price dips below support to stop folks out before reversing.
TheCoinCowboy
SUI Cup & Handle formation!!!

Consider the following narative, what currently looks like the completion of wave 5 after hitting $4.27 and now retracing to around $4.00, is actually a short pause or consolidation within a larger wave 5. In Elliott Wave theory, waves occur in fractals, meaning: A smaller 5-wave move (e.g., on a 1H chart) can be part of a larger Wave 3 or 5 on a higher timeframe (e.g., daily). What looks like the “end” of Wave 5 may actually be the end of only a minor subwave within a much larger Wave 5. Shown here is the 12 hour time frame and the Y-axis of the chart is set to logrithmic. There is a cup and handle formation forming, and the current price range of $4.00 to $4.27 is actually the little pause... just like there was a little pause in the middle of wave 3. This means we likely have more runnway to move further up to surpase $5.00. On Monday morning the 12th of May, when the CME opens, and everyone's short on ETH gets liquidated there will be a huge jolt to the market. Also... if certain members of the U.S. political narative get their act together and pass the stable bill reform on Monday, the crypto market will be doing a happy dance. HOWEVER... if we fail to hold $3.90, then the move down will likely be near the $3.50 range that many people are predicting and that will be the handle of a larger cup & handle. If we hold above $3.90 then the bottom of wave 4 was the handle.On the 15 minute time frame, the few "spikes" (shadows) are preventing folks from seeing the ascending triangle that is forming.
Disclaimer
Any content and materials included in Sahmeto's website and official communication channels are a compilation of personal opinions and analyses and are not binding. They do not constitute any recommendation for buying, selling, entering or exiting the stock market and cryptocurrency market. Also, all news and analyses included in the website and channels are merely republished information from official and unofficial domestic and foreign sources, and it is obvious that users of the said content are responsible for following up and ensuring the authenticity and accuracy of the materials. Therefore, while disclaiming responsibility, it is declared that the responsibility for any decision-making, action, and potential profit and loss in the capital market and cryptocurrency market lies with the trader.