Technical analysis by TheCoinCowboy about Symbol ZEC: Sell recommendation (10 hour ago)

TheCoinCowboy
۷ دلیل هشدار دهنده: زِک (ZEC) در آستانه سقوط آزاد به زیر ۳۰۰ دلار!
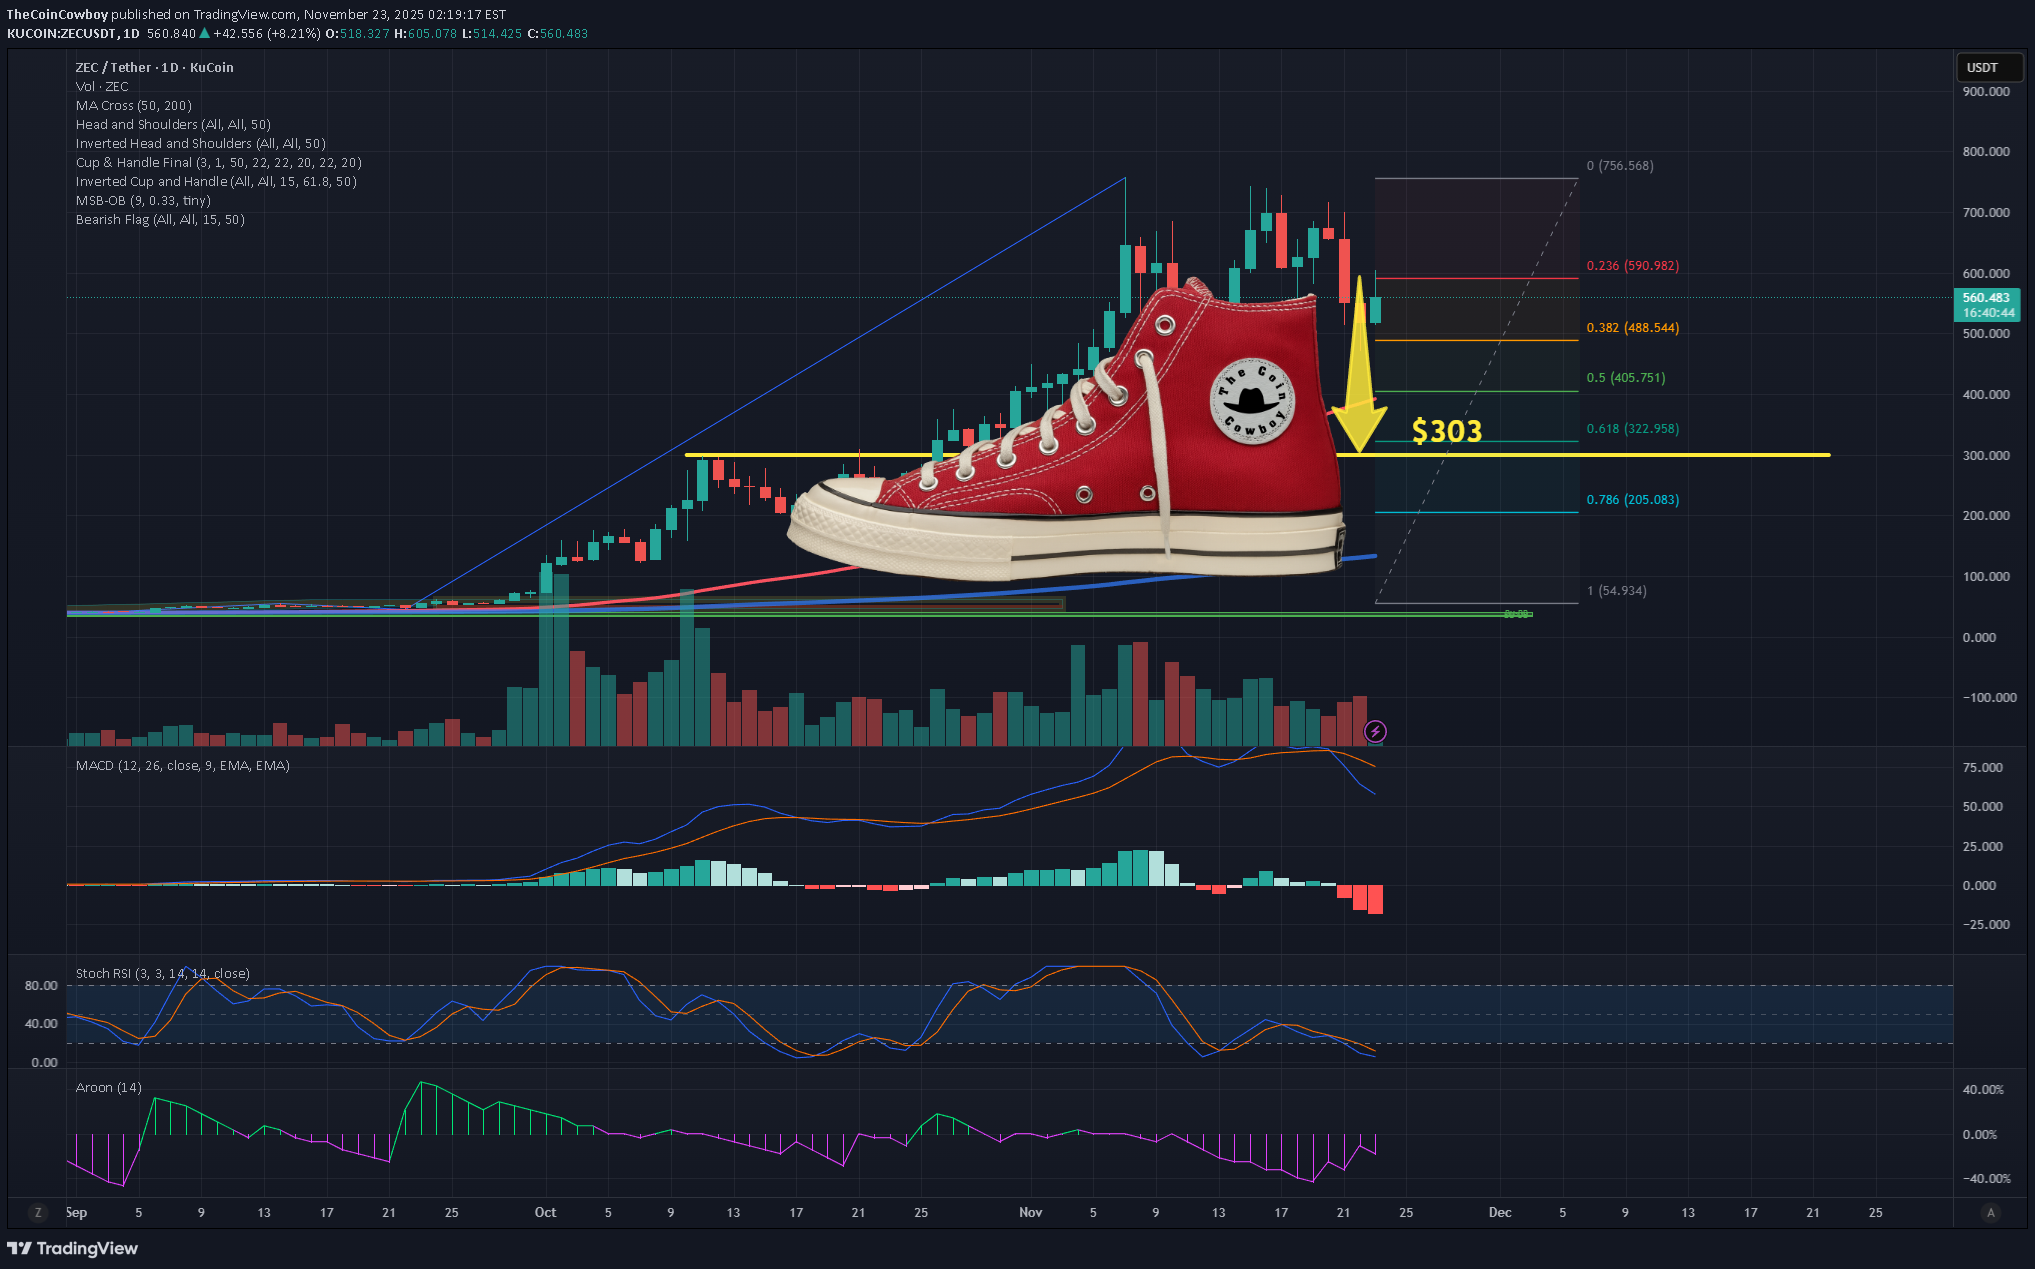
My 7 reasons why ZEC is about to drop to the heel of the shoe. 1. Price Rejected Hard at the 0.236 Fibonacci Level The recent top at $752 Strong rejection at $582 (0.236 level) Price tried to reclaim 0.236 multiple times and failed, which signals: The bullish trend has lost strength and a deeper retracement is likely. In most parabolic assets, 0.236 → 0.382 → 0.618 is the natural sequence when momentum dies. ZEC already hit 0.382 around $476, and bounced weakly. Next logical magnet is 0.618 = $306. 2. The $548 Horizontal Level Was Lost (Key Breakdown) $548 was: former support former demand zone heavy volume node (visible on histogram) Price closed below it, which makes it broken support → new resistance Losing this floor confirms that buyers couldn’t defend the mid-range. When a mid-range collapses, price usually moves to the next major liquidity pool, which here is: 👉 0.618 Fib at $306 👉 200MA cluster between $380–$400 3. Volume Profile Shows a Gap Below $480 Volume bars reveal high trading activity between $540–$620 A void / low-volume area between $470 → $380 Markets tend to fill low-volume gaps quickly because: There is little historical demand to slow price down This means once $480 breaks convincingly, price can accelerate rapidly toward: 📌 $380–$400 📌 $305–$330 4. MACD Bearish Cross With Increasing Bearish Momentum MACD shows: MACD line crossing below signal line Histogram printing deeper red bars MACD approaching the zero line A MACD cross this high up (after a parabolic run) is dangerous When MACD crosses down after a blow-off top, the retrace is usually 50–70%. That places ZEC’s ideal retrace zone between: 0.5 Fib → $391 0.618 Fib → $306 Again, pointing toward the $300 range 5. Stochastic RSI Bottoming? Not Yet — Could Stay Oversold in a Downtrend Stoch RSI is oversold, but this is misleading because: In downtrends, Stoch RSI can remain pinned down while price continues falling. This happens during macro trend reversals. Oversold Stoch does not mean reversal—it often means continuation. 6. Aroon Indicator Shows Strong Downtrend Confirmation Aroon indicator is down (purple) is dominating Aroon Up (green) is completely suppressed This means trend strength = bearish Aroon tends to be a leading indicator, so with this reading: Trend is already confirmed bearish. More downside is expected. 7. Market Structure: Lower Highs + Breakdown of Rising Structure The chart clearly shows: A lower high after the top (not a good sign) Breakdown of the parabolic rising wedge Failed retest zone around $600 Candle spreads widening on down moves (increasing sell pressure) All of that is consistent with a distribution pattern after a massive run Once distribution completes, assets typically retrace to: 📌 0.618 or 📌 the base of the breakout structure The base of ZEC’s breakout... → $300–$350 area