
The-white-goat
@t_The-white-goat

What symbols does the trader recommend buying?
Purchase History
پیام های تریدر
Filter
The-white-goat
تحلیل بیت کوین: ارتباط پنهان با تصمیمات مهم اقتصادی FOMC
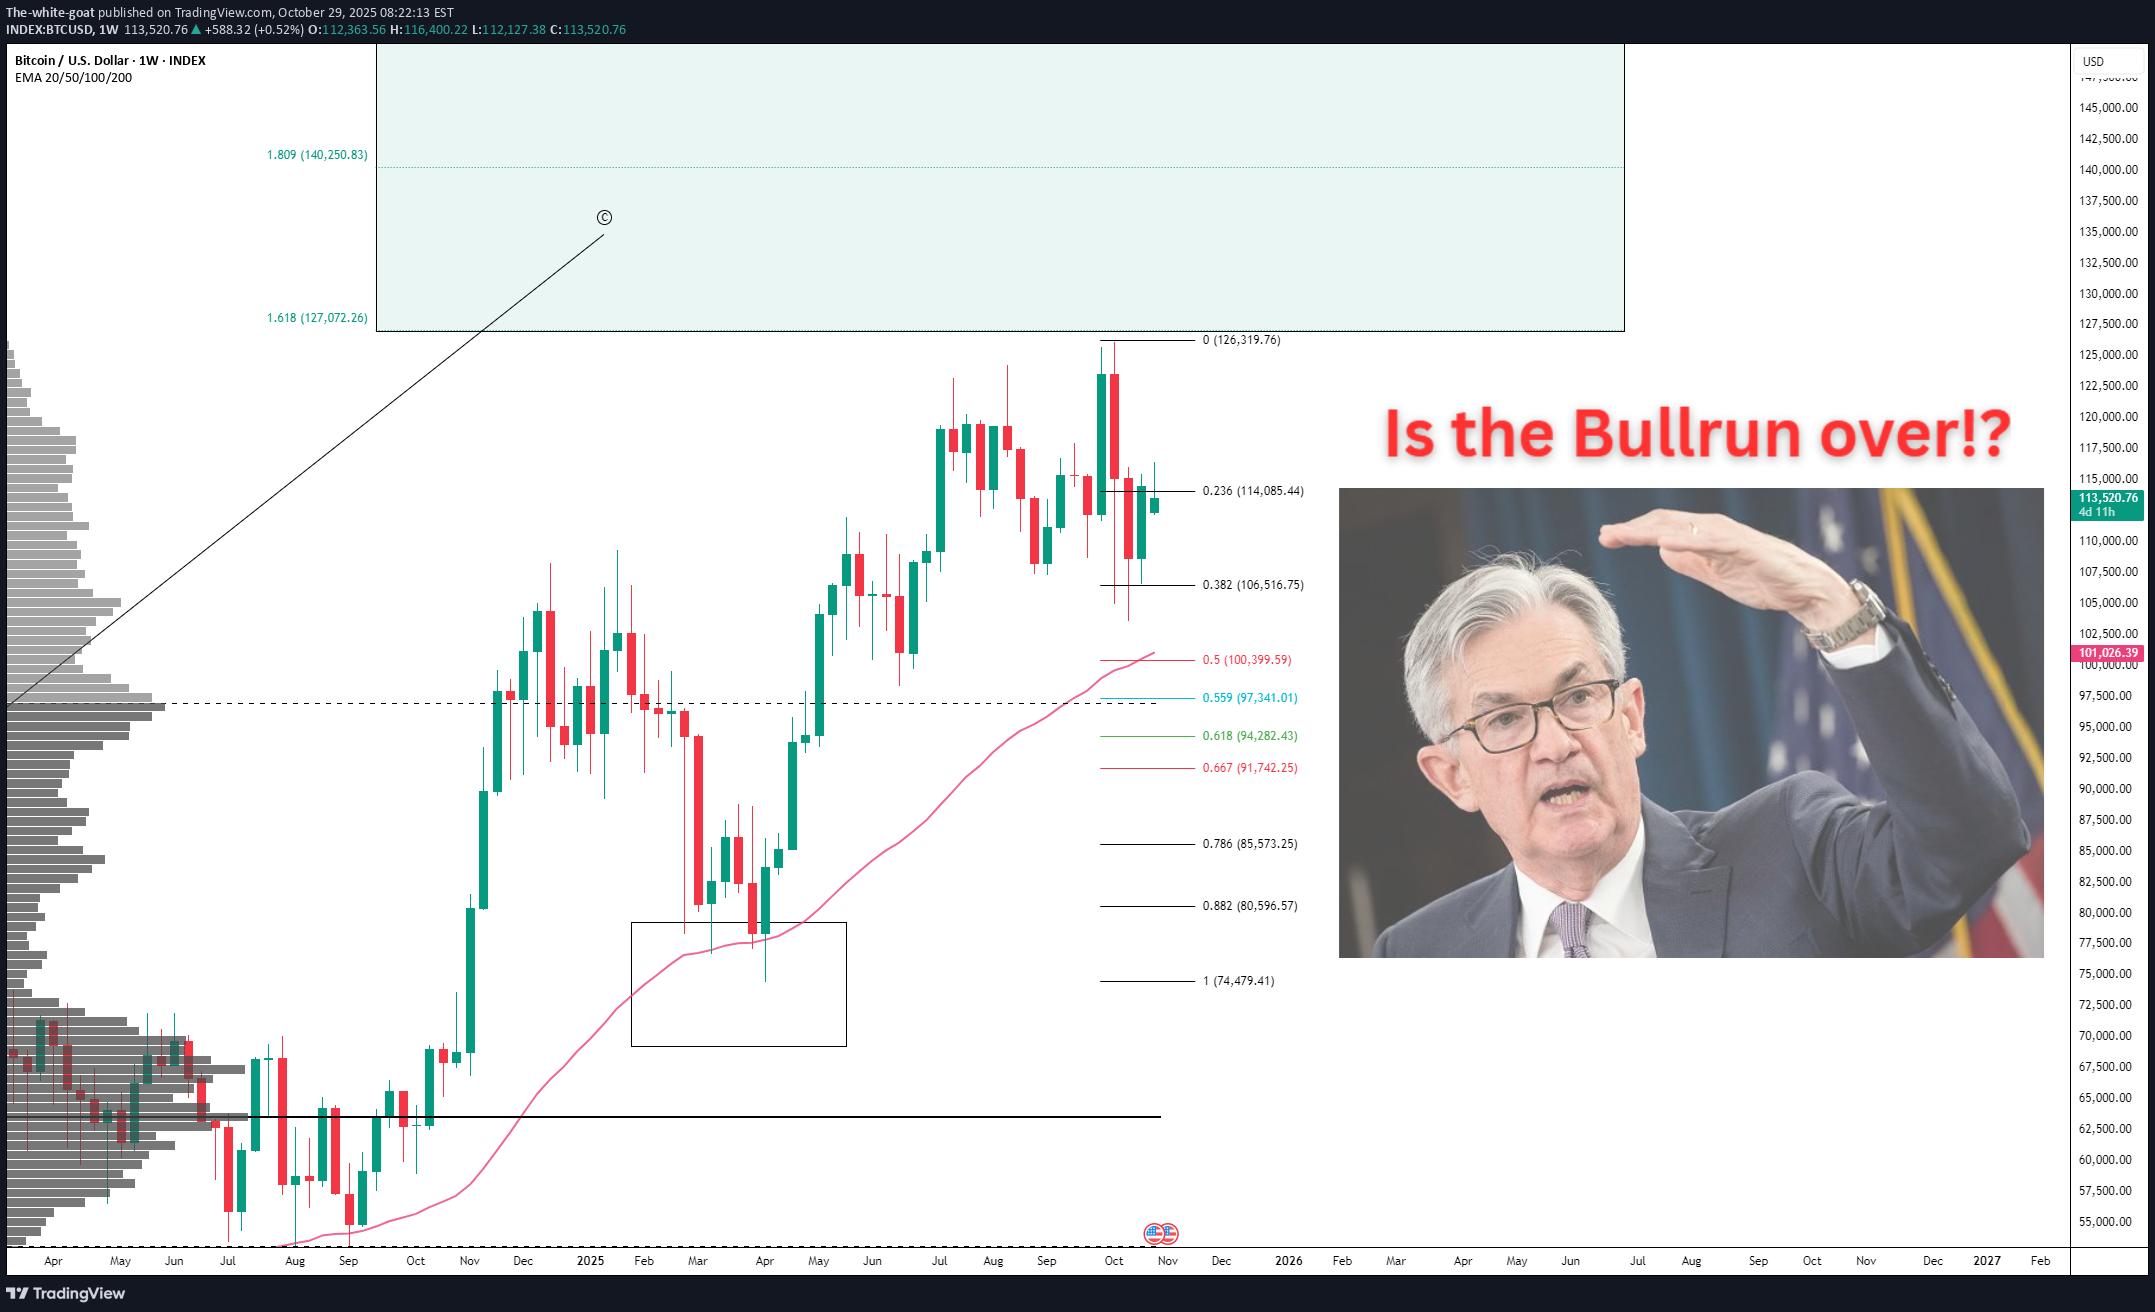
Here is the Bottom-Up Analysis for BTC as requested 🫡 At first, we’ll just talk about the charts, and after that, a bit about today’s FOMC meeting and what it means for Bitcoin. Big Picture: The bull run remains intact as we haven’t had any weekly closes below the 50W moving average. We bounced from the 0.382 level of the current range and from a major volume support zone built over the last two years. As long as we stay above these levels, everything remains bullish. Our target zone for this bull run hasn’t been reached yet — it stretches from 127K to 153K. Overextansions are always possible, though. Smaller-Picture: We remain below the Point of Control, as we bounced off it two days ago. A smaller sequence has been activated, which could bring us all the way up to new ATHs. The next big support is at the trend reversal area, where our VAL also comes in as another layer of support. This area will be key! Intraday-Timeframe: We are currently sitting at a local volume support area. If we lose that, we’ll likely come down to the trend reversal zone, where we also have an intraday Target zone. This will be a long opportunity for me, as we have the following confluences in this area: - Trend Reversal Zone - Target zone of a secondary structure - Volume Support via the Point of Control If we can’t hold this area, I expect Bitcoin to break down toward the VAL at 108.8K — that could also mean a bit more ranging over the next week. Looking even closer, we can see that we just bounced off the latest trend reversal area in the smallest timeframes. If we move above the latest high, I expect follow-through — no breakdown into my buying area. Connection to FOMC Let’s talk a bit about the current economic stance and what we can expect today. Growth remains strongly positive on a big-picture basis. The last GDP print came in above expectations, and the GDPNowcast currently sits at 3.9%. Inflation remains moderate, as we saw in the last print, so there’s nothing to fear there. Inflation expectations have actually come down over the last month — this could pressure markets if the Fed doesn’t cut fast enough, but we aren’t seeing that right now. Monitoring inflation remains key at this point. The long end of the yield curve remains range-bound but has come down a bit, showing no major inflation risk. Liquidity is expanding, with credit spreads near cycle lows, which has fueled the current melt-up we’re seeing. Growth → positive Inflation → moderate Liquidity → expanding The Fed said at the last meeting that they expect inflation to remain moderate and growth to increase toward the end of the year — and they’re cutting rates in this environment. All together, this brings us close to a Goldilocks scenario. It won’t last forever! My expectations for today’s FOMC meeting are as always: 👉 This isn’t the most important FOMC of our lives! I do think there’s a moderate probability that the Fed will stop QT, which would cause the market to pump. The rate cut is already 100% priced in, so now we need to focus on whether they change their balance sheet policy and on Powell’s forward guidance ---- I don’t know what’s going to happen, but I do know that I’ll go long on BTC if we come down to my buying zone. We remain bullish on both the macro and micro picture. One single news headline could trigger an end-of-year rally — or one could spark another liquidation cascade, as we saw on October 10. Good trading & stay safe! Feel free to ask me any questions down below!
The-white-goat
ADA | Full Analysis
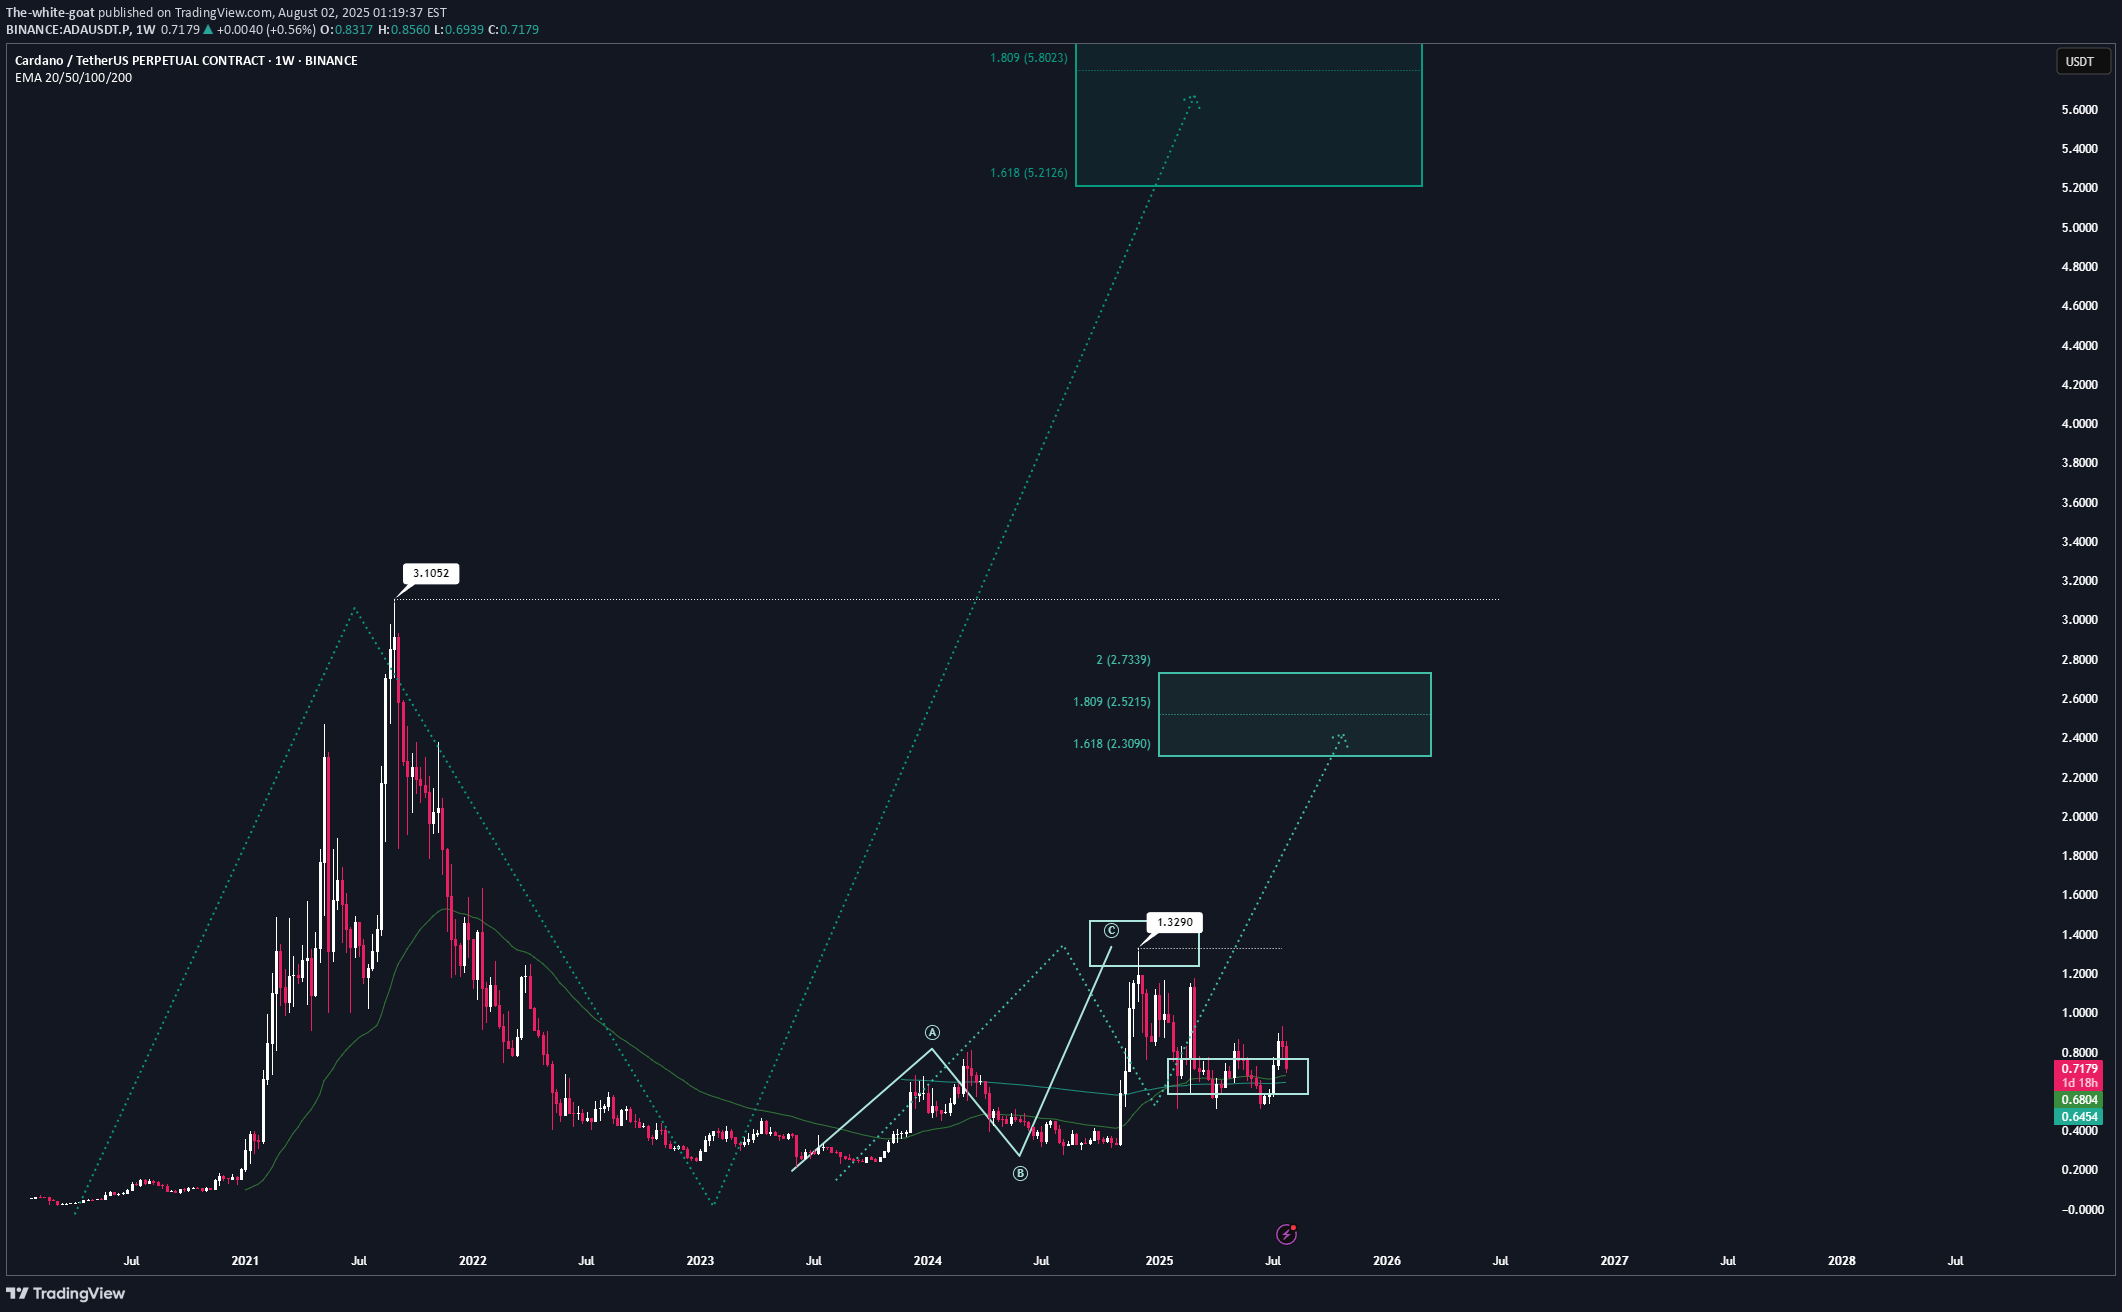
Here is the top-down analysis for ADA as requested 🫡 Weekly Timeframe: We have one large potential sequence on the weekly chart that will be activated once we break the ATH at $3.1, with a target zone around $5.2. This is also my conservative target for this bull run, assuming we get the “altseason” everyone is hoping for. We’ve also already completed a smaller sequence on the weekly chart and then corrected into the overall correction level. If we break the November high at $1.3, we will also activate a new structure that could take us close to the ATH. Daily Chart: On the daily chart, we were rejected at the bearish reversal area (green) and corrected down into the B–C correction level, followed by a continuation into the target zone. According to the rulebook, I expect a bounce from these regions and have positioned myself accordingly with 4 long orders — one at each level. Local price action: On the 4H chart, we have a bearish sequence that is counter to the primary scenario. Statistically, it’s less likely to play out, but it’s still worth noting. The bearish reversal area (blue) is the next key level to watch if we get a bounce here. If this area is broken, the follow-up move becomes very likely. ----- Thats the my full Analysis for ADA , hope it was helpful if you want me to do another analysis for any other pair just comment down below. Also, if anyone is interested in how my trading system works, let me know and I’ll post some educational content about it. Thanks for reading❤️
The-white-goat
SEI | Full Analysis
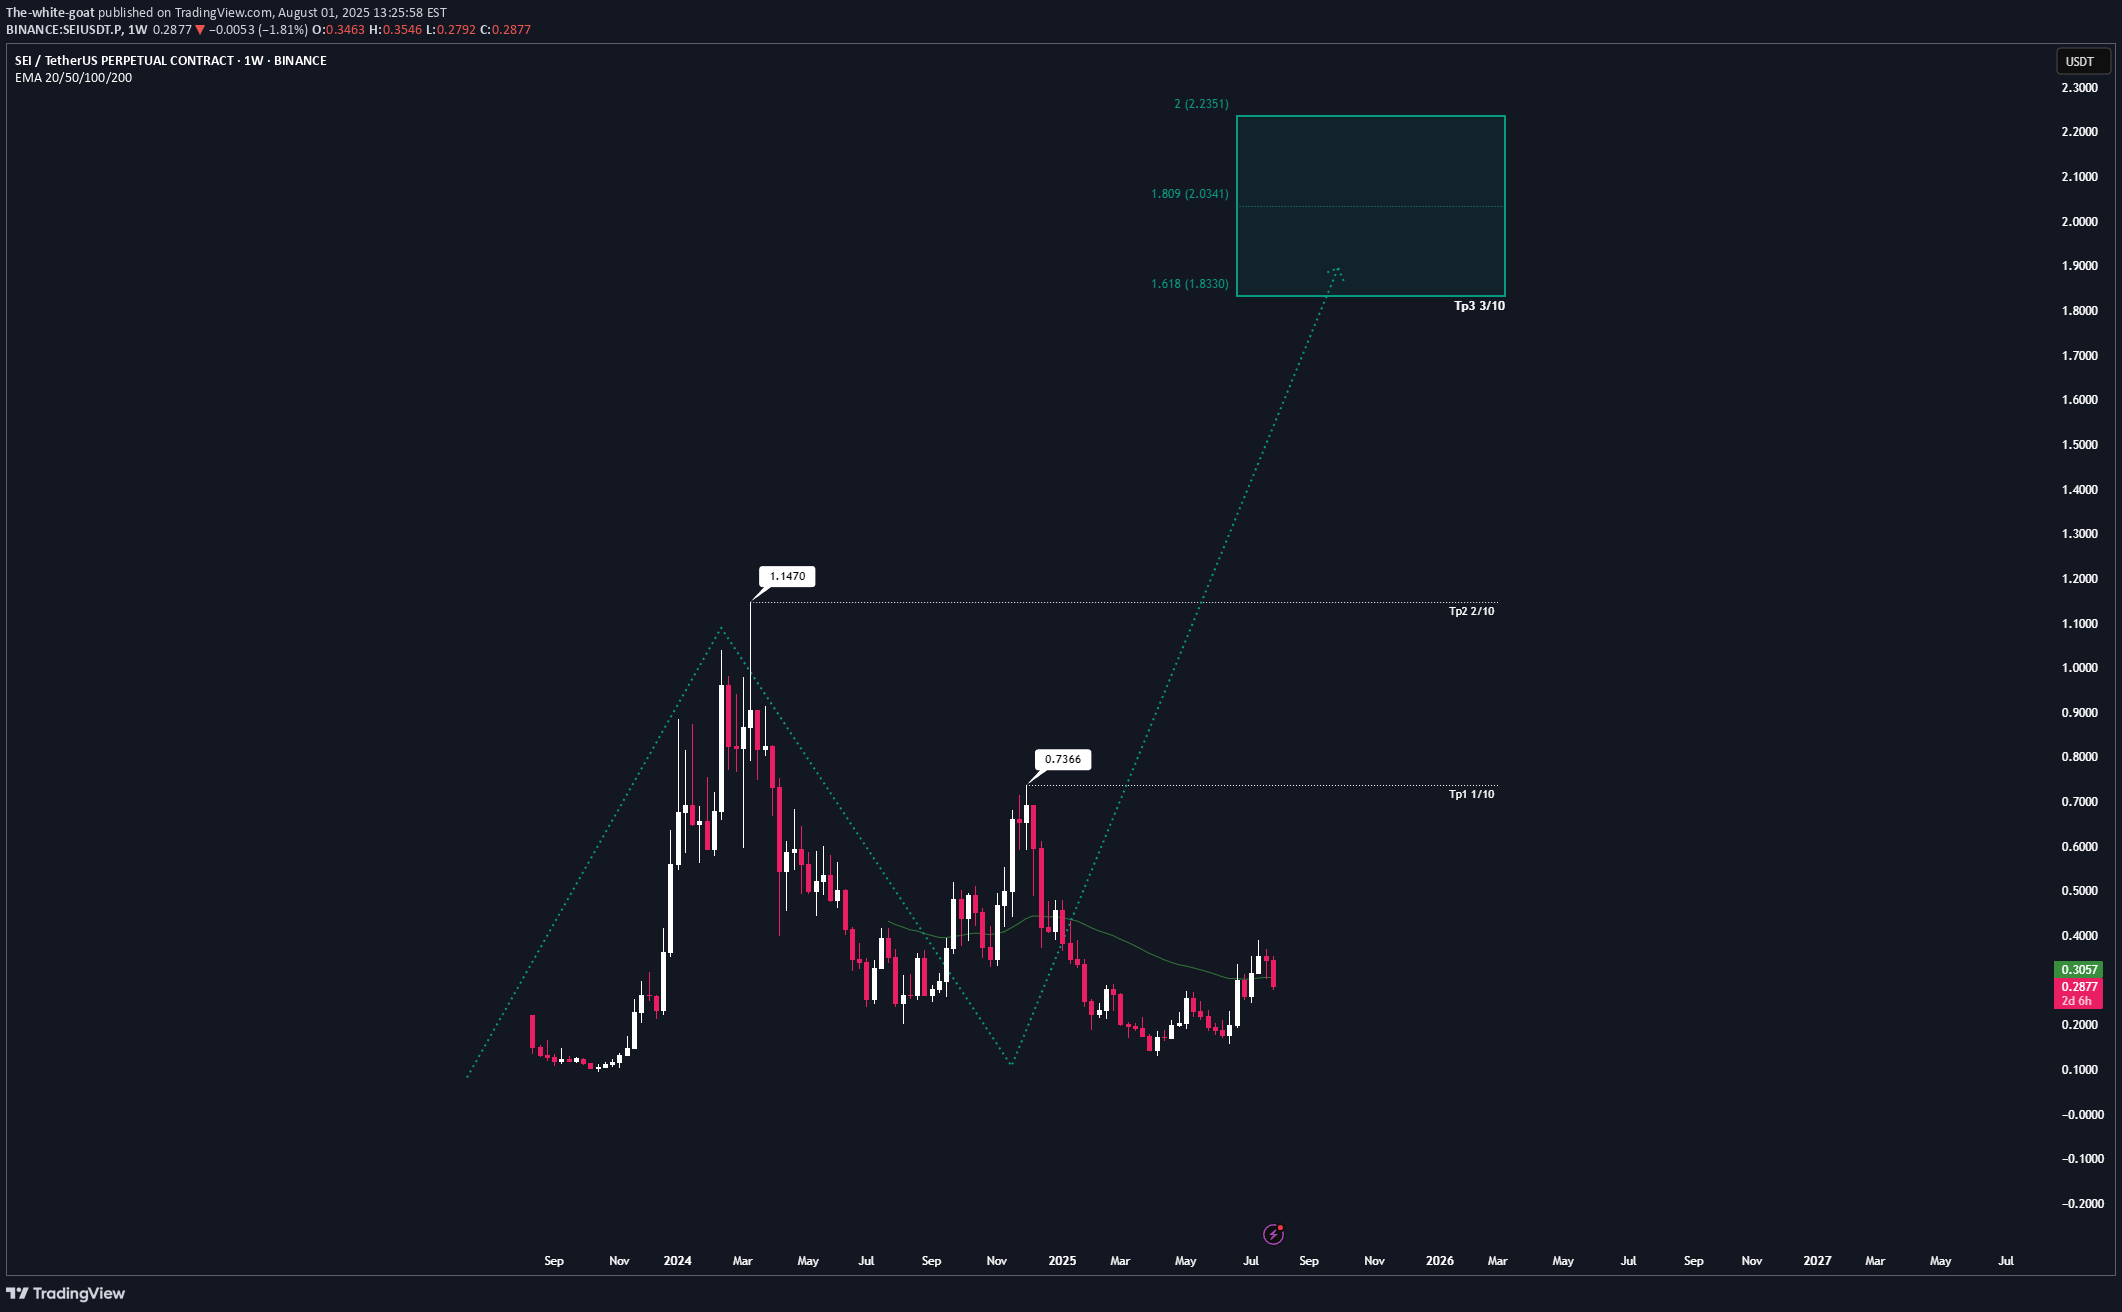
Here is the top-down analysis for Sei as requested 🫡 Weekly Timeframe: We have a potential large structure forming on the weekly chart that will be activated once we break the ATH. Its target zone lies between $1.8 and $2.2. My sell targets for SEI this cycle are: TP1: $0.73 TP2: $1.14 TP3: $1.83 These are my sell targets based on my technical analysis. However, I won’t rely on them alone — I also follow several on-chain indicators. Once retail euphoria kicks in and my indicators trigger, I’ll start selling accordingly. Daily chart: On the daily, we have a sequence that has already been activated and almost reached its target zone. That’s why the B–C correction level remains a valid buy zone, which I’ll also use for additional long entries. This would be the second attempt from a B–C correction level, as we’ve already tapped it once (where I went long) and I’ll be entering again here. Target zone for this sequence: $0.39–$0.44 Local Price action: On the lower timeframe, we’ve just completed a bearish structure that perfectly overlaps with the B–C correction level. This increases the probability of this setup significantly, as both sides (bulls and bears) want the same thing here: bulls are buying the market, while bears are covering shorts and taking profits. ----- Thats the my full Analysis for SEI, hope it was helpful if you want me to do another analysis for any other pair just comment down below. Also, if anyone is interested in how my trading system works, let me know and I’ll post some educational content about it. Thanks for reading❤️
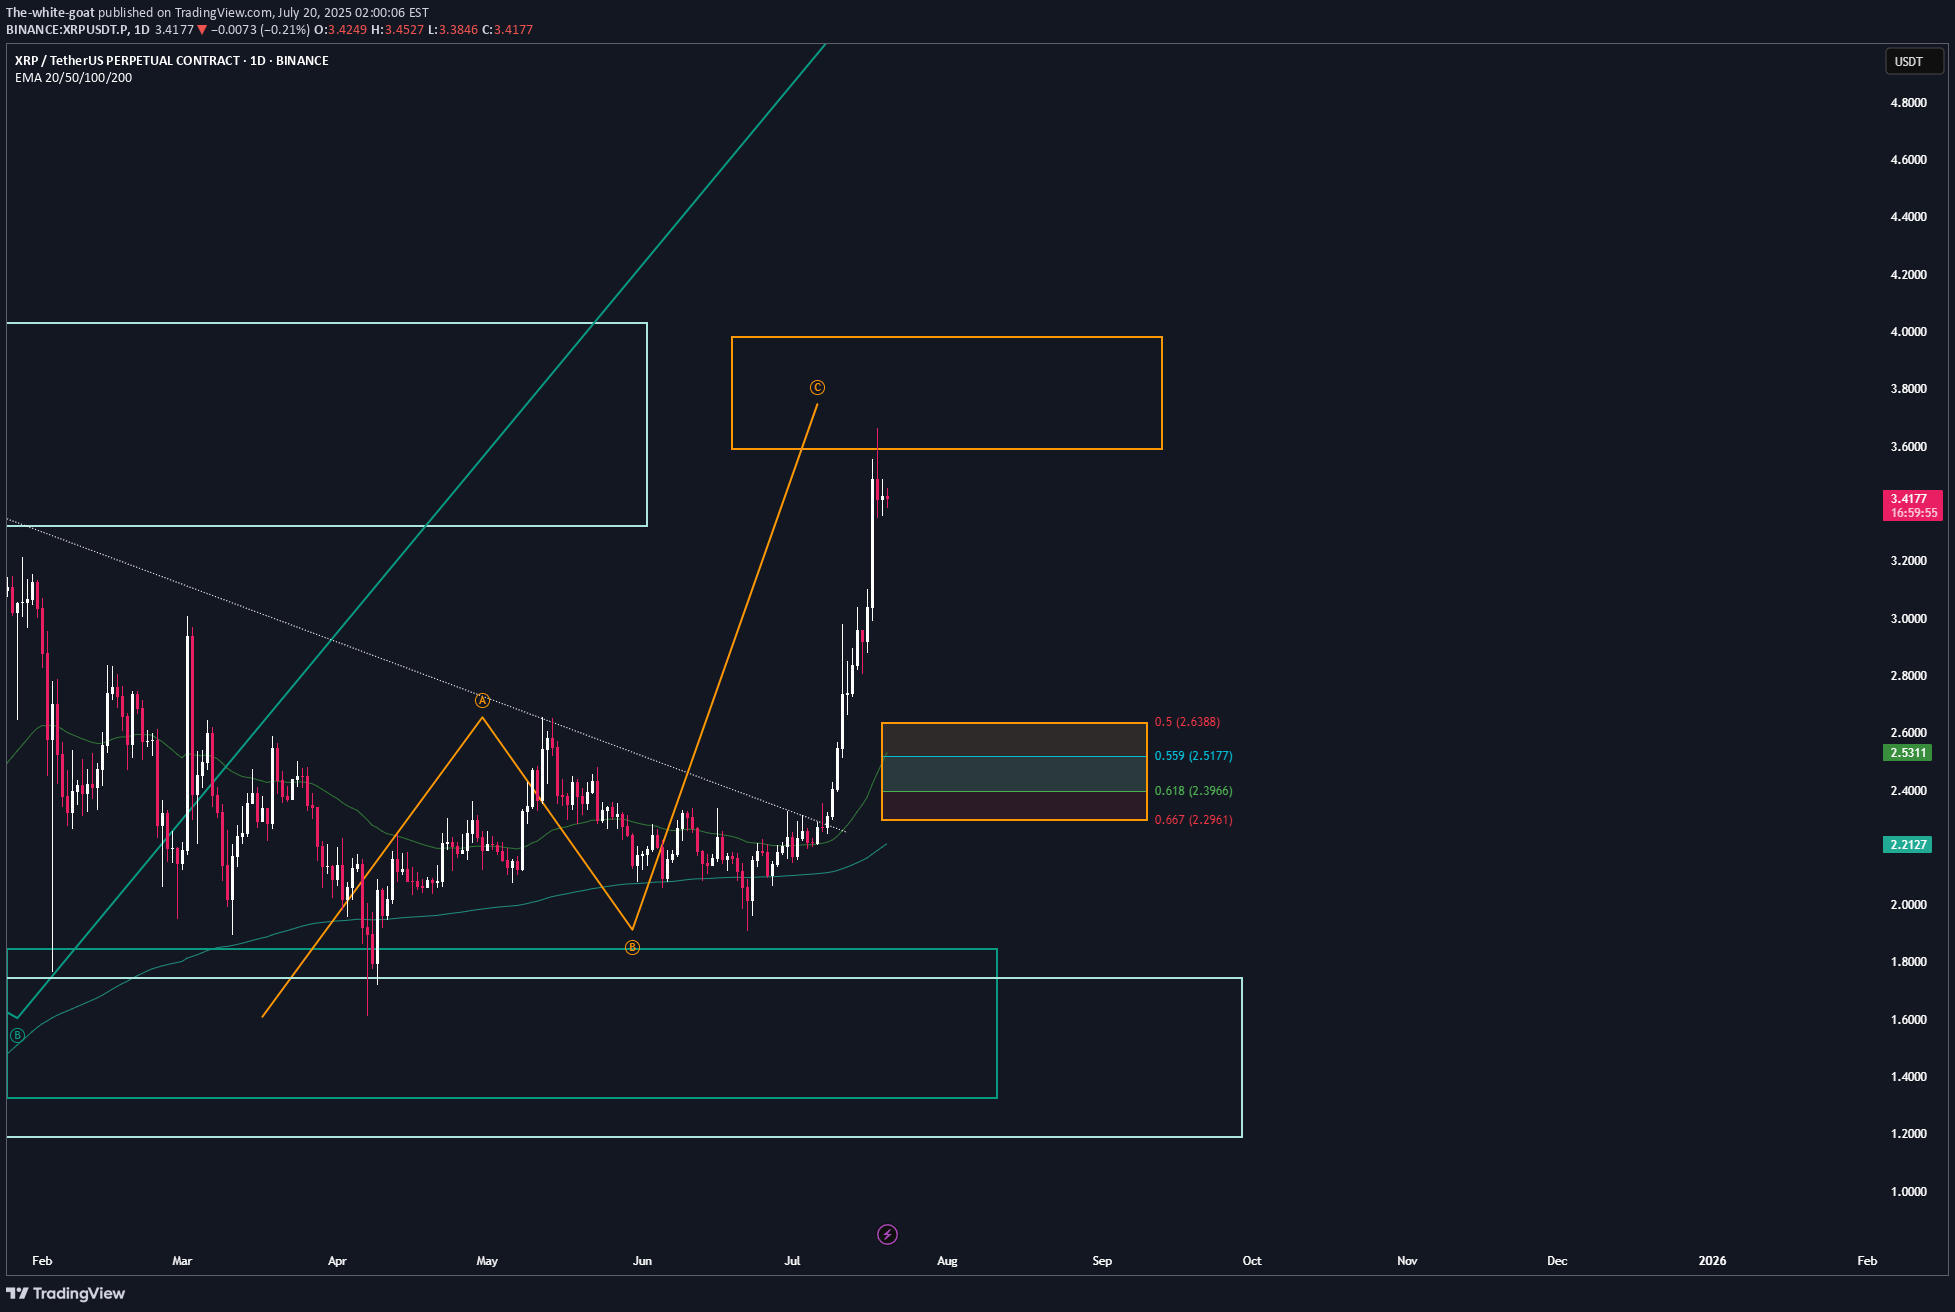
The-white-goat
XRP | Full Analysis
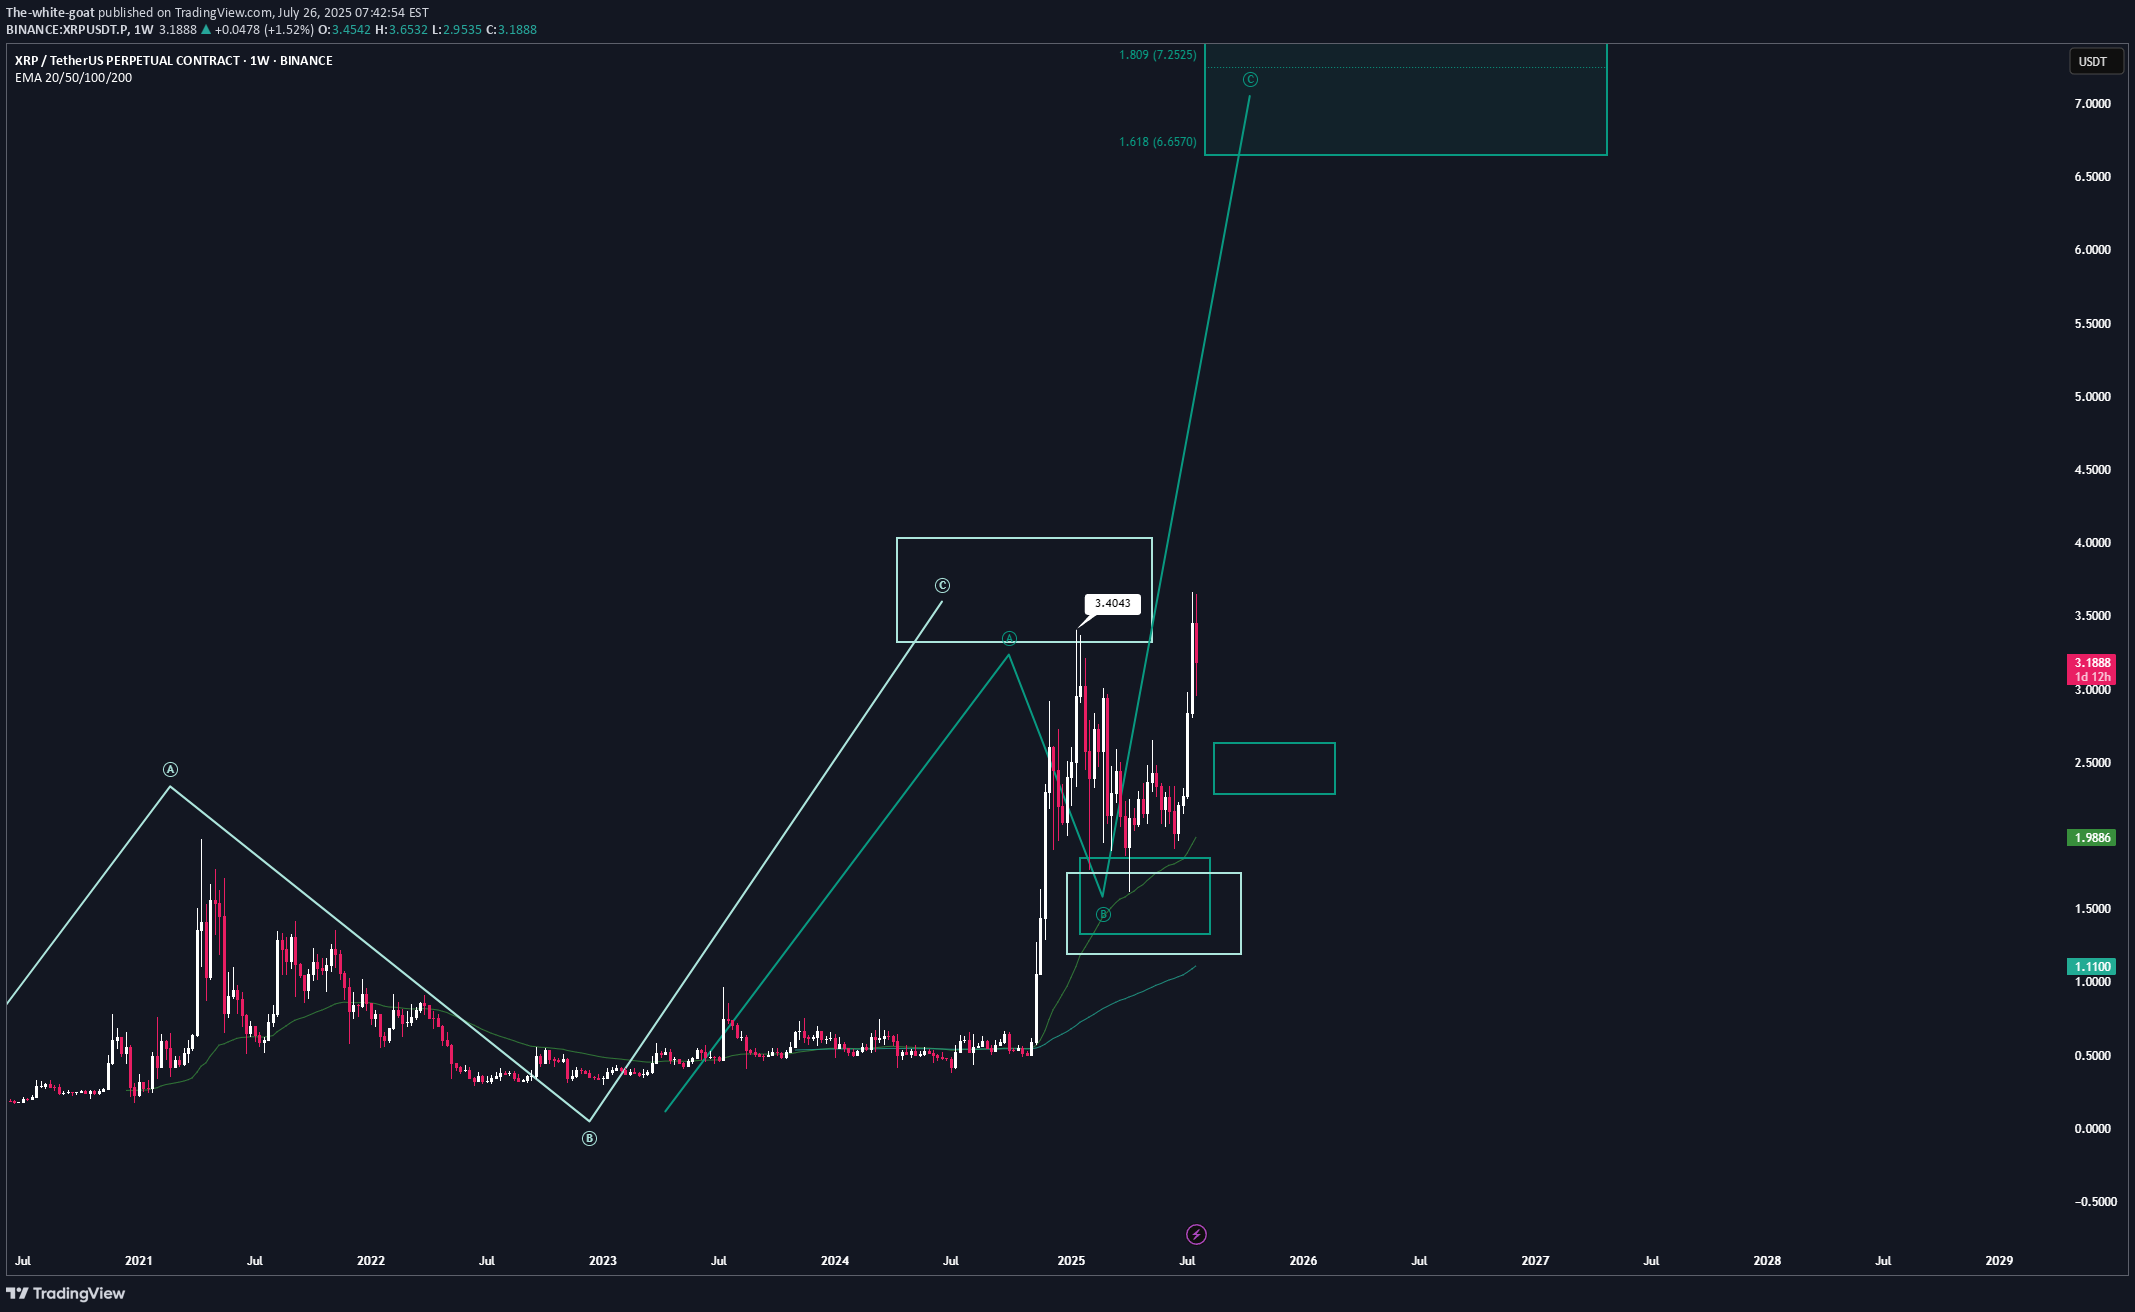
Here is the full analysis for XRP as requested 🫡 Let’s start with the weekly timeframe: With the recent breakout above the $3.40 high, we’ve activated a new, larger bullish sequence on the weekly chart. This sequence has its target region between $6.57 and $7.84, which I believe we will reach at minimum during this bull run. From now on, every pullback into the B-C correction area (turquoise) can be considered a legitimate re-entry opportunity. Daily chart: We successfully broke the all-time high with another breakout sequence (orange), which has already completed its target region. Now, we’re trading the overall correction level — this is the same area as the B-C correction area from the weekly timeframe. It’s the Fibonacci retracement drawn from the start of the move to point C. Local Price Action: After reaching the target zone (orange), we activated a new bearish sequence in the upper region, which has just completed its target zone. Now we expect a move back into the overall correction level (blue), and after that, according to the rulebook, the next legitimate U-turn could follow. It gets really interesting if we enter the overall correction level and then start forming a bearish structure on the lower timeframes — this is where we can apply a multi-timeframe approach, which significantly increases the probability of a successful trade. ----- Thats the my full Analysis for XRP , hope it was helpful if you want me to do another analysis for any other pair just comment down below. Also, if anyone is interested in how my trading system works, let me know and I’ll post some educational content about it. Thanks for reading❤️
The-white-goat
ARB | Full-analysis
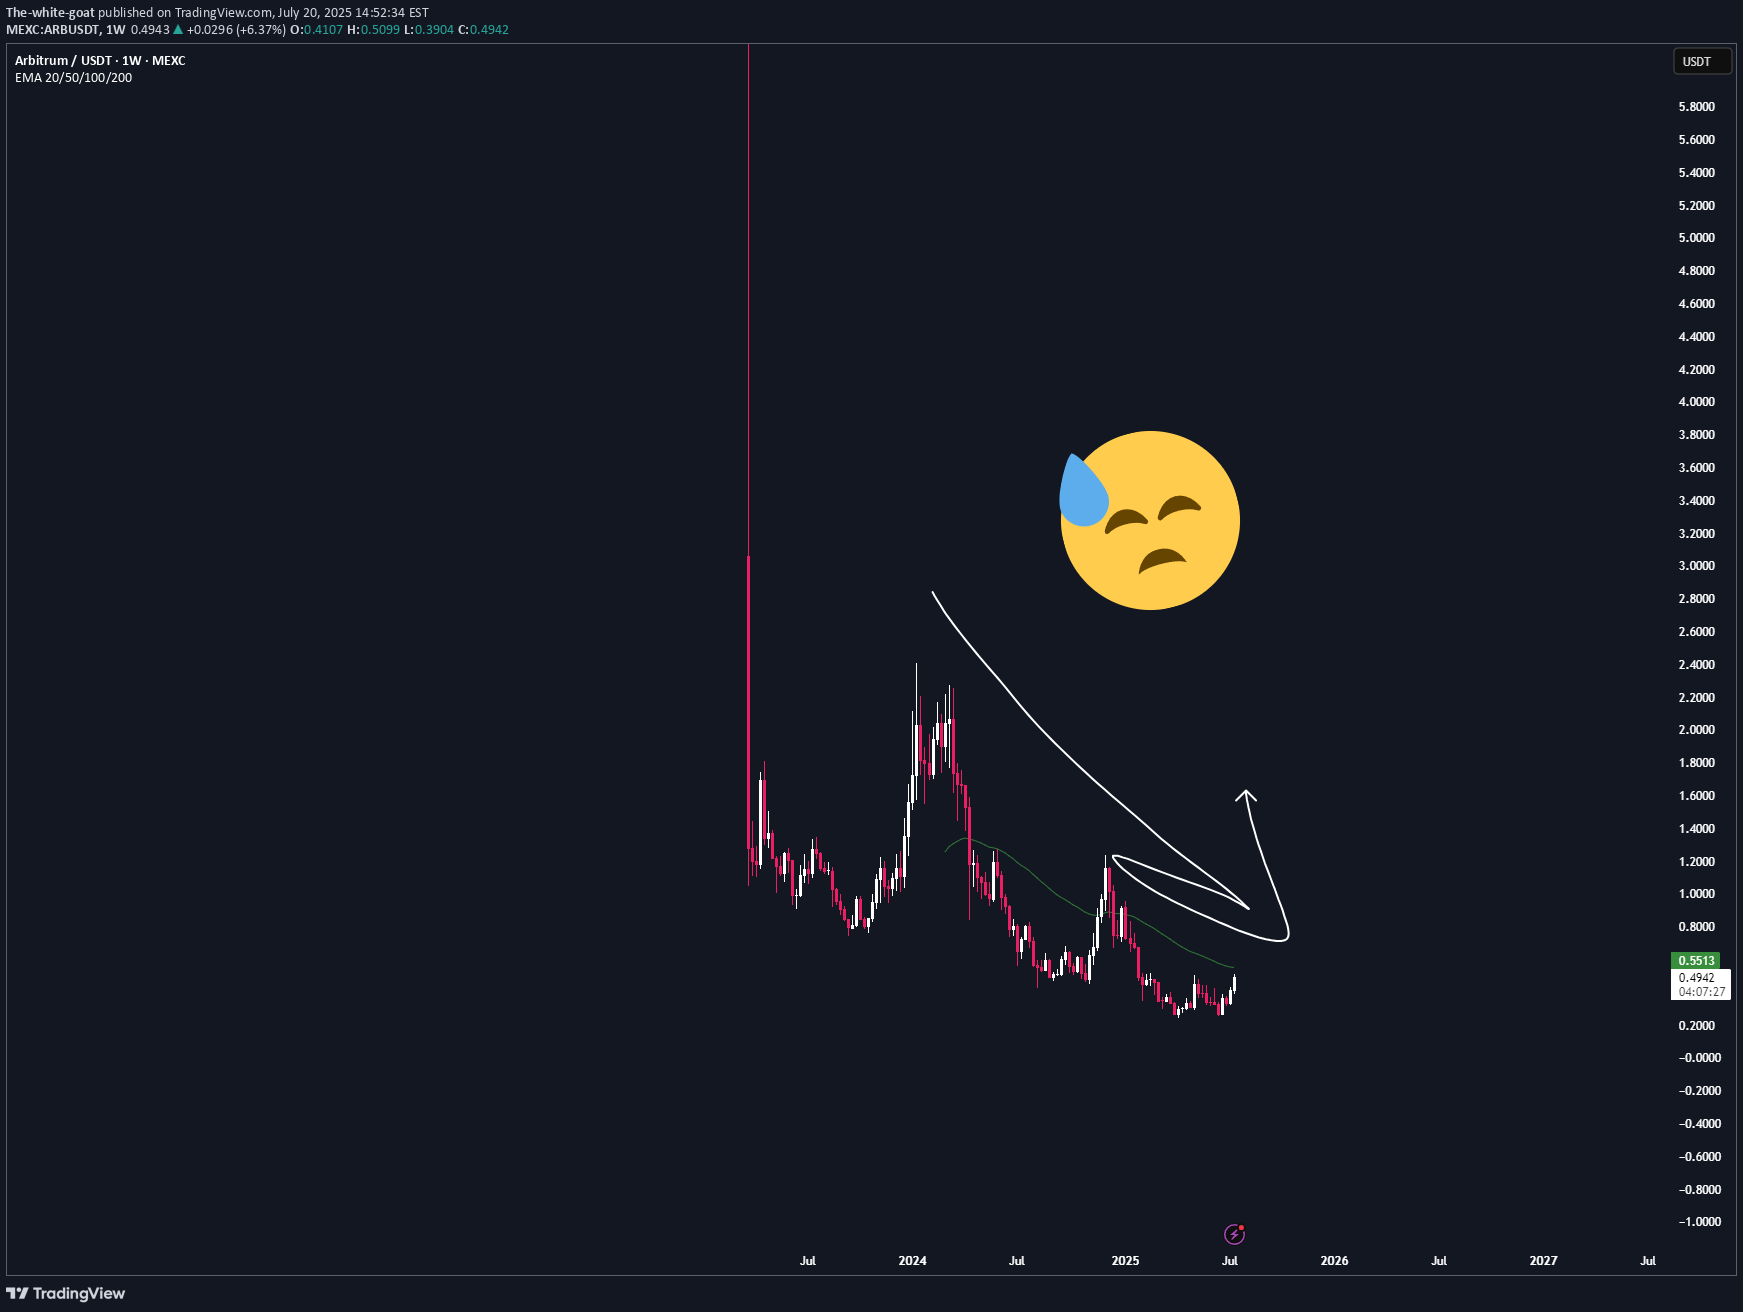
Here is the top-down analysis for ARB as requested 🫡 Weekly Timeframe: There are currently no valid bullish structures on the weekly chart, as ARB has put in lower lows. So we have no clear targets from a weekly perspective at this point. Daily Chart: A new bullish sequence was just activated with the break of the recent high at $0.505, targeting the $0.67–0.77 region. This strongly suggests that the cycle low for ARB is likely in. Every pullback into the B–C correction zone (Fib 0.5–0.667) is a potential long opportunity, and I plan to take it if we revisit that area. I will place 4 long orders, each with a stop-loss just below the next level. There is currently nothing interesting happening on the lower timeframes. -------- Thats the my full Analysis for ARB , hope it was helpful if yall have anymore questions feel free to ask, and if you want me to do another analysis for any other pair just comment down below. Thanks for reading❤️
The-white-goat
AVAX | Full Analysis
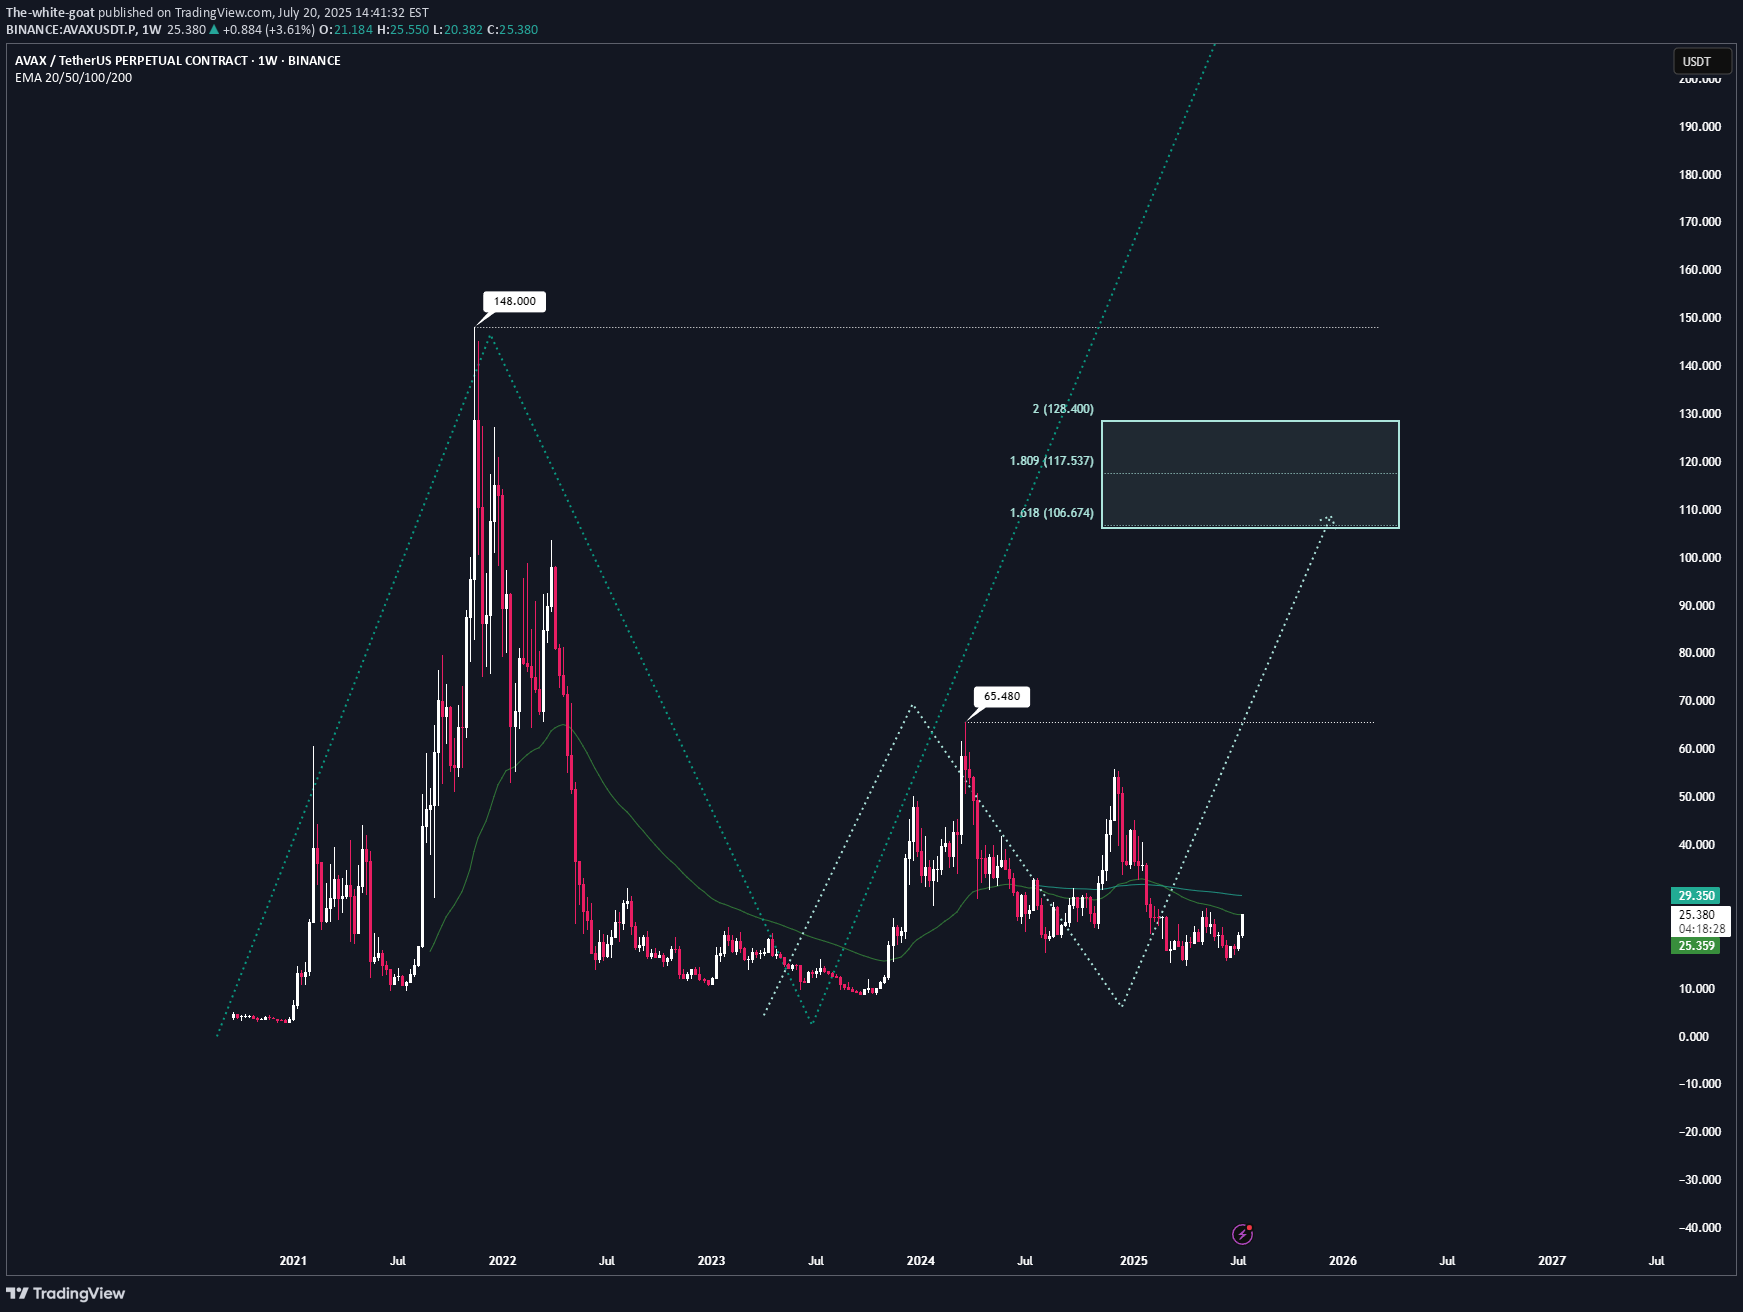
Here is the top-down analysis for AVAX as requested 🫡 Weekly Timeframe: We currently have two potential bullish structures on the weekly chart, but neither has been activated yet. The first one (light turquoise) will be activated once we break the local high at $65. Until then, there's no valid trade setup. This sequence has it target range at $106–128. The second structure (turquoise) gets activated once we break the all-time high at $148. It then targets the $242–298 range, which also represents my conservative bull run targets for $AVAX. On the weekly chart, the strategy is to HODL. I wouldn't buy at this point, and I definitely wouldn't sell—because if we see another altcoin season (which in my view is nearly guaranteed), there's no reason AVAX shouldn't reach its targets around $242. I would personally start taking profits at $106, then again at $148, and be fully out at $242. Daily chart: Here we have a potential structure that will be activated once we break the recent high at $26. From that point on, according to the rulebook, every pullback into the B–C correction level (Fib 0.5–0.667) becomes a tradable opportunity. Local Priceaction: Three days ago, we successfully broke through the bearish reversal zone (red) and reached the bullish target zone (turquoise). Now, every pullback into the B–C correction area becomes a valid long entry. If the price turns around and reaches that area again, I’ll trade each level with a stop-loss just below the next key level. -------- Thats the my full Analysis for AVAX , hope it was helpful if yall have anymore questions feel free to ask, and if you want me to do another analysis for any other pair just comment down below. Thanks for reading❤️
The-white-goat
XRP | Trade-setup
📌 Now that the target region has been reached, XRP is now allowed to approach its full correction level. Trademanagement: - I'm placing long orders at each level and SL right before the next level. (If the price continues climbing, I’ll adjust the trend reversal level (orange) accordingly and update my limit orders.) - Once the trade reaches a 2 R/R, I’ll move the stop-loss to break-even. - From a 3 R/R onward, I’ll start locking in profits. ✅ I welcome every correction from here on — but I won’t enter any new positions at these top levels.
The-white-goat
ETH | Trade setup
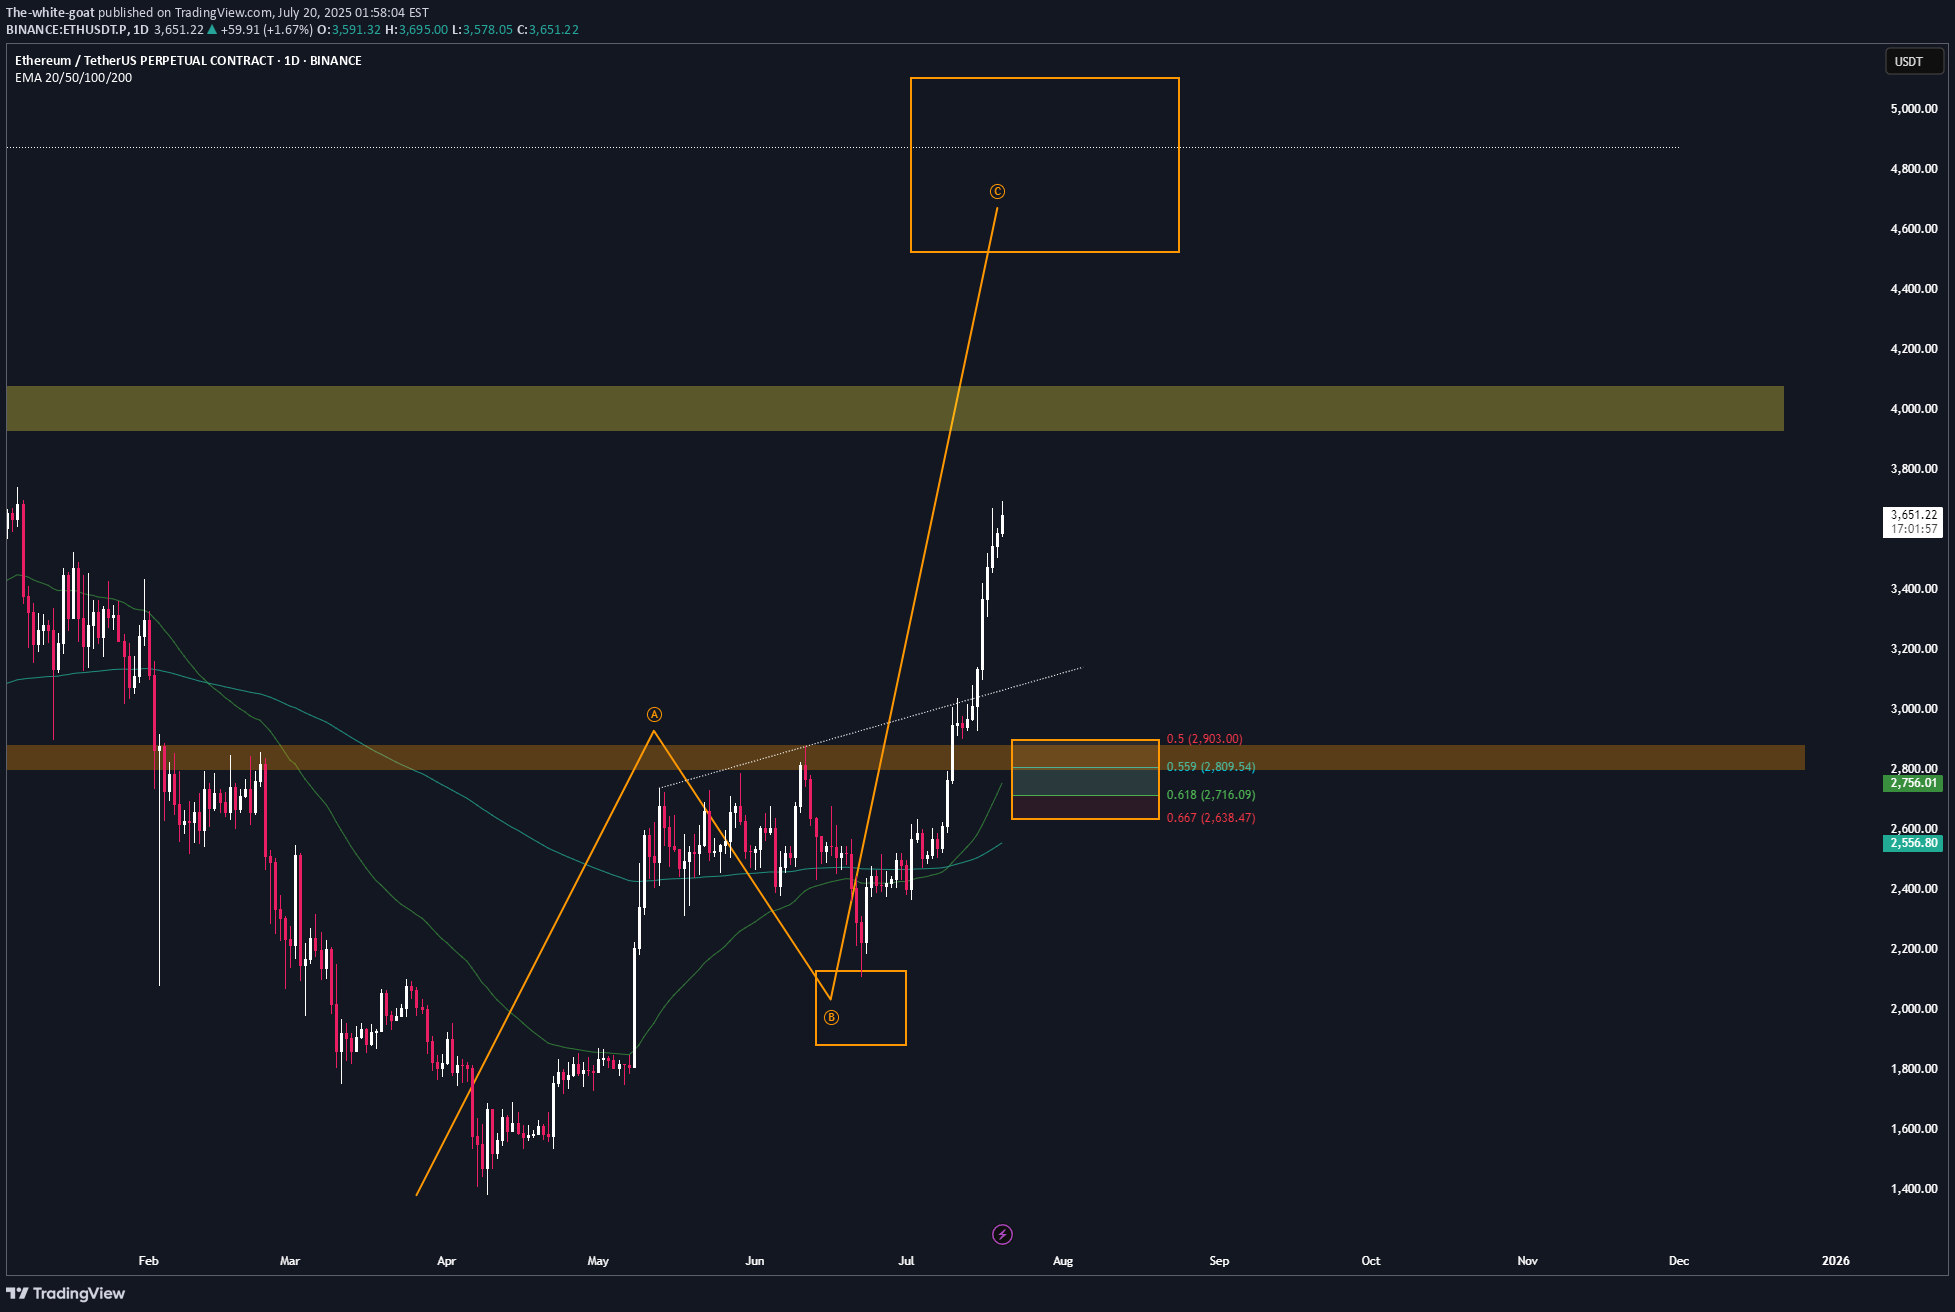
📌 After the breakout from the last high at $2.9k, a bullish sequence (orange) has now been activated. 📊 These setups typically occur no more than twice per year on any given altcoin, so I’ll be aggressively buying each level at the B-C retracement area. Trademanagement: - I'm placing long orders at each level and SL right before the next level. (If the price continues climbing, I’ll adjust the trend reversal level (orange) accordingly and update my limit orders.) - Once the trade reaches a 2 R/R, I’ll move the stop-loss to break-even. - From a 3 R/R onward, I’ll start locking in profits. ✅ I welcome every correction from here on — but I won’t enter any new positions at these top levels.
The-white-goat
CHainLink | Trade-Setup
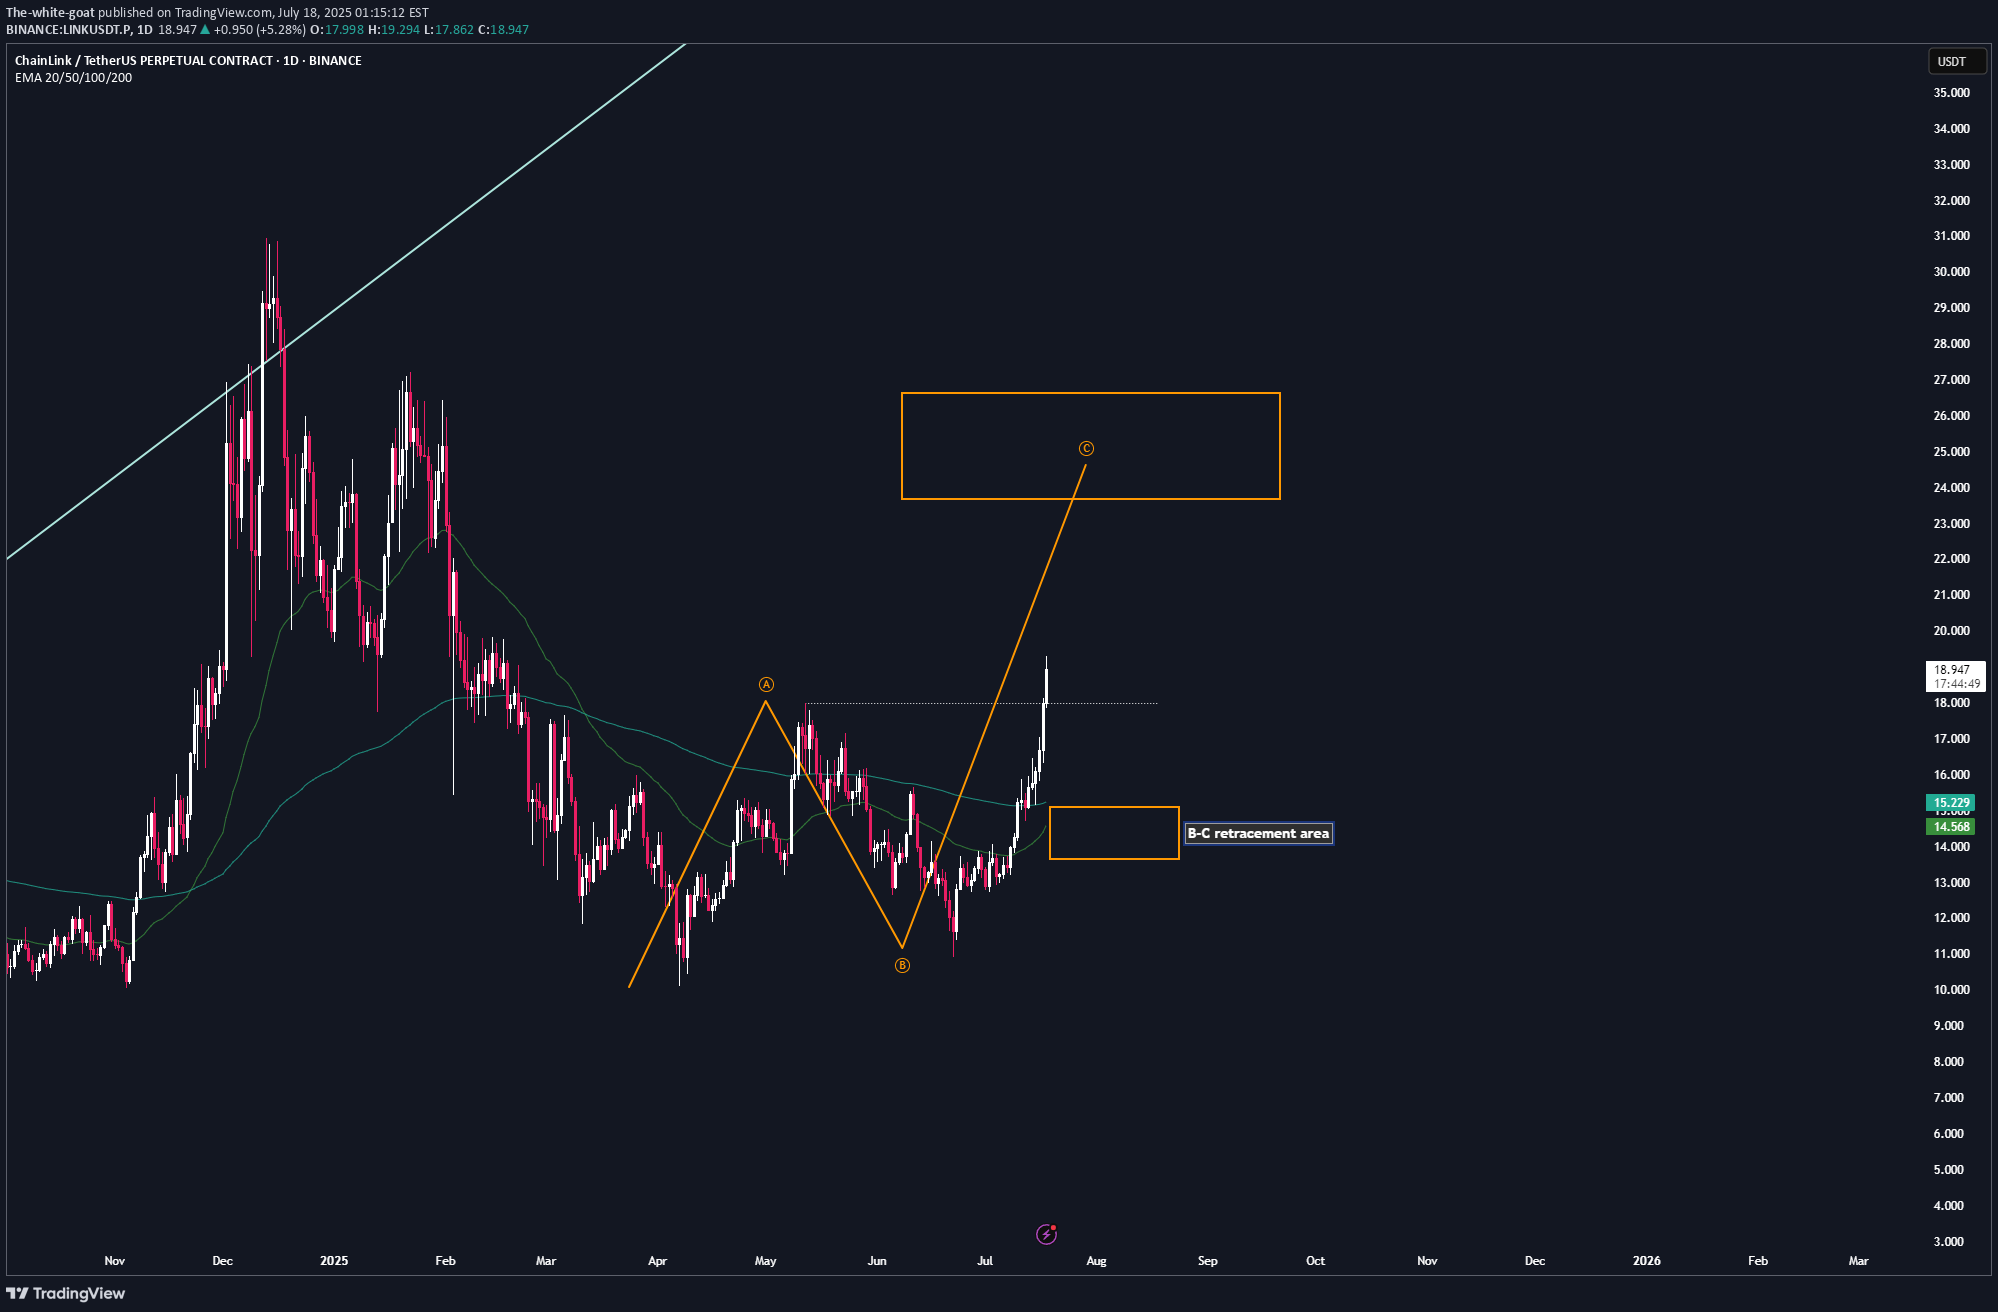
📌 After the breakout from the last high at $18, a bullish sequence (orange) has now been activated. 📊 These setups typically occur no more than twice per year on any given altcoin, so I’ll be aggressively buying each level at the B-C retracement area. Trademanagement: - I'm placing long orders at each level. ((If the price continues climbing, I’ll adjust the trend reversal level (green) accordingly and update my limit orders.) - Once the trade reaches a 2 R/R, I’ll move the stop-loss to break-even. - From a 3 R/R onward, I’ll start locking in profits. ✅ I welcome every correction from here on — but I won’t enter any new positions at these top levels. Stay safe & lets make money
The-white-goat
ADA | Trade setup
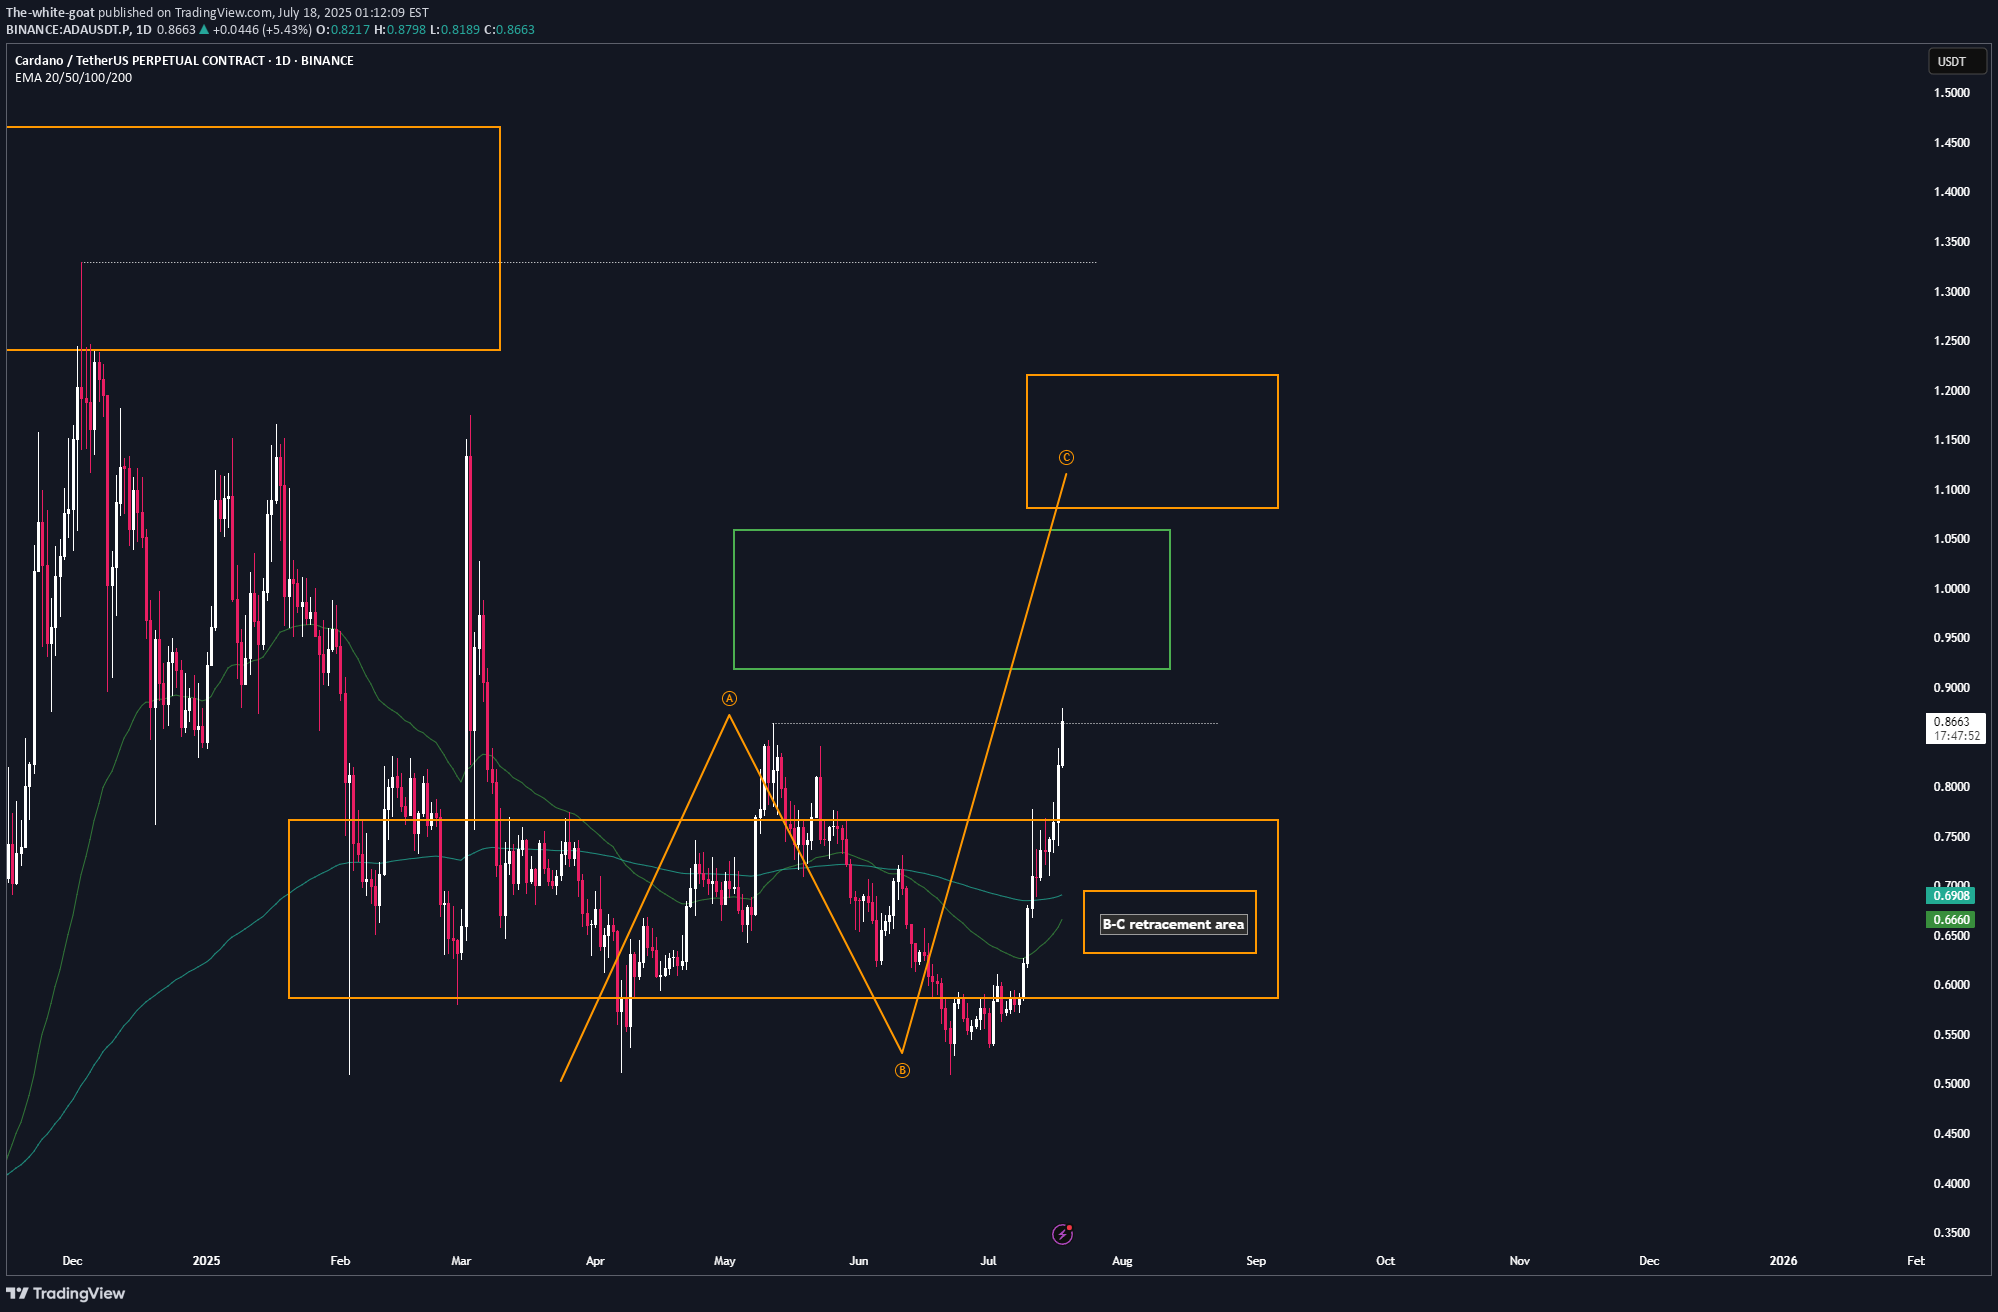
📌 After the breakout from the last high at $0.86, a bullish sequence (orange) has now been activated. 📊 These setups typically occur no more than twice per year on any given altcoin, so I’ll be aggressively buying each level at the B-C retracement area. Trademanagement: - I'm placing long orders at each level. ((If the price continues climbing, I’ll adjust the trend reversal level (green) accordingly and update my limit orders.) - Once the trade reaches a 2 R/R, I’ll move the stop-loss to break-even. - From a 3 R/R onward, I’ll start locking in profits. ✅ I welcome every correction from here on — but I won’t enter any new positions at these top levels. Stay safe & lets make money
Disclaimer
Any content and materials included in Sahmeto's website and official communication channels are a compilation of personal opinions and analyses and are not binding. They do not constitute any recommendation for buying, selling, entering or exiting the stock market and cryptocurrency market. Also, all news and analyses included in the website and channels are merely republished information from official and unofficial domestic and foreign sources, and it is obvious that users of the said content are responsible for following up and ensuring the authenticity and accuracy of the materials. Therefore, while disclaiming responsibility, it is declared that the responsibility for any decision-making, action, and potential profit and loss in the capital market and cryptocurrency market lies with the trader.