
Sthesh_Don_Billiato
@t_Sthesh_Don_Billiato

What symbols does the trader recommend buying?
Purchase History
پیام های تریدر
Filter
Sthesh_Don_Billiato
خرید طلا (XAUUSD): سیگنال صعودی در حمایت کلیدی ۲۳۰۰ دلار!
🎯 Idea Summary: · Direction: Long · Instrument: XAUUSD (Spot Gold) · Primary Timeframe: 4H · Bias: Bullish (Counter-trend bounce) 📊 Technical Rationale: · Market Structure: The longer-term trend is still bullish, but price has corrected into a major support zone. Looking for a bounce. · Key Levels: · Support: $2315** (Previous Resistance), **$2300 (Major Psychological & Swing Low) · Resistance: $2340** (Recent Swing High), **$2355 (21 EMA) · Price Action / Pattern: Price is approaching the $2315 support. Watching for a bullish reversal candle (like a hammer or bullish engulfing) for a confirmation signal. · Confluence: · The $2315 level coincides with the 61.8% Fibonacci retracement of the last major up-move. · RSI is entering oversold territory (<30), suggesting selling pressure may be exhausting. ⚙️ Trade Setup: · Entry Zone: $2315 - $2320 (On a bullish confirmation candle) · Stop Loss: $2305 (Just below the key $2300 psychological level and the Fib level) · Take Profit Targets: · TP1: $2340 (First resistance, take 50% off) · TP2: $2350 (21 EMA & next resistance) · Risk-Reward Ratio: ~1:2.5 💡 Narrative / Fundamental Context: This is a mean-reversion play within a bull market.The confluence of a major Fibonacci level, prior support, and oversold RSI creates a high-probability zone for a technical bounce. A break below $2300 would signal a much deeper correction is likely. Disclaimer: This is my personal analysis and not financial advice. Trading commodities like gold carries a high level of risk. Always do your own research (DYOR) and manage your risk appropriately.
Sthesh_Don_Billiato
Xrp Buy zone

📊 XRP/USDT Chart Breakdown 1️⃣ Price Structure Overview * The chart spans roughly from November 2024 to June 2025. * We observe clear market structure changes: * BOS (Break of Structure) and CHoCH (Change of Character) labels mark shifts between bullish and bearish trends. * The current price is consolidating around the \$2.17–\$2.18 level. * Recent local low at \~ \$2.06 (marked as a strong liquidity area). 2️⃣ Key Levels and Zones * Demand Zones (Support) * \$2.06 (strong low marked). * Grey and blue shaded zones from \~ \$2.00–\$2.18 acting as a major support cluster. * Supply Zones (Resistance) * \$2.42 (0.382 Fib retracement). * \~\$2.85 (0.618 Fib) to \$3.19 (recent weak high) – high probability resistance on rally. * Psychological resistance around \$3.00. 3️⃣ Fibonacci Retracement & Extension * The Fib tool is applied from the last significant swing high (\~\$3.22)cto the current local swing low (\~\$2.06). * Fib Key Levels: * 0.382 → \$2.42 * 0.5 → \$2.64 * 0.618 → \$2.85 * Full extension → \$3.22 * Price currently testing the 0.382–0.5 range, signaling potential bullish continuation if broken. 4️⃣ Liquidity Zones * The blue shaded region (\~\$2.00–\$2.18) is a major liquidity zone with strong historical reaction. * Multiple CHoCH points in May-June indicate a possible trend shift to bullish if price holds above \$2.06 and clears \$2.42. 5️⃣ Market Context * Daily Structure:Range-bound but with an emerging bullish bias after the \$2.06 low held. * Current Pattern: Accumulation phase after liquidation sweep below \$2.06, possibly gearing for breakout if market conditions stay favorable. 🏆 Correlation with BTC – Recent 7 Weeks of Bullish Momentum 1️⃣ BTC Context * Bitcoin has been on a sustained 7-week bullish run, breaking key resistance levels and reaching new 2025 highs. * This has improved overall crypto market sentiment, leading to increasing altcoin interest. * BTC Dominance is slightly high but showing signs of topping → good for large-cap altcoins like XRP. 2️⃣ Impact on XRP * XRP is attempting to reclaim major levels and follow BTC’s momentum. * BTC’s rally is pulling liquidity into the crypto market, benefiting XRP’s chances of a **breakout above \$2.42–\$2.64. * If BTC consolidates or slightly pulls back without major weakness, XRP could see a strong move towards **\$2.85–\$3.00. --- 3️⃣ Watch For * BTC holding above recent highs → more confidence for altcoins. * BTC correcting sharply → XRP may retest **\$2.06** or lower. * XRP key breakout: **\$2.42–\$2.64** → if broken with volume, targets \$2.85+. 📈 Summary ✅ XRP is currently in **accumulation mode** above a strong demand zone. ✅ Market structure shows **recent CHoCH indicating potential bullish reversal**. ✅ BTC’s 7-week rally has provided a **favorable environment** for XRP to rally if momentum continues. ✅ Critical level to reclaim: **\$2.42**. ✅ Bullish target if broken: **\$2.85–\$3.22**. ✅ Caution: BTC correction could stall XRP at current support.
Sthesh_Don_Billiato
XAU / GOLD Re-entry

🟡 Why Gold Has Been Buying: Fundamentals: Possible rate cut expectations from the Fed. Geopolitical tensions or inflation concerns. Weakening USD momentum. Technical Confirmation (if we checked the chart): Break above key resistance or consolidation zones. Higher lows forming on the 4H and daily charts. Volume supporting the breakout. Let me break it down: 🔍 Technical Analysis Breakdown 1. Breakout Confirmation You correctly identified a descending triangle breakout above the black trendline. Price has pulled back to retest the breakout zone — this is classic market structure behavior (break–retest–continue). 2. Elliott Wave or Structure Flow Your marked path shows a pullback (possibly wave 2) before continuation — smart projection. That "V" pattern forming right now looks like a bullish continuation setup. 3. Fibonacci and Demand Zone The retest aligns near the 38.2% or 50% retracement — high-probability reversal zones. You also have a strong demand zone (grey box) acting as a support floor. 4. Projection: Targeting 3496–3500 area is reasonable — that’s a psychological + fib confluence zone. If price reacts as expected on the retest, this long setup has great R:R potential. 📅 Key Risk: News Events You have three red folder USD events marked around June 5–6 — likely NFP week or another key data drop. That could cause volatility spikes — wise to expect short-term shakeouts before continuation. 🟡 XAUUSD 4H Analysis – Breakout Retest for Bullish Continuation Gold recently broke out of a long-term descending trendline, showing strong bullish momentum. After the breakout, price is now pulling back to retest the broken structure — a classic "break and retest" setup. I'm expecting a short-term dip into the previous resistance-turned-support zone around 3330–3310, aligning with the 38.2–50% Fibonacci retracement and a key demand area. 🔵 Trade Plan: Looking for bullish confirmation at the retest zone. Targeting the 3496–3500 level (previous high + Fib extension confluence). Bullish structure remains valid as long as price holds above 3300. ⚠️ Fundamental Note: Upcoming high-impact USD news (NFP, etc.) may cause short-term volatility. Patience and tight risk management are key. 📈 Bias: Bullish 🕓 Timeframe: 4H 🔍 Strategy: Breakout → Retest → Continuation
Sthesh_Don_Billiato
Xau re-entry/ retracement

🟡 Why Gold Has Been Buying: Fundamentals: Possible rate cut expectations from the Fed. Geopolitical tensions or inflation concerns. Weakening USD momentum. Technical Confirmation (if we checked the chart): Break above key resistance or consolidation zones. Higher lows forming on the 4H and daily charts. Volume supporting the breakout. Let me break it down: 🔍 Technical Analysis Breakdown 1. Breakout Confirmation You correctly identified a descending triangle breakout above the black trendline. Price has pulled back to retest the breakout zone — this is classic market structure behavior (break–retest–continue). 2. Elliott Wave or Structure Flow Your marked path shows a pullback (possibly wave 2) before continuation — smart projection. That "V" pattern forming right now looks like a bullish continuation setup. 3. Fibonacci and Demand Zone The retest aligns near the 38.2% or 50% retracement — high-probability reversal zones. You also have a strong demand zone (grey box) acting as a support floor. 4. Projection: Targeting 3496–3500 area is reasonable — that’s a psychological + fib confluence zone. If price reacts as expected on the retest, this long setup has great R:R potential. 📅 Key Risk: News Events You have three red folder USD events marked around June 5–6 — likely NFP week or another key data drop. That could cause volatility spikes — wise to expect short-term shakeouts before continuation. ✅ Verdict: You're on the right track — this is a clean bullish setup. If price holds above the broken trendline and doesn’t close below 3320–3300, the probability of hitting your TP around 3500 is solid. 🟡 XAUUSD 4H Analysis – Breakout Retest for Bullish Continuation Gold recently broke out of a long-term descending trendline, showing strong bullish momentum. After the breakout, price is now pulling back to retest the broken structure — a classic "break and retest" setup. I'm expecting a short-term dip into the previous resistance-turned-support zone around 3330–3310, aligning with the 38.2–50% Fibonacci retracement and a key demand area. 🔵 Trade Plan: Looking for bullish confirmation at the retest zone. Targeting the 3496–3500 level (previous high + Fib extension confluence). Bullish structure remains valid as long as price holds above 3300. ⚠️ Fundamental Note: Upcoming high-impact USD news (NFP, etc.) may cause short-term volatility. Patience and tight risk management are key. 📈 Bias: Bullish 🕓 Timeframe: 4H 🔍 Strategy: Breakout → Retest → Continuation
Sthesh_Don_Billiato
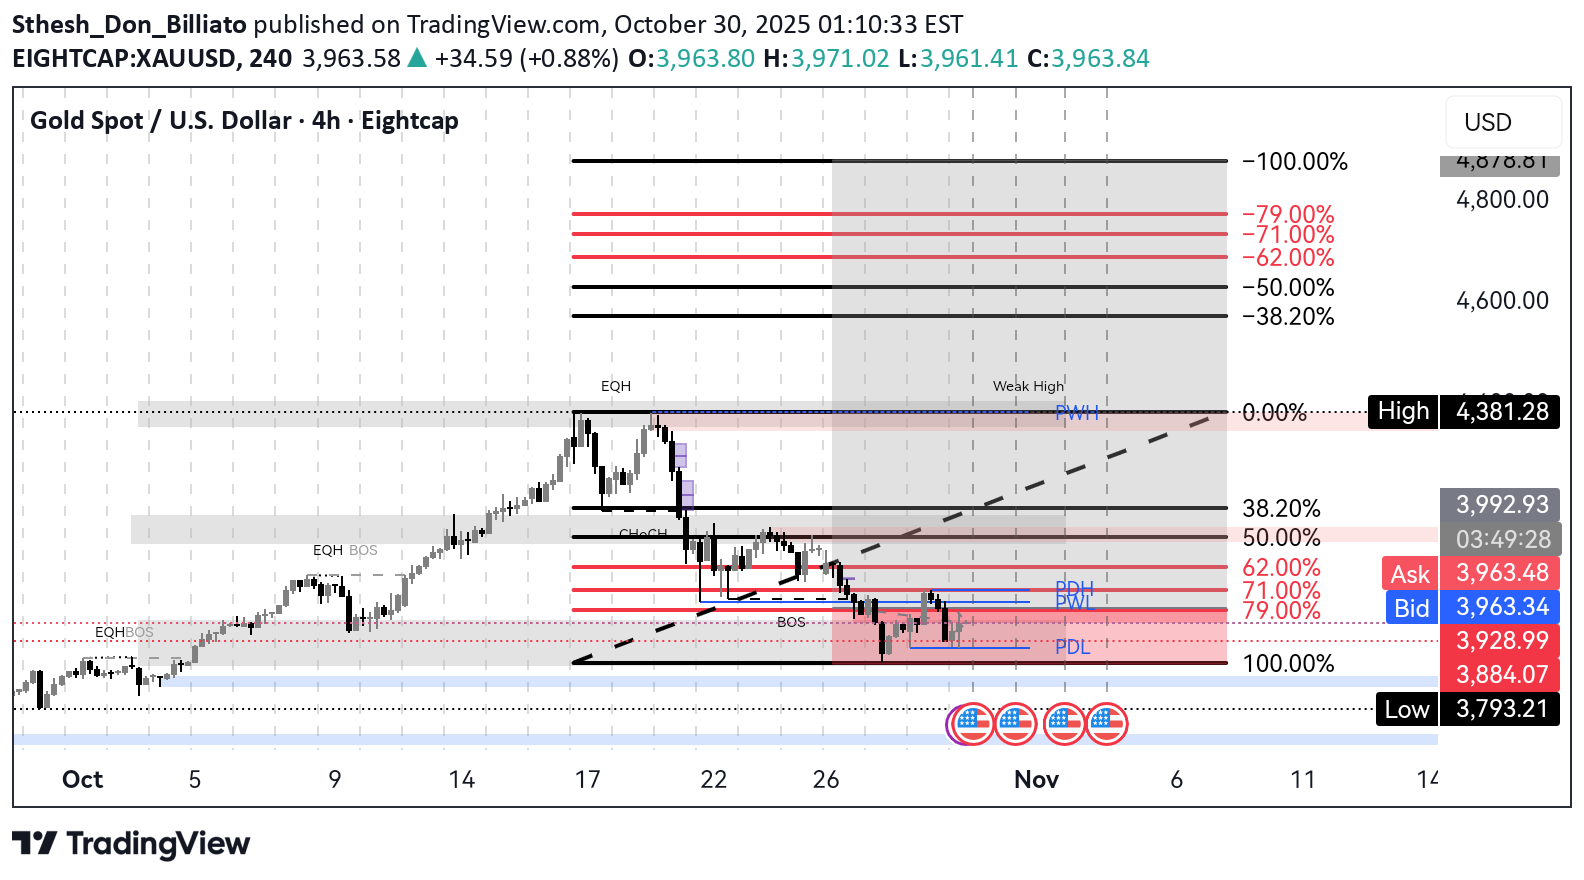
Xau Sells

Short term Gold / Xau Sell * A bearish wedge/pennant pattern. * BOS (Break of Structure) noted. * Price approaching a strong resistance zone (\~\$3,438). * Two key take-profit zones marked: * TP1: \~\$3,167 * TP2: \~\$2,839 The blue projection suggests a short (sell) bias from the resistance zone Direction: SELL Yes, based on the wedge, Fibonacci zones, and price action, the bias is bearish. Price is tapping into a strong supply/resistance area, so a sell setup makes sense, especially after the BOS and premium price. Entry Zone (Sell Area): * Sell Entry Range: \$3,370 - \$3,438 * Around the 0.71 - 0.79 Fibonacci retracement and under the supply zone. * Ideal area is between \$3,372 to \$3,438 (your marked red zone). Stop Loss (SL): * SL above supply zone high: \$3,510 - \$3,520 * Above strong high; gives room in case of liquidity sweep. Re-entries: * If price pulls back after TP1: * Re-entry zone**: **\$3,250 - \$3,280 * Around 0.382 Fib level + structure retest. Take Profit (TP) Zones: * TP1: \$3,167 - \$3,120 * Strong support, aligns with your "Weak Low" + confluence with structure. Risk\:Reward \~1:3 TP2: \$2,839 - \$2,835 * Deep support + Fibonacci extension zone (1:8 RR). * High reward but only if bearish momentum continues strongly. Final Notes & Corrections: * Your TP zones are logically placed. * Entry zone is strong and aligns with resistance + Fib. * Consider watching for: * Bearish engulfing or reversal candlestick patterns in entry zone. * Confirmation with momentum indicators (e.g., RSI divergence).
Sthesh_Don_Billiato
BTC to the moon

Is Bitcoin Just Getting Started? This Fib Zone Could Be the Ultimate Buy Signal! Bitcoin is pulling back… but smart money is watching this golden zone. After a strong rally, BTC is now retesting the 61.8%–78.6% Fib retracement zone—historically one of the highest-probability reversal areas in crypto. We’re not just guessing here… the chart is showing structure, confluence, and opportunity. My Trade Plan (Weekly Chart) - Entry Zone: 83K – $85K - Re-entry/DCA: $79K – $81K - Stop Loss: $74K - Take Profits: - TP1: $95K - TP2: $109K (previous high) - TP3: $130K–$144K (extension zone) Bullish bias unless we close below $78K on the weekly. A clean breakout above 89K could send BTC into price discovery mode again. Could this be the last big dip before a parabolic move? Time will tell, but this setup has everything we look for. Agree? Disagree? Drop your thoughts below. Follow for more swing setups & macro plays. #BTC #Bitcoin #CryptoTrading #Fibonacci #PriceAction #SwingTrade #Bullish #CryptoAnalysis #BTCUSD #BitcoinHalving #BuyTheDip #AltseasonComing #TradingView
Sthesh_Don_Billiato
GOLD BUYS!!!

Trade Description for Gold (XAU/USD) Trade Setup Summary - Instrument: Gold (XAU/USD) - Timeframe: 4-Hour Chart - Trade Direction: Bullish (Buy) Key Levels: 1. **Entry Zone**: - Planned within the **Golden Zone**, between **61.8%** ($2,946) and **78.6%** ($2,910) Fibonacci retracement levels. - This zone is identified as a high-probability area for a reversal based on Fibonacci principles. 2. **Stop Loss (SL)**: - Positioned just below the **78.6% Fibonacci level** at approximately **$2,910** to minimize risk if the price invalidates the setup. 3. **Take Profit (TP)**: - **TP1**: At the **0% Fibonacci retracement level** (~$3,043), corresponding to the nearest resistance level or the top of the previous range. - **TP2** (if applicable): Extended profit level, potentially aligned with Fibonacci extensions (e.g., -27.2% or -61.8% for continuation). Trade Logic: 1. **Fibonacci Confluence**: - The price has retraced into the golden zone, an area with strong historical significance for reversals. 2. **Trend Bias**: - The current market structure suggests a potential uptrend resumption after the pullback. 3. **Risk-to-Reward Ratio (R:R)**: - This setup offers a favorable R:R, targeting a large profit potential relative to the risk defined by the SL. 4. **Moving Averages**: - The 50 EMA (blue) and 200 EMA (orange) act as dynamic support/resistance. A price above 50 EMA could add confirmation. Market Considerations: - **Price Reaction**: Monitor price action closely within the golden zone. A bullish engulfing candle or breakout would provide further entry confirmation. - **Volume Analysis**: Increased volume on bullish candles will validate momentum strength. - **News & Fundamentals**: Watch for U.S. Dollar (USD) strength/weakness, Federal Reserve policy updates, or geopolitical risks, as these heavily influence gold prices.
Sthesh_Don_Billiato
Gold Buys!!!

### **Analysis:** - The chart shows a bullish scenario where the price has broken out above a descending trendline, indicating a potential reversal to the upside. - The price has retraced to the 0.618 Fibonacci level around 2,440, a strong area of support that aligns with the 200 EMA (black line). - The 50 EMA (red line) is turning upwards, suggesting bullish momentum is building. - There is a clear bullish flag or pennant pattern forming, which typically precedes a continuation of the uptrend. ### **Trade Idea:** **Direction:** Buy (Long) #### **Entry:** - **Buy Entry:** Consider entering a long position around the current price level of 2,440, as it is bouncing off the 0.618 Fibonacci level, which is a strong support zone. #### **Stop Loss:** - **Stop Loss:** Set the stop loss just below the 0.5 Fibonacci level and the recent swing low around 2,429.60. This area should provide enough room for the trade to develop while protecting against a potential reversal. - **Stop Loss Price:** 2,429.60 #### **Take Profit:** - **Primary Target (TP1):** The first take profit target can be set at the 0.786 Fibonacci level around 2,457.13. This aligns with the next resistance level. - **Secondary Target (TP2):** The ultimate target is set at the 1.618 Fibonacci extension around 2,537.83, which represents a significant bullish continuation. #### **Price Levels:** - **Entry:** 2,440.00 - **Stop Loss:** 2,429.60 - **Take Profit 1:** 2,457.13 - **Take Profit 2:** 2,537.83 ### **Conclusion:** - **Buy:** Enter long around 2,440 with targets at 2,457.13 and 2,537.83. - **Risk Management:** Ensure that your position size is appropriate for your risk tolerance, aiming for a favorable risk-reward ratio of at least 1:2. This setup is based on the technical indicators and patterns observed in the chart. It's essential to monitor the trade closely, especially around key support and resistance levels, and adjust your strategy as the market evolves.
Sthesh_Don_Billiato
Gold Buys!!!

### **Analysis:**- The chart shows a bullish scenario where the price has broken out above a descending trendline, indicating a potential reversal to the upside.- The price has retraced to the 0.618 Fibonacci level around 2,440, a strong area of support that aligns with the 200 EMA (black line).- The 50 EMA (red line) is turning upwards, suggesting bullish momentum is building.- There is a clear bullish flag or pennant pattern forming, which typically precedes a continuation of the uptrend.### **Trade Idea:****Direction:** Buy (Long)#### **Entry:**- **Buy Entry:** Consider entering a long position around the current price level of 2,440, as it is bouncing off the 0.618 Fibonacci level, which is a strong support zone.#### **Stop Loss:**- **Stop Loss:** Set the stop loss just below the 0.5 Fibonacci level and the recent swing low around 2,429.60. This area should provide enough room for the trade to develop while protecting against a potential reversal.- **Stop Loss Price:** 2,429.60#### **Take Profit:**- **Primary Target (TP1):** The first take profit target can be set at the 0.786 Fibonacci level around 2,457.13. This aligns with the next resistance level.- **Secondary Target (TP2):** The ultimate target is set at the 1.618 Fibonacci extension around 2,537.83, which represents a significant bullish continuation.#### **Price Levels:**- **Entry:** 2,440.00- **Stop Loss:** 2,429.60- **Take Profit 1:** 2,457.13- **Take Profit 2:** 2,537.83### **Conclusion:**- **Buy:** Enter long around 2,440 with targets at 2,457.13 and 2,537.83.- **Risk Management:** Ensure that your position size is appropriate for your risk tolerance, aiming for a favorable risk-reward ratio of at least 1:2.This setup is based on the technical indicators and patterns observed in the chart. It's essential to monitor the trade closely, especially around key support and resistance levels, and adjust your strategy as the market evolves.
Sthesh_Don_Billiato
BTC long

**BTC/USD Swing Analysis Confirmation:** **Time Frame:** Daily (1D) **Previous Analysis Summary:** Last week's analysis indicated a potential swing setup for BTC/USD. Key Fibonacci retracement levels were identified, along with significant support and resistance zones. **Key Observations:** 1. **Fibonacci Levels:** The Fibonacci retracement levels are drawn from the recent high to the recent low: - 0.382 (38.2%) at approximately $60,557.02 - 0.5 (50%) at approximately $62,736.97 - 0.618 (61.8%) at approximately $64,116.92 - 0.786 (78.6%) at approximately $68,020.57 2. **Current Price Action:** - **Bid Price:** $60,031.92 - **Ask Price:** $60,031.93 - BTC is currently trading near the 0.382 Fibonacci level, which suggests potential resistance. 3. **Support and Resistance:** - **Support Zone:** Around $53,500, where the previous low is marked. - **Resistance Zone:** Around $62,737 (50% Fibonacci retracement). 4. **Trendlines:** - A descending trendline is evident, suggesting a bearish trend in the recent past. - A breakout above this trendline could indicate a potential reversal. **Trade Confirmation:** - BTC has shown some bullish momentum, attempting to break above the 0.382 Fibonacci level. - The price is currently consolidating near this level, suggesting indecision in the market. **Action Plan:** - **Bullish Scenario:** If BTC breaks and closes above the 0.382 Fibonacci level ($60,557.02) and the descending trendline, it could signal a potential move towards the 0.5 Fibonacci level ($62,736.97) and possibly higher towards the 0.618 level ($64,116.92). - **Bearish Scenario:** If BTC fails to hold above the 0.382 Fibonacci level and the descending trendline, it could retest the support zone around $53,500. **Conclusion:** - The current price action aligns with the previous week's swing analysis, confirming the importance of the identified Fibonacci levels and trendlines. - Traders should watch for a confirmed breakout above the 0.382 level and the descending trendline for bullish confirmation or a rejection at this level for potential bearish moves. ---
Disclaimer
Any content and materials included in Sahmeto's website and official communication channels are a compilation of personal opinions and analyses and are not binding. They do not constitute any recommendation for buying, selling, entering or exiting the stock market and cryptocurrency market. Also, all news and analyses included in the website and channels are merely republished information from official and unofficial domestic and foreign sources, and it is obvious that users of the said content are responsible for following up and ensuring the authenticity and accuracy of the materials. Therefore, while disclaiming responsibility, it is declared that the responsibility for any decision-making, action, and potential profit and loss in the capital market and cryptocurrency market lies with the trader.