
Smarter_Trades
@t_Smarter_Trades

What symbols does the trader recommend buying?
Purchase History
پیام های تریدر
Filter
Bitcoin Long Trade Idea 10/19/25
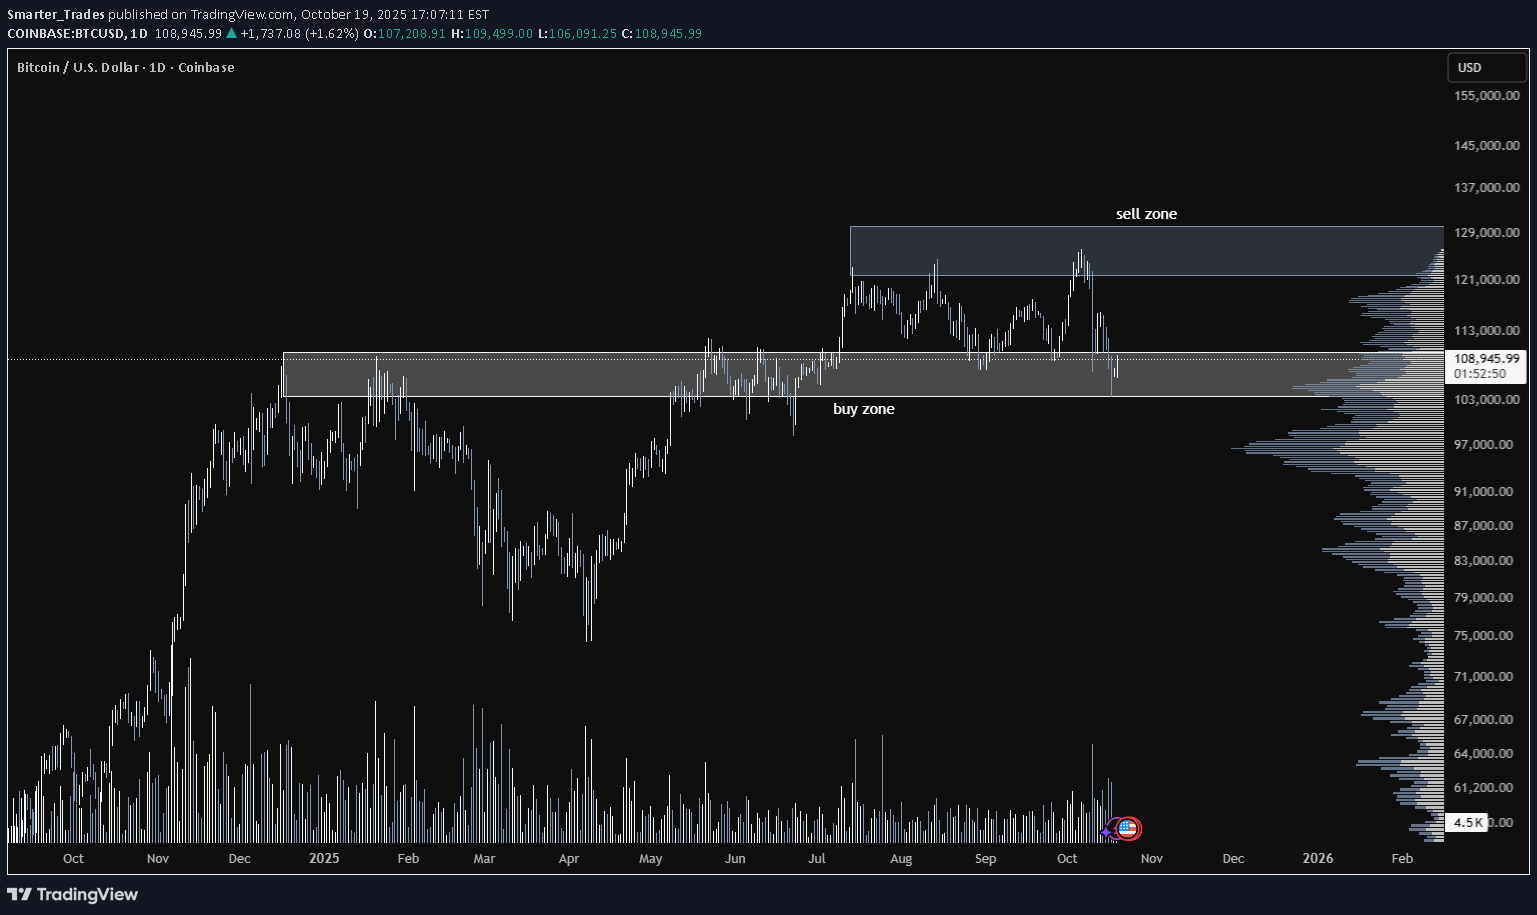
I believe that we will hit +$120k instead of under $100k. What do you think? $120k or $100k first?Nice play. Currently looking for upside to $118k - $120.5k
Crazy or Optimistic?
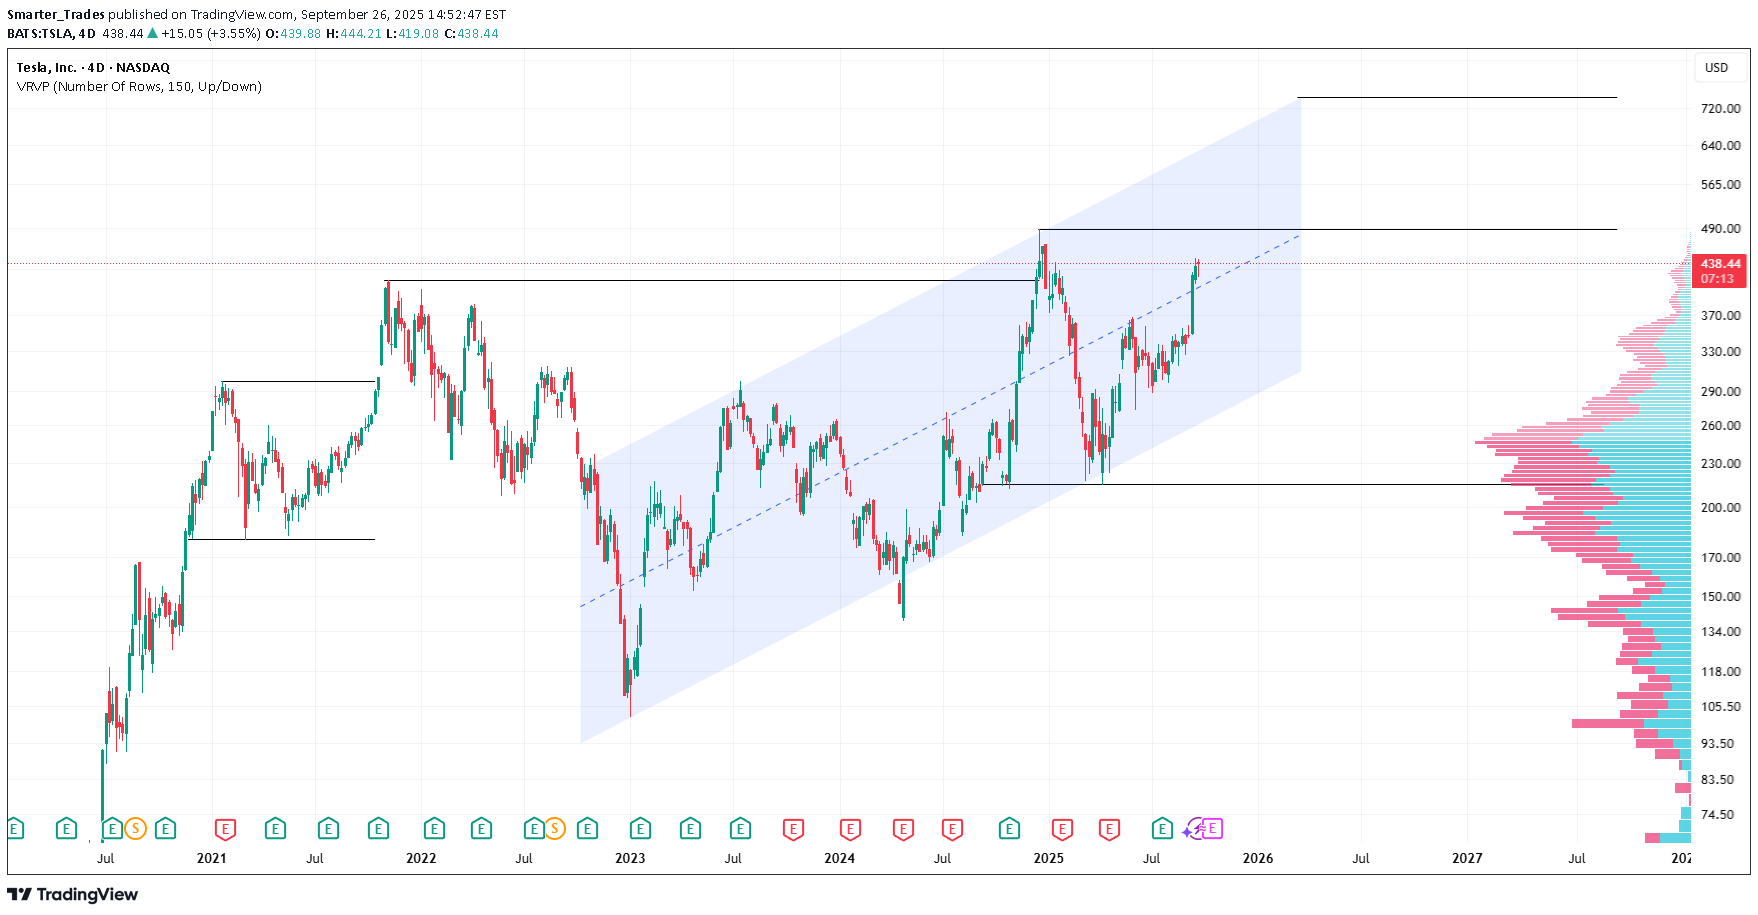
We've followed an upward channel since 2022. Since then, we have created HLs & HHs. I see a price prediction of $550 to $600 by the end of the year, and +$700 by July 2026. Let me know your thoughts.$490-$500 is the critical area to break.
BITCOIN OVEREXTENDED PULLING BACK
1. Volume Footprint AnalysisExhaustion at highs: The recent bars near $106K show declining buy volume at the top (e.g., last few green blocks have lower delta values and volume numbers).Delta divergence: Even though the candles are green, some negative deltas appear within the bars (aggressive selling pressure intrabar), indicating weak buyers or passive sellers absorbing the moves.Wick behavior: Longer top wicks on recent bars suggest buying was rejected at the highs, often a sign of seller absorption or trap. 2. Technical StructureLower high potential: Price has not yet exceeded the March 2024 high around $107,000–$108,000, creating a potential lower high in a broader time structure.Bearish RSI divergence (not shown but likely): Given the recent vertical rise, momentum indicators like RSI often diverge near exhaustion zones.Rally appears parabolic: Price has sharply rallied from $72K to $106K with little retracement. This could invite a correction due to unsustainable momentum.3. Market Profile ConfluenceLow volume nodes (LVNs) below current price: Price moved too quickly between $94K and $102K, leaving inefficient areas that price often revisits.Value area shift lag: There's no visible new value area forming above current price, suggesting acceptance hasn’t yet occurred at this level.4. Psychological + Macro ConfluencesPsychological level rejection: $110,000 is a major psychological resistance, and rejection just below that (at ~$107K) signals possible bull exhaustion.Macro uncertainty: With broader financial conditions tightening or macro risk events (e.g., rate hike discussions, geopolitical risks), BTC may become risk-off.For more trade ideas, join my Discord. patreon.com/SmarterTraders
ETHEREUM SHORT TERM PULLBACK!
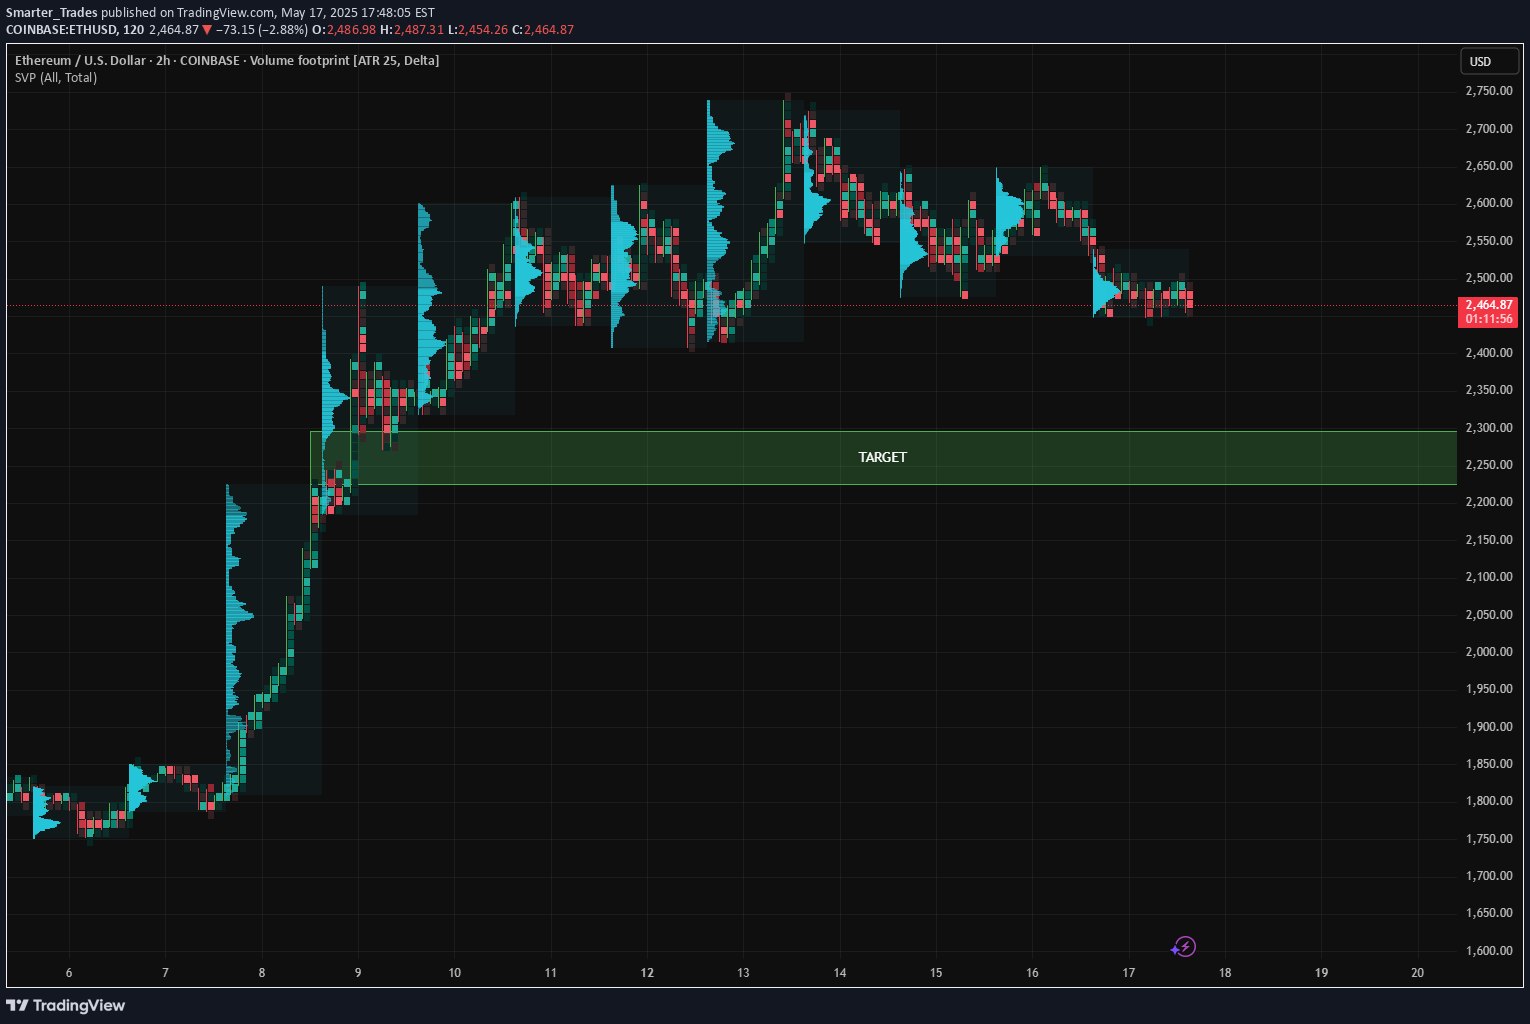
1. Lower Highs & Downtrend StructurePrice has shifted from a clear uptrend to forming lower highs and lower lows, signaling a trend reversal or ongoing correction.The most recent price action is sideways-to-down, showing weak bullish follow-through. 2. Volume Profile Clues (SVP / Volume Footprint)Volume nodes (the blue histogram bars) show previous high activity near $2,500–$2,650, but that area is now acting as resistance.There is a low-volume node just above the current price, suggesting a lack of support until the next high-volume area — which aligns with the target zone.3. Failed Attempt to Reclaim HighsAfter peaking near $2,750, ETH attempted rebounds but failed to reclaim previous highs, showing bull exhaustion.This type of behavior often leads to a liquidity sweep toward a prior demand zone, which is exactly what the green “TARGET” box represents. 4. Range Breakdown SetupETH is currently consolidating just above $2,450. If it breaks below this local range, there’s little structural support until the target zone.A breakdown would confirm distribution at the top, especially if accompanied by rising bearish delta on footprint data (not visible here, but worth monitoring live).5. ATR-Based Footprint and Weak ImbalancesThe footprint clusters don’t show strong bullish imbalances at recent lows, which means buyers aren’t aggressively stepping in — a red flag for bulls.Targeting the $2,250–$2,200 demand area.Bias remains bearish unless ETH reclaims and holds above $2,550–$2,600 with volume confirmation.SL: >$2600Join my Free & VIP Discord Here! patreon.com/SmarterTraders
MSTR: "Digital Gold" My A** – It's Just Bitcoin with Management
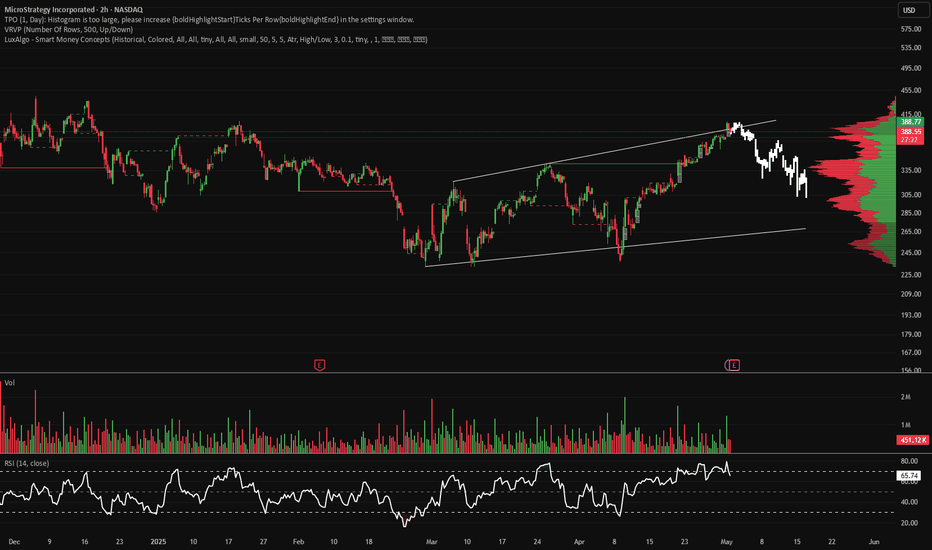
Let's call it what it is: a glorified Bitcoin ETF with Michael Saylor as the mascot. And right now? It's the Titanic with laser eyes. 🚨 Price action looks like a failed breakout. RSI is rolling over. Volume on the last bounce? Weak. And guess what: BTC can go sideways for 2 months and MSTR will still bleed. Why? Because the leverage cuts both ways. Oh, and that "institutional demand" narrative? Yeah… check the chart. Institutions take profit — they don’t diamond hand your hopium.
MicroStrategy on the Brink? $5.9 Billion Bitcoin Losses and Mass
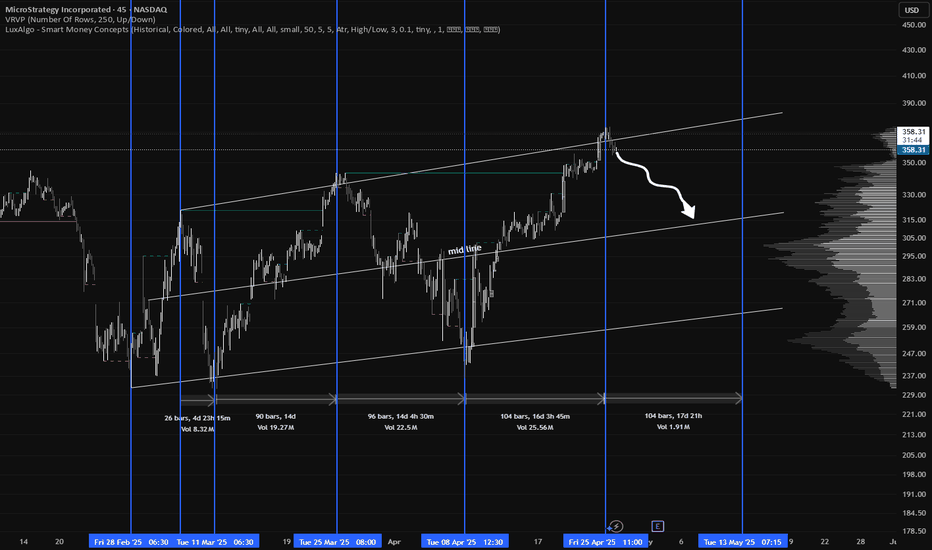
In Q1 2025, Strategy reported a staggering $5.91 billion unrealized loss on its Bitcoin holdings, primarily due to a significant drop in Bitcoin's price. Consequently, the company's stock plummeted by 6.3% following the announcement and has declined 41.9% since November 2024, underperforming both Bitcoin and the S&P 500 . The Financial Accounting Standards Board's (FASB) new guidelines now allow companies to reflect the real-time market value of their digital assets. While this benefited companies like Tesla, it poses a significant risk for Strategy. With billions in unrealized Bitcoin gains, the company could face a substantial tax bill under the Corporate Alternative Minimum Tax introduced by the Inflation Reduction Act. This tax, set at 15%, could result in billions in liabilities starting in 2026, potentially forcing Strategy to liquidate some of its Bitcoin holdings to meet tax obligations . Despite its significant Bitcoin holdings, Strategy's market capitalization stands at about $95 billion, double the value of its Bitcoin assets (currently around $50 billion in BTC). This discrepancy suggests that investors are paying a hefty premium for exposure to Bitcoin through Strategy, rather than purchasing the cryptocurrency directly or through other financial instruments. Analysts warn that this overvaluation could be unsustainable, especially if Bitcoin's price experiences further volatility . Strategy's approach of continuously issuing debt and equity to fund Bitcoin purchases has been likened to a high-risk financial flywheel. Critics argue that this strategy is unsustainable and could collapse if Bitcoin's price declines or if the company faces regulatory scrutiny. Furthermore, co-founder Michael Saylor's past controversies, including a $40 million tax fraud settlement, add to the ethical concerns surrounding the company's leadership .Didn't expect this to get so much traction. Looks like this stock has a lot of die hard fans! Wish you all the best of luck!Check out my new thesis here!
GOLD Getting Ready for Another Run!

Gold is looking strong heading into the next few weeks. Real-world catalysts are stacking up: Central banks are still aggressively buying gold (China and other BRICS nations are steadily increasing reserves). Geopolitical tensions (Middle East, Russia/Ukraine) are keeping safe-haven demand alive. U.S. economic data is showing signs of a slowdown — with weaker job reports and cooling inflation, expectations for rate cuts later this year are rising. The dollar has softened a bit recently, giving gold room to breathe. Technically, gold is holding key support levels and building momentum for a potential breakout. If economic data continues to weaken or geopolitical risks stay elevated, gold could quickly retest recent highs.Looking good so far.TP #2 was also hit.
$TSLA Pullback Soon?
Tesla's recent announcement of its upcoming robotaxi service and the unveiling of the Cybercab have generated significant investor enthusiasm, contributing to a notable surge in TSLA's stock price. However, while these developments are promising for Tesla's long-term vision, they may not provide sufficient support for the current elevated stock levels in the short term. Competitors like Waymo and Zoox have already established operational autonomous ride-hailing services in select markets, potentially challenging Tesla's market entry and adoption rates. Despite recent relaxations in federal self-driving regulations, Tesla's autonomous services must still navigate a complex landscape of state and local laws, which could impact the pace of deployment and revenue realization.Broke under 284, Looking to retest 280s.Looking to retest 270s.Broke Previous Lows. Looking good for puts
$AAPL TIME TO LOAD UP?
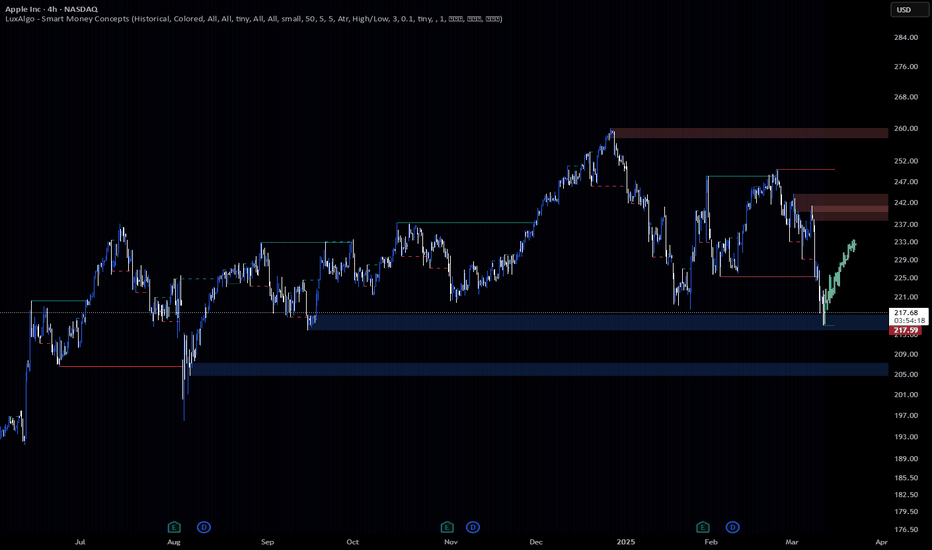
As of March 12, 2025, Apple Inc. (AAPL) is trading at $217.21, reflecting a slight decrease of 1.64% from the previous close. Apple continues to demonstrate strong financial health, maintaining robust cash flows and a solid balance sheet. This financial stability enables ongoing investments in research, development, and strategic acquisitions, positioning the company for sustained growth. While Apple has traditionally taken a measured approach to artificial intelligence, this strategy has proven advantageous. The company's cautious AI investments have allowed it to avoid the pitfalls faced by competitors with higher AI expenditures. This prudent approach has contributed to stock stability, even as the broader tech market experiences volatility. Apple's integrated ecosystem—including devices like the iPhone, iPad, Mac, and services such as the App Store and Apple Music—fosters strong customer loyalty. This ecosystem not only encourages repeat purchases but also attracts new customers, providing a steady revenue stream and opportunities for cross-selling. Apple's position as a leader in the technology sector, coupled with its strong brand recognition, offers a competitive advantage. The company's ability to set industry trends and command premium pricing supports robust profit margins and market share. Despite recent stock fluctuations and external challenges, Apple's solid financial foundation, strategic investments, cohesive product ecosystem, and strong brand equity contribute to a positive long-term outlook for AAPL stock.
NVDA +$130 BY END OF MARCH!

NVIDIA (NVDA) is currently trading at $112.69, and several recent developments suggest a potential surge beyond $130 by the end of March 2025. NVIDIA's Blackwell architecture, introduced in March 2024, has seen unprecedented demand. Reports indicate that the entire 2025 production of Blackwell silicon is already sold out, underscoring NVIDIA's leadership in AI technology and positioning the company for substantial revenue growth. NVIDIA's stock has experienced a significant selloff, dropping 8.7% recently and 15% since the beginning of the year, making it an appealing investment opportunity. The stock's valuation has decreased to a slight premium over the S&P 500 and is at its lowest premium since 2016. NVIDIA's stock is trading below parity versus the PHLX Semiconductor Index, a rare occurrence in the past decade, and 25 times forward earnings, a near decade low. Historically, investors have benefited from buying the stock at this multiple. Considering these factors, NVIDIA's stock appears well-positioned to exceed $130 by the end of March 2025, offering investors a promising opportunity to capitalize on the company's innovative advancements and strategic market positioning.Nice bounce off $105Looking good
Disclaimer
Any content and materials included in Sahmeto's website and official communication channels are a compilation of personal opinions and analyses and are not binding. They do not constitute any recommendation for buying, selling, entering or exiting the stock market and cryptocurrency market. Also, all news and analyses included in the website and channels are merely republished information from official and unofficial domestic and foreign sources, and it is obvious that users of the said content are responsible for following up and ensuring the authenticity and accuracy of the materials. Therefore, while disclaiming responsibility, it is declared that the responsibility for any decision-making, action, and potential profit and loss in the capital market and cryptocurrency market lies with the trader.