Technical analysis by Smarter_Trades about Symbol ETH: Sell recommendation (5/17/2025)

ETHEREUM SHORT TERM PULLBACK!
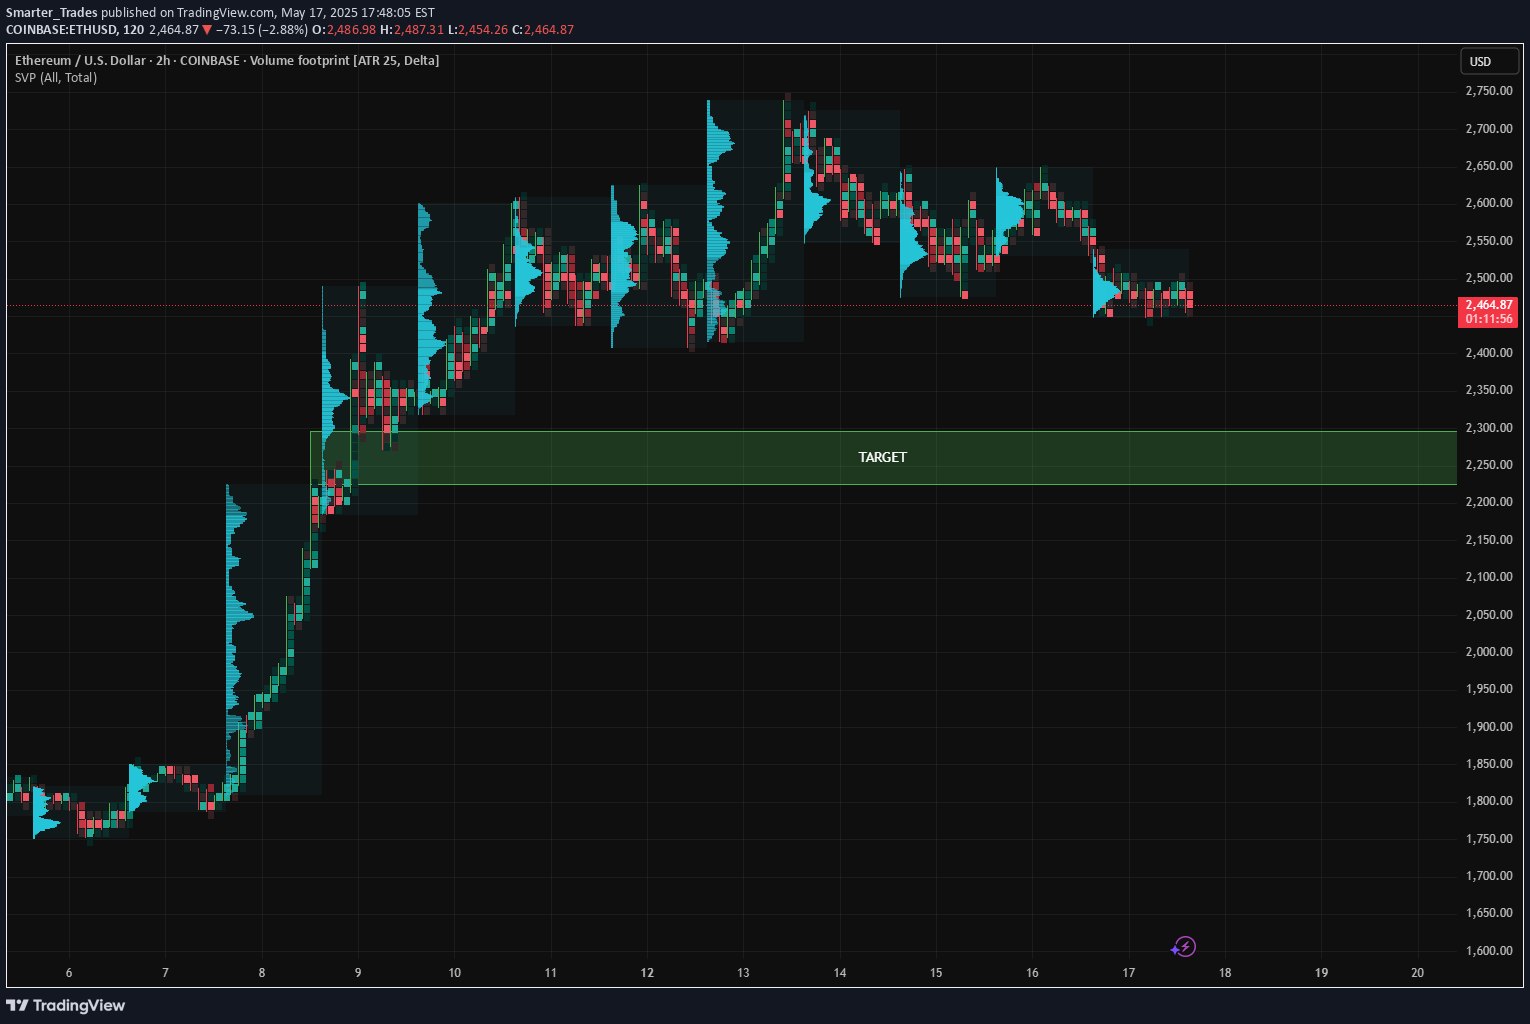
1. Lower Highs & Downtrend StructurePrice has shifted from a clear uptrend to forming lower highs and lower lows, signaling a trend reversal or ongoing correction.The most recent price action is sideways-to-down, showing weak bullish follow-through. 2. Volume Profile Clues (SVP / Volume Footprint)Volume nodes (the blue histogram bars) show previous high activity near $2,500–$2,650, but that area is now acting as resistance.There is a low-volume node just above the current price, suggesting a lack of support until the next high-volume area — which aligns with the target zone.3. Failed Attempt to Reclaim HighsAfter peaking near $2,750, ETH attempted rebounds but failed to reclaim previous highs, showing bull exhaustion.This type of behavior often leads to a liquidity sweep toward a prior demand zone, which is exactly what the green “TARGET” box represents. 4. Range Breakdown SetupETH is currently consolidating just above $2,450. If it breaks below this local range, there’s little structural support until the target zone.A breakdown would confirm distribution at the top, especially if accompanied by rising bearish delta on footprint data (not visible here, but worth monitoring live).5. ATR-Based Footprint and Weak ImbalancesThe footprint clusters don’t show strong bullish imbalances at recent lows, which means buyers aren’t aggressively stepping in — a red flag for bulls.Targeting the $2,250–$2,200 demand area.Bias remains bearish unless ETH reclaims and holds above $2,550–$2,600 with volume confirmation.SL: >$2600Join my Free & VIP Discord Here! patreon.com/SmarterTraders