Technical analysis by Smarter_Trades about Symbol BTC: Sell recommendation (5/19/2025)

BITCOIN OVEREXTENDED PULLING BACK
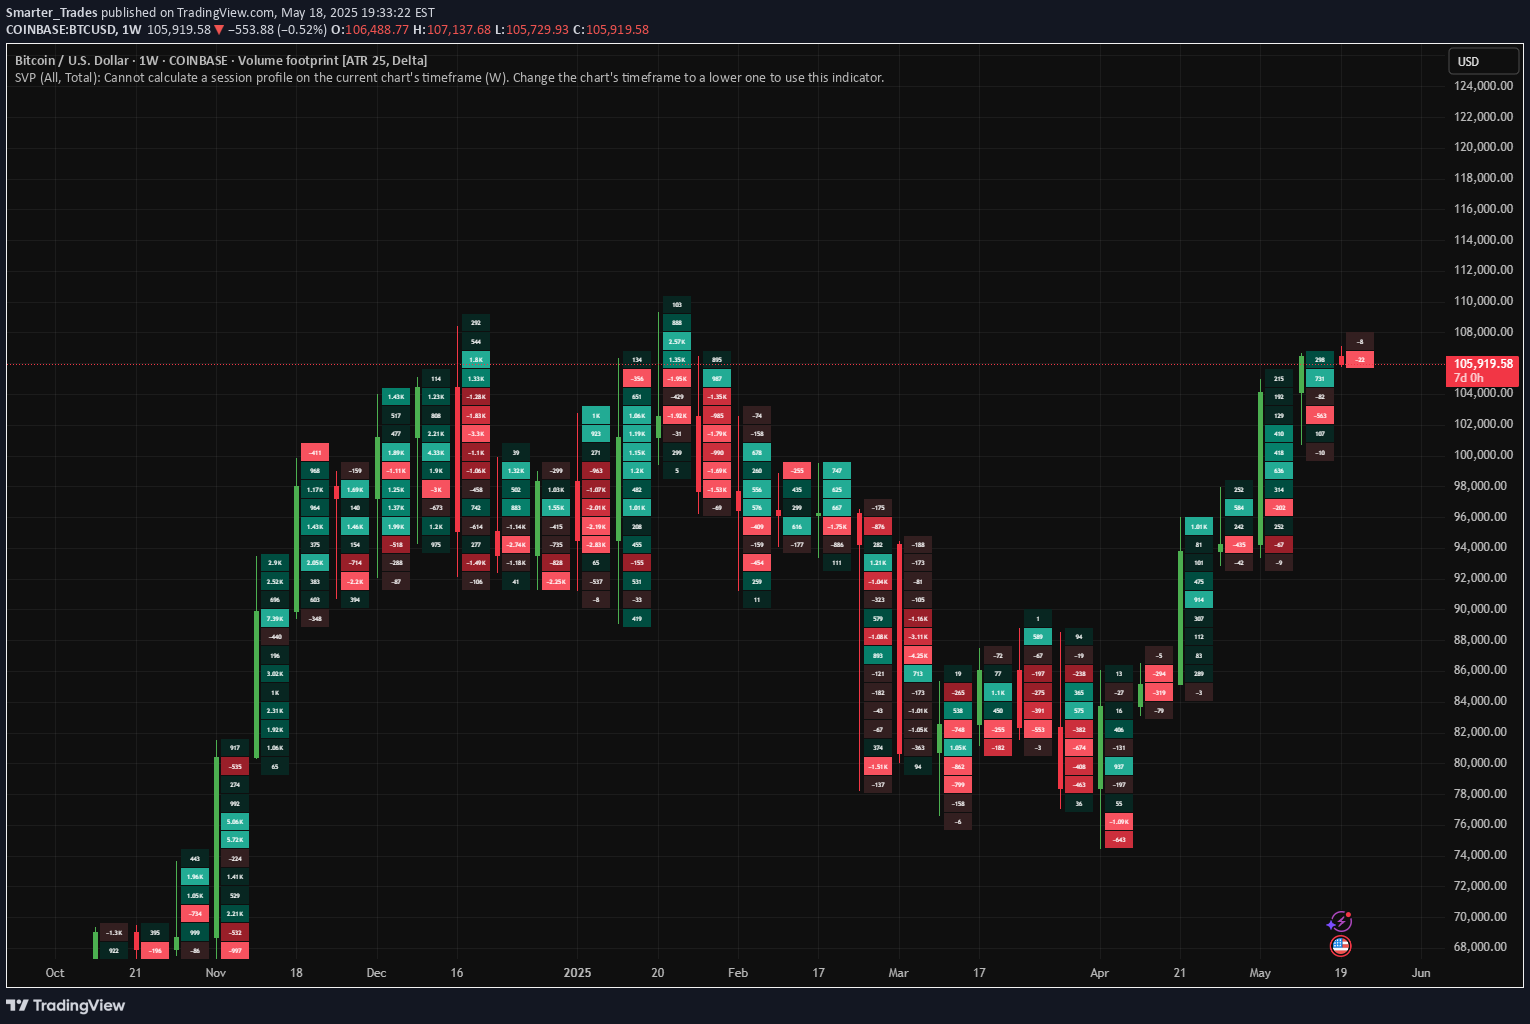
1. Volume Footprint AnalysisExhaustion at highs: The recent bars near $106K show declining buy volume at the top (e.g., last few green blocks have lower delta values and volume numbers).Delta divergence: Even though the candles are green, some negative deltas appear within the bars (aggressive selling pressure intrabar), indicating weak buyers or passive sellers absorbing the moves.Wick behavior: Longer top wicks on recent bars suggest buying was rejected at the highs, often a sign of seller absorption or trap. 2. Technical StructureLower high potential: Price has not yet exceeded the March 2024 high around $107,000–$108,000, creating a potential lower high in a broader time structure.Bearish RSI divergence (not shown but likely): Given the recent vertical rise, momentum indicators like RSI often diverge near exhaustion zones.Rally appears parabolic: Price has sharply rallied from $72K to $106K with little retracement. This could invite a correction due to unsustainable momentum.3. Market Profile ConfluenceLow volume nodes (LVNs) below current price: Price moved too quickly between $94K and $102K, leaving inefficient areas that price often revisits.Value area shift lag: There's no visible new value area forming above current price, suggesting acceptance hasn’t yet occurred at this level.4. Psychological + Macro ConfluencesPsychological level rejection: $110,000 is a major psychological resistance, and rejection just below that (at ~$107K) signals possible bull exhaustion.Macro uncertainty: With broader financial conditions tightening or macro risk events (e.g., rate hike discussions, geopolitical risks), BTC may become risk-off.For more trade ideas, join my Discord. patreon.com/SmarterTraders