
Skinwah
@t_Skinwah

What symbols does the trader recommend buying?
Purchase History
پیام های تریدر
Filter
Skinwah
LINK Trading Journal EntryTrading Journal Entry
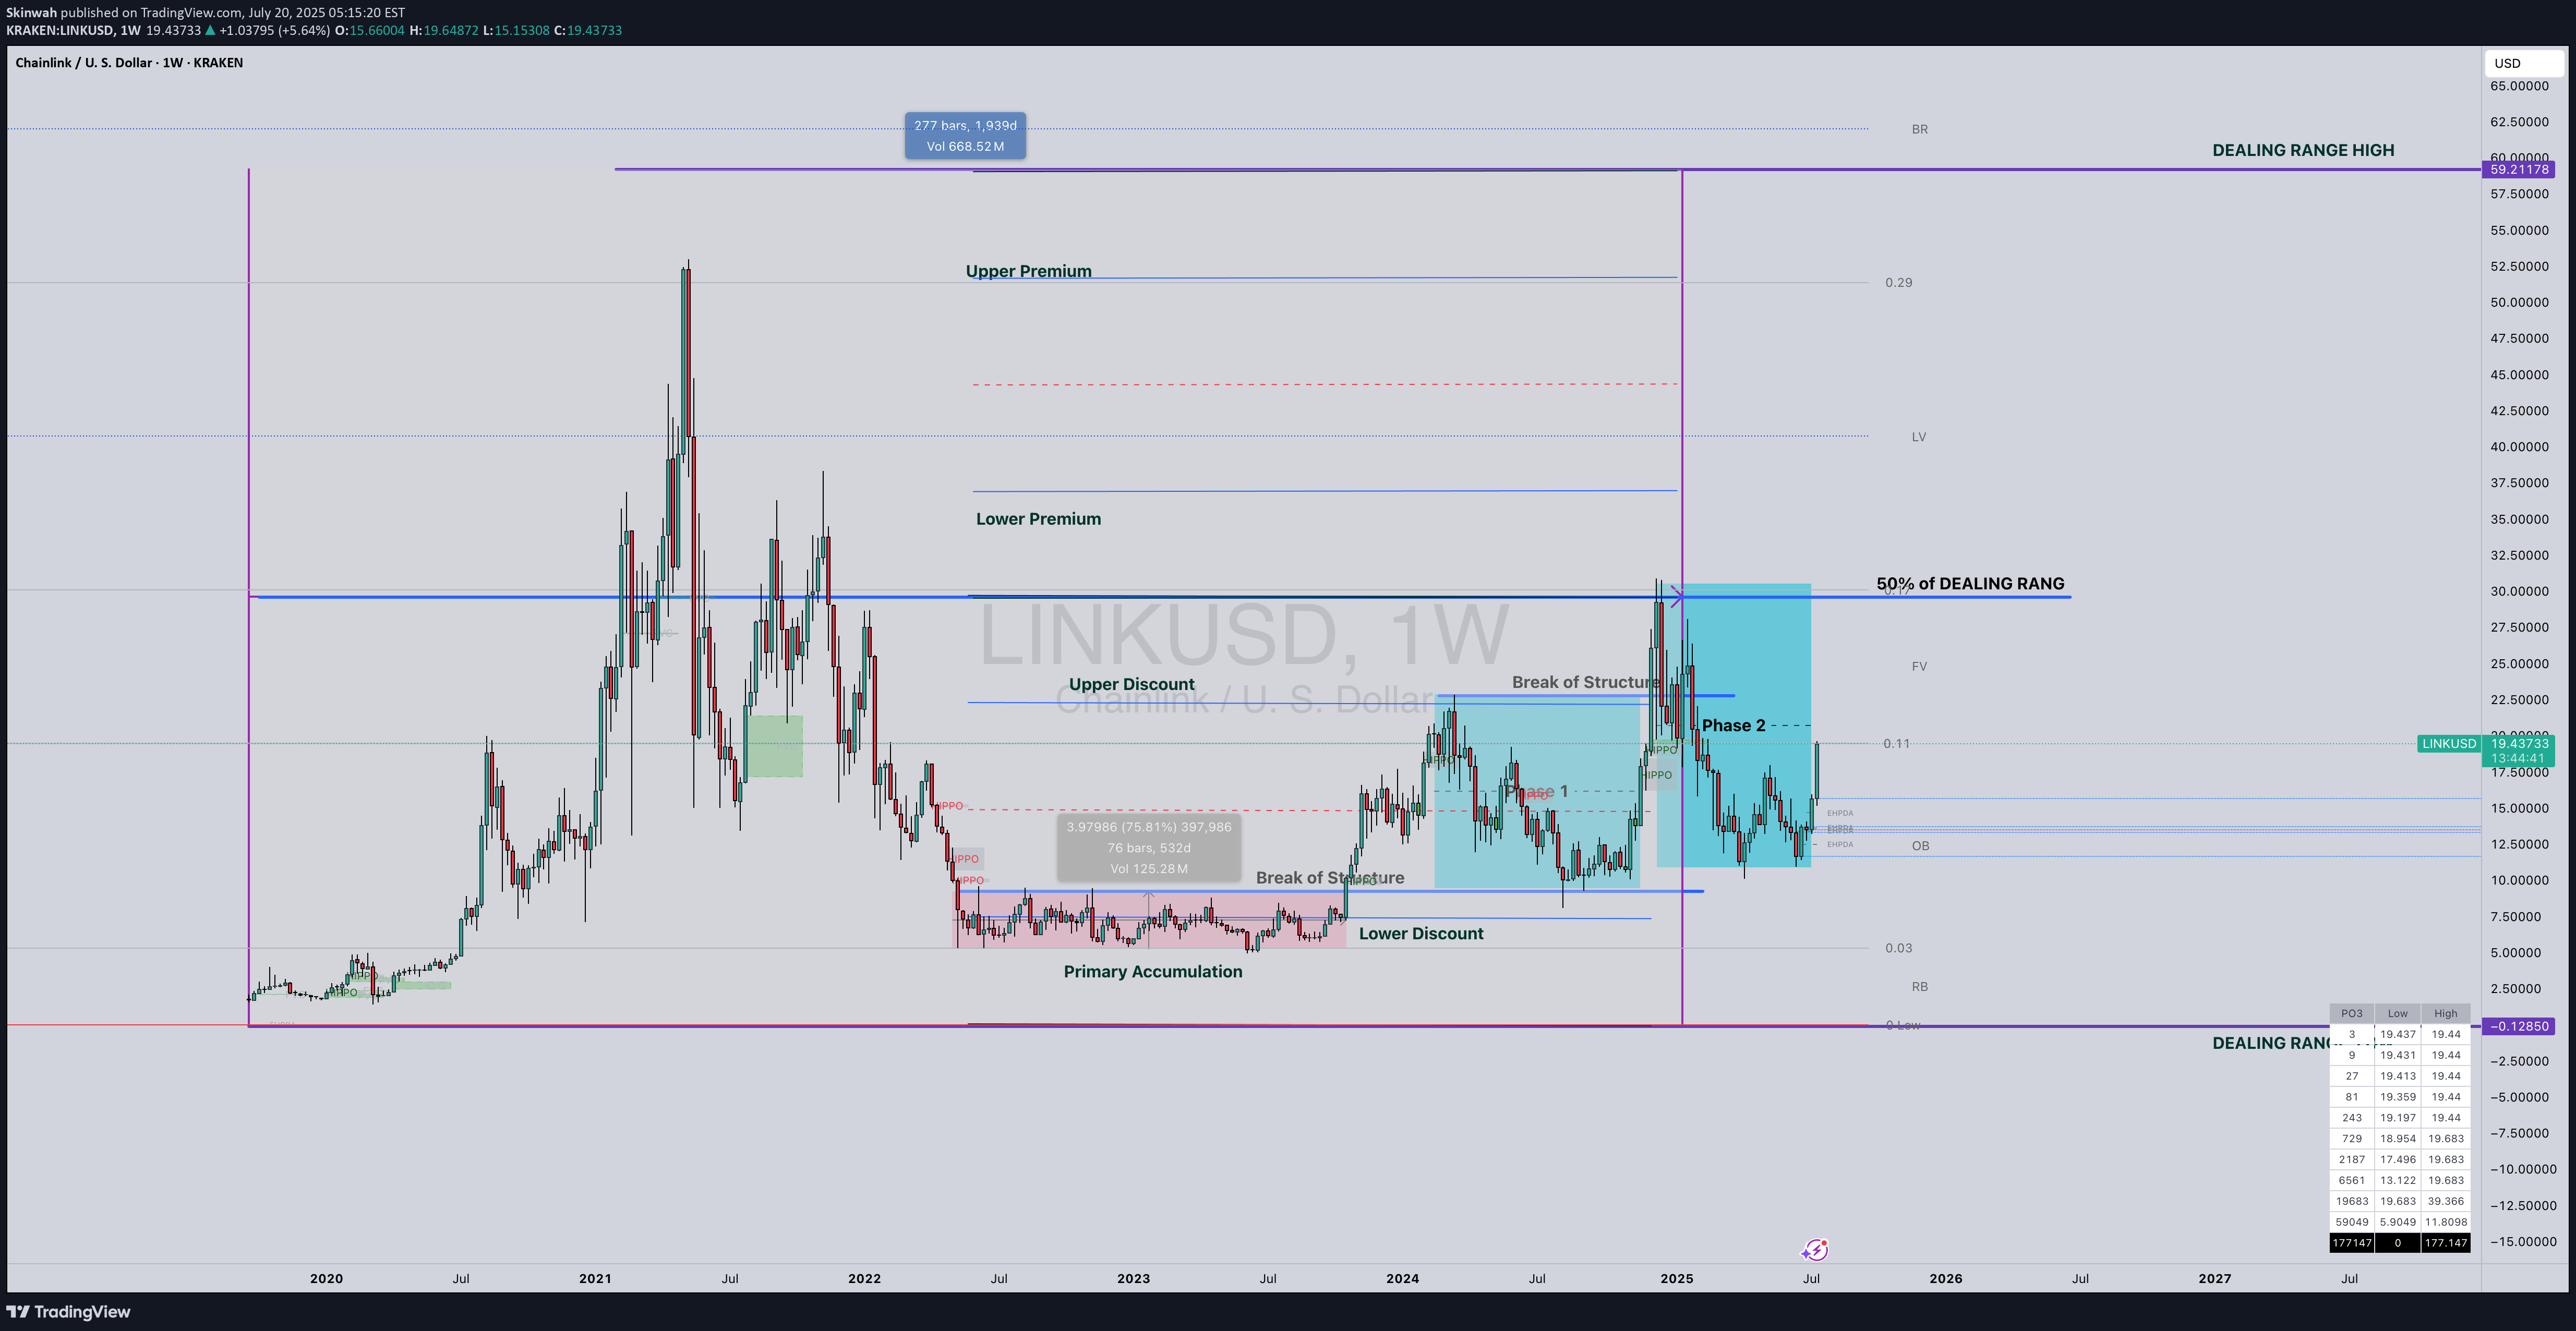
Asset: Chainlink (LINK/ USD) Timeframe: Weekly (1W) Date: 20th July 2025 Personal Market Reflection: LINK is currently playing out a clear Market Maker Buy Program. We are still operating well below the 50% level of the larger Goldbach Dealing Range, meaning price is in a discounted region. Although the ideal buy zone was below the 25% discount level, price has now broken out of that range — a sign of strength and possible continuation. This current structure aligns with smart money accumulation behavior. We’ve already witnessed Phase 1 and Phase 2 of accumulation, with a break of structure confirming bullish intent. I’ve positioned accordingly and will continue to monitor for continuation setups or retracements for potential scaling. Key Levels (Goldbach Dealing Range) Dealing Range High (Final Target): $59.21178 50% of Dealing Range: ~$29.67 Current Price (as of writing): ~$19.52 Upper Discount Zone: ~$15.00 - $30.00 (Still valid for continuation buys) Lower Discount Zone / Original Accumulation: ~$5.00 - $15.00 (Executed buys here) Dealing Range Low: $0.12850 (Major support floor) Position Notes: Bias: Bullish Structure: Accumulation complete + Break of Structure ✅ Accumulation Phase: Done (both Phase 1 & 2) Trade Objective: Ride the wave toward the Dealing Range High of $59.21 Risk Consideration: Weekly close back below $15 would be cause for reevaluation Market Context: Still discounted. Price below 50% = institutional buy logic still in play 📌 Final Thoughts: This is not financial advice. This journal entry is for my personal trading log only. Always do your own research (DYOR) and manage your own risk. I document these observations to sharpen my edge and stay accountable to my system. The market will do what it wants — but I will stay aligned with structure, range, and narrative. Lord MEDZ🙏 Thank You 🙏 Massive thanks to everyone who’s shown support—whether through likes, shares, sponsorships, or thoughtful comments. Your engagement keeps me motivated to stay consistent in this journey. I'm truly grateful for the community that's forming around these insights. Let’s continue learning, growing, and navigating these markets together. Much love and respect. 💙 — Lord MEDZ
Skinwah
Lord MEDZ ETH Trading Setup
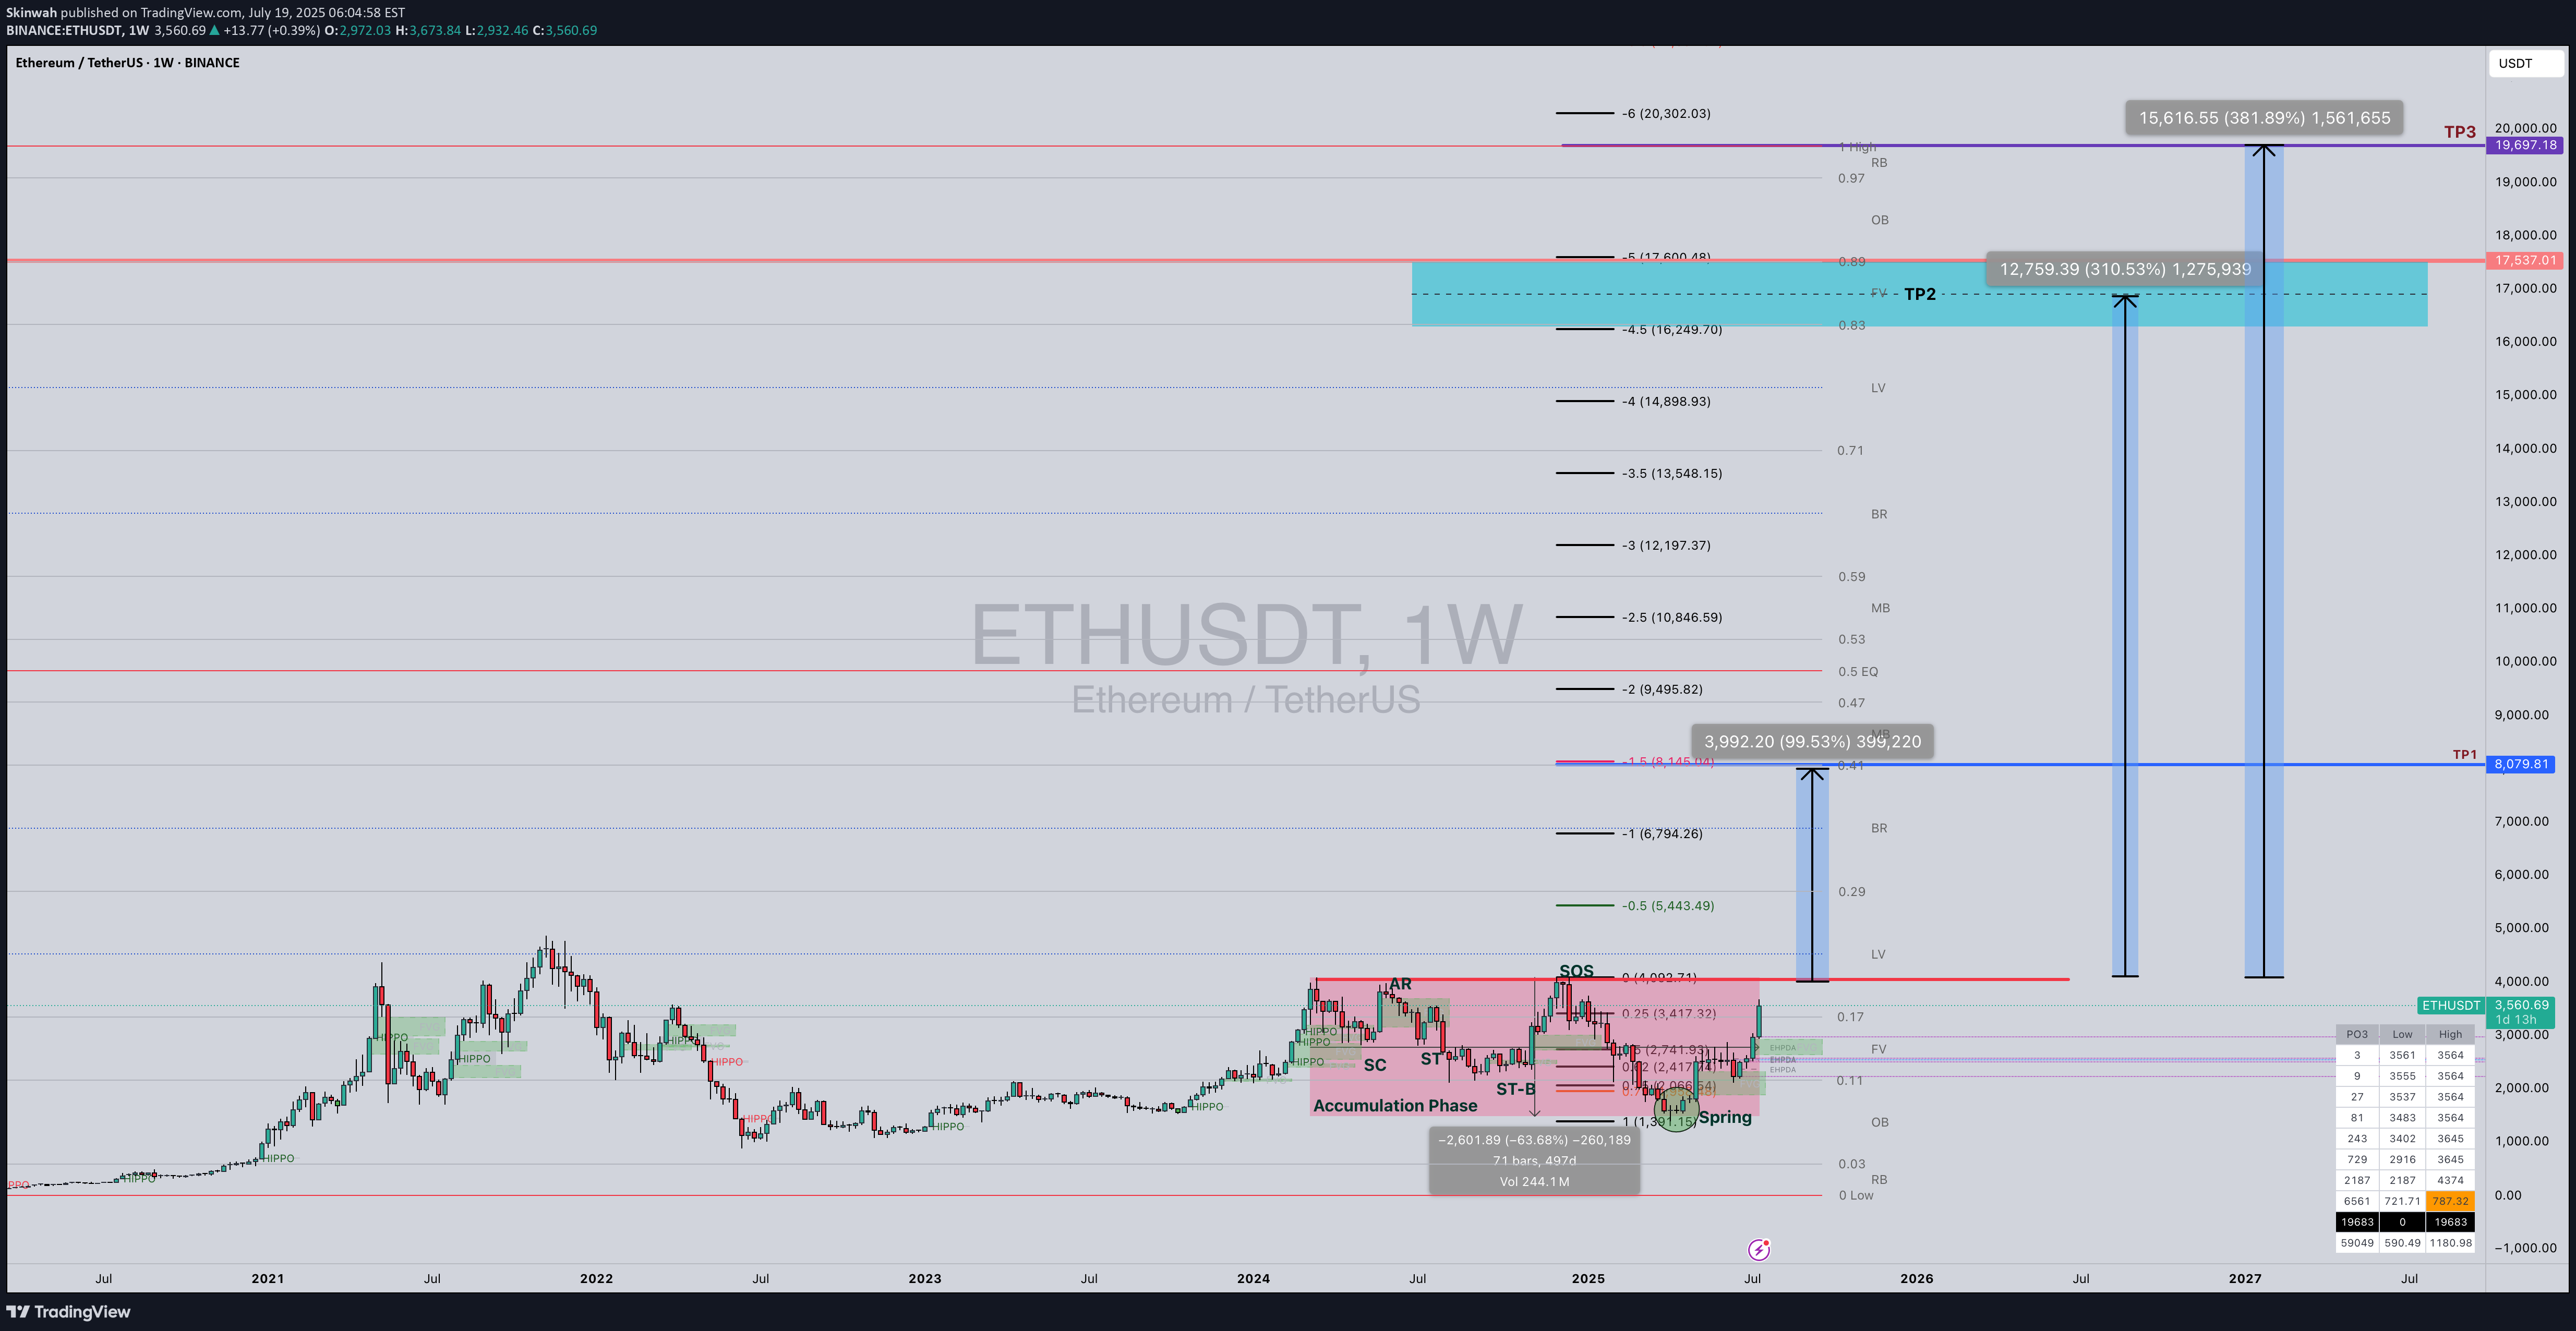
For Personal Journaling – Not Financial Advice Asset: Ethereum (ETH) Analysis Techniques Used: Wyckoff Accumulation Phase ICT Fibonacci Extension Goldbach Projection Model Thesis: Based on confluence from Wyckoff schematic interpretation, ICT fib extension zones, and mathematical projection via Goldbach logic, Ethereum (ETH) appears poised for a significant upward move. Accumulation signals suggest smart money positioning, with price respecting historical support levels and consolidating in a reaccumulation range. The Fibonacci extensions and Goldbach theory projection align on the following bullish targets: Projected Take Profit Zones (TPs): TP1: $8,000 – First extension target post-breakout. TP2: $17,000 – Macro-level expansion target in line with Wyckoff Phase E markup. TP3: $19,700 – Final speculative cycle top target (Goldbach-based projection). Narrative & Confluence: Wyckoff Accumulation: ETH has shown signs of a spring and test, followed by higher lows and supply absorption. ICT Fib Extension: Expansion zones line up with 8000 as TP1, consistent with ICT’s market maker models. Goldbach Theory: Historical symmetry and prime pair modeling projects extreme but technically plausible TP2 and TP3 ranges. Notes: This thesis is part of Lord MEDZ's personal trading journal and is not to be taken as financial advice. Cryptocurrency markets are highly volatile. All readers should do their own research and only invest what they can afford to lose. Trade safe. Protect capital. Stay sharp. Lord MEDZ🙏 Thank You 🙏 Massive thanks to everyone who’s shown support—whether through likes, shares, sponsorships, or thoughtful comments. Your engagement keeps me motivated to stay consistent in this journey. I'm truly grateful for the community that's forming around these insights. Let’s continue learning, growing, and navigating these markets together. Much love and respect. 💙 — Lord MEDZ
Skinwah
Lord MEDZ VeChain (VET) Long-Term Trading Setup
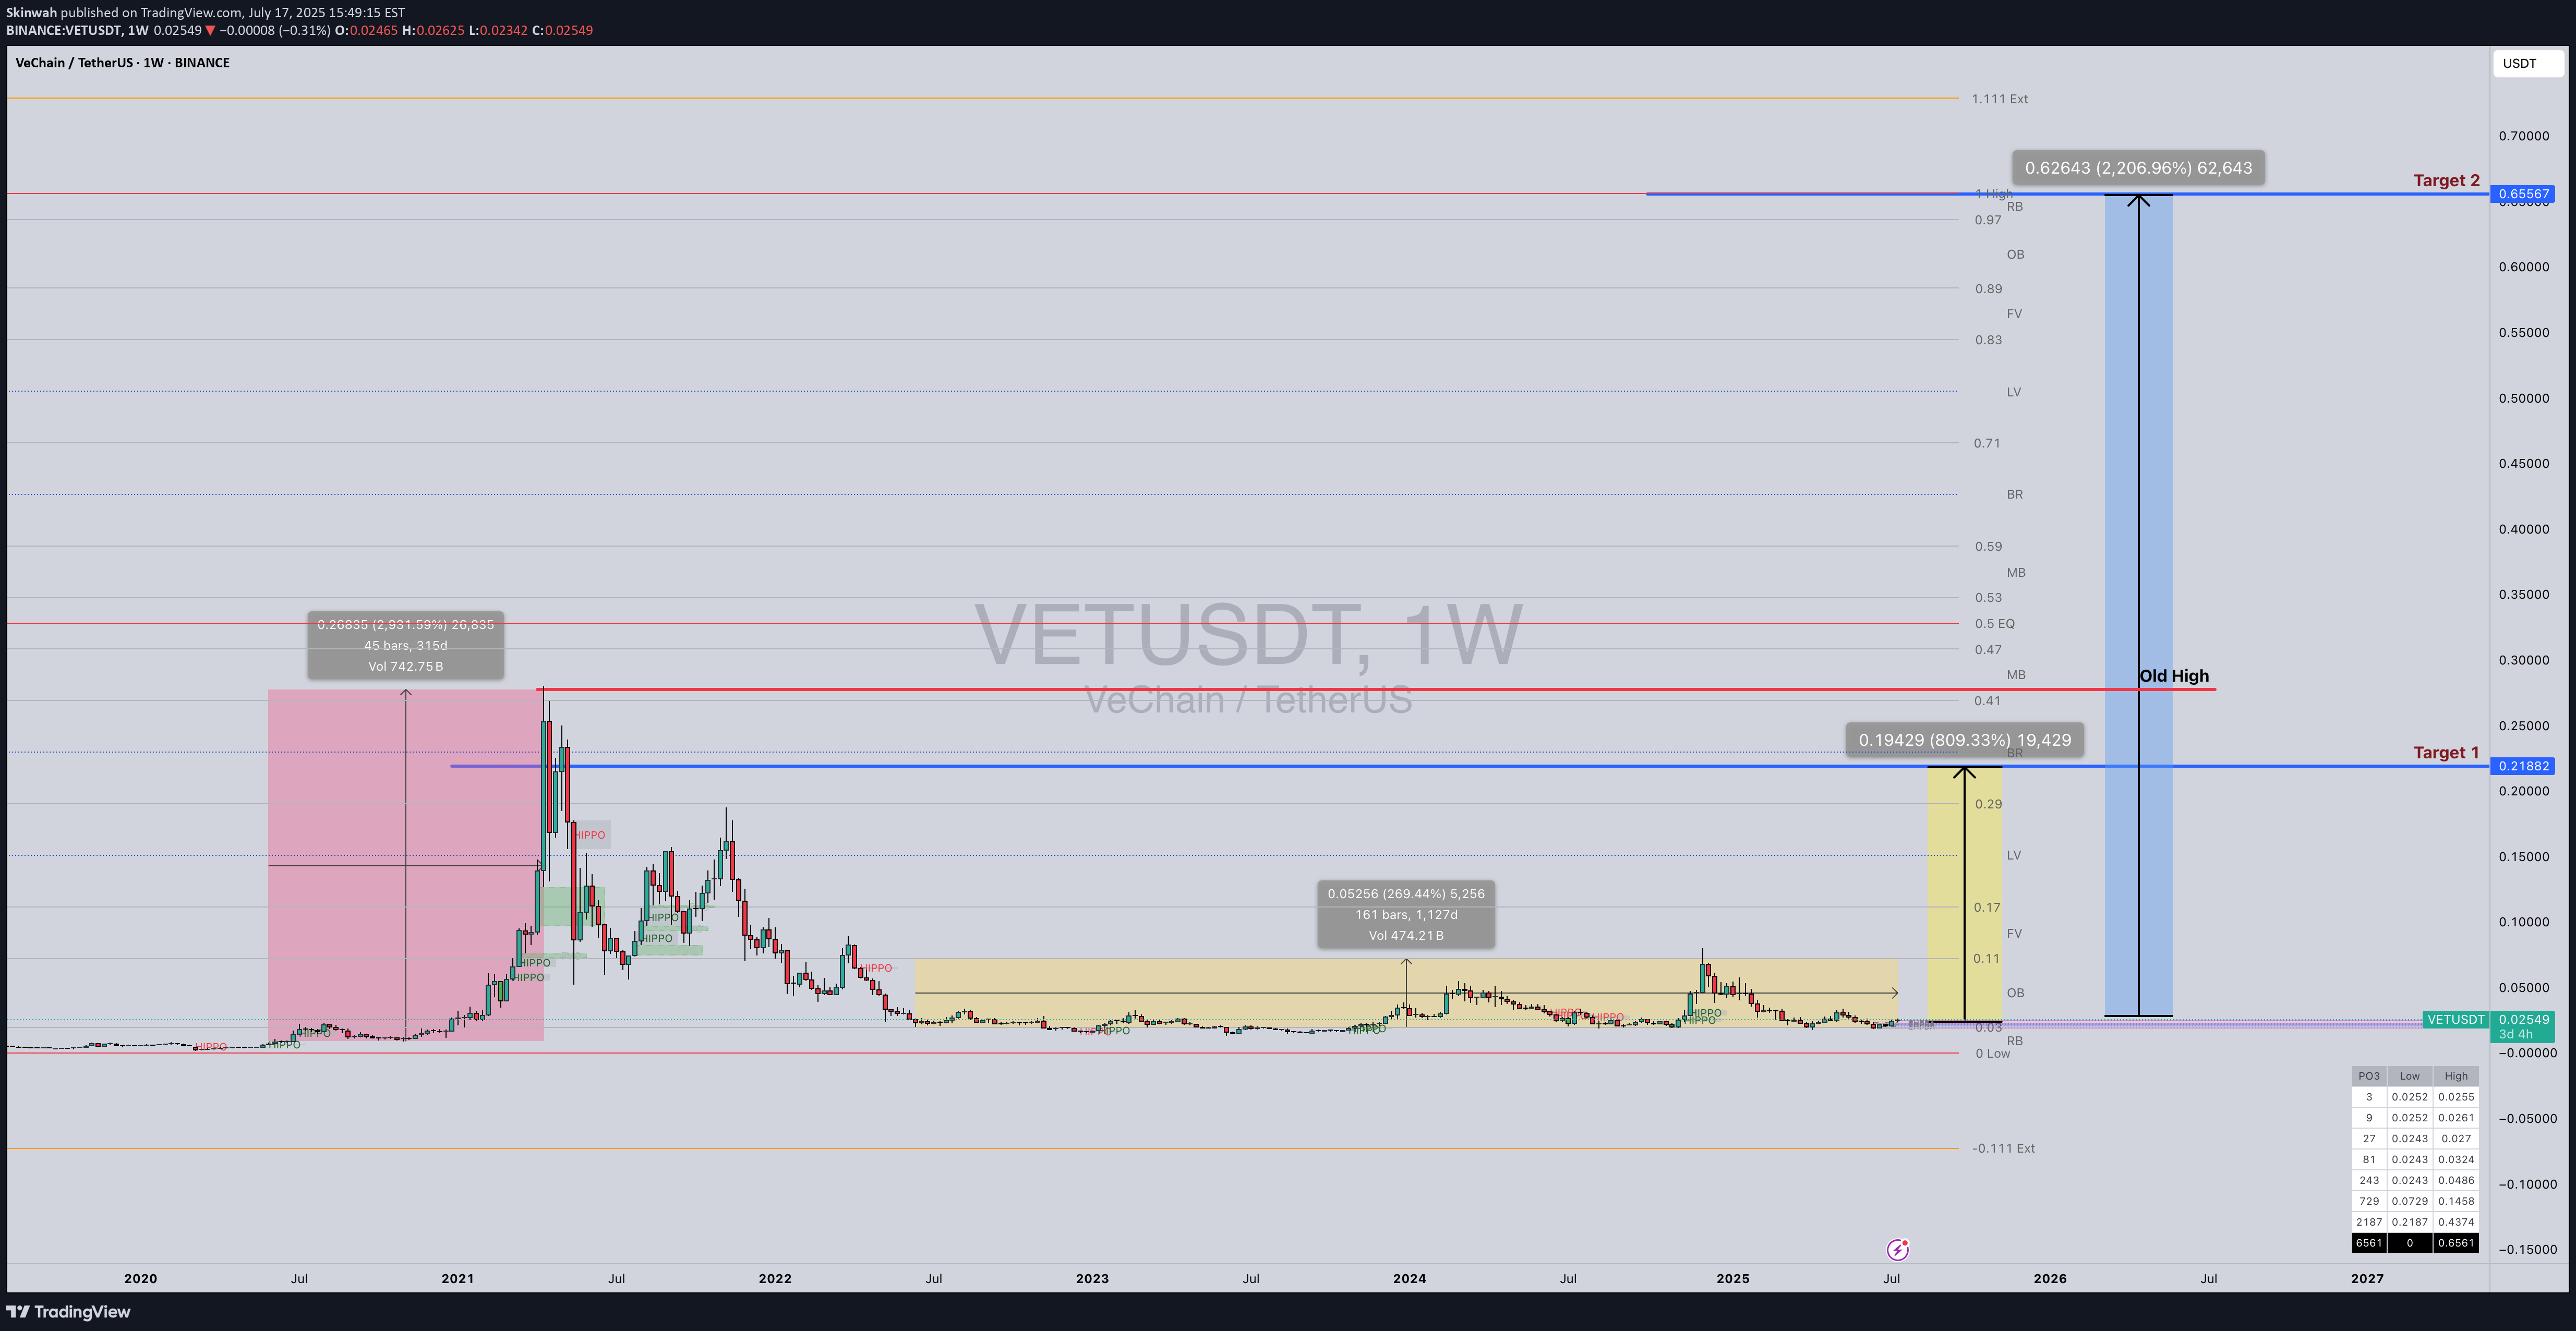
Overview This document outlines a speculative long-term trading setup for VeChain (VET), based on historical price behavior, technical chart levels, and macro market context. The strategy focuses on a potential breakout from a prolonged accumulation phase, with two major price targets in mind. Disclaimer: This is not financial advice. Always do your own research (DYOR). Cryptocurrency is highly volatile and carries significant risk. Background VeChain (VET) is currently priced around $0.0255 and has been in a clear accumulation phase for approximately 1,120 days. This period follows its previous bull cycle in 2020–2021, during which VET increased by over 12,800% in just 315 days, reaching a high near $0.28. This setup assumes the possibility of a similar cyclical expansion, using time symmetry, price structure, and historical context as the foundation. Technical Targets & Market Cap Projections TargetPrice LevelPotential GainEstimated VET Market Cap% of Total Crypto Market Cap ($3.83T)Time Estimate Target 1$0.19429+809%~$16.7 Billion~0.44%July 2026 Target 2$0.62643+2,207%~$53.9 Billion~1.41%2029–2030 These market caps are calculated using VET's current circulating supply of ~85.98 billion tokens. The total crypto market cap as of July 17, 2025, is $3.83 trillion. Setup Rationale VET has remained in a low-volatility, sideways trading range for over 3 years, typically indicating accumulation. On the weekly chart, large inefficiency gaps (Fair Value Gaps / FVGs) and Order Blocks (OBs) remain unmitigated above. Targets are aligned with key liquidity zones: Target 1 overlaps with previous structure resistance and inefficient price gaps. Target 2 aligns with long-term Fibonacci extensions and higher timeframe liquidity voids. Timing Logic The previous bull run to the old all-time high took 315 days. If similar cyclical behavior repeats: A move to Target 1 could realistically occur within 1 year from the start of expansion — estimated around July 2026. Target 2 is a longer-term projection, dependent on broader market conditions and adoption. It could take up to 5 years. Risks & Final Notes This is a speculative roadmap, not a guaranteed outcome. VeChain’s performance will depend on many factors, including: Adoption of its technology Broader market cycles Bitcoin and Ethereum trends Macroeconomic environment Traders should practice risk management, use stop-loss strategies, and avoid overexposure. Conclusion VET has been sleeping, quietly collecting energy like a coiled spring. The charts show the ghosts of old liquidity and the paths they may retrace. If the market aligns, this setup could be a generational play. But remember, only the prepared survive the volatility. DYOR. Protect your capital. Lord MEDZ🙏 Thank You 🙏 Massive thanks to everyone who’s shown support—whether through likes, shares, sponsorships, or thoughtful comments. Your engagement keeps me motivated to stay consistent in this journey. I'm truly grateful for the community that's forming around these insights. Let’s continue learning, growing, and navigating these markets together. Much love and respect. 💙 — Lord MEDZ
Skinwah
ADA is Still in Discount of the Discount by Lord MEDZ
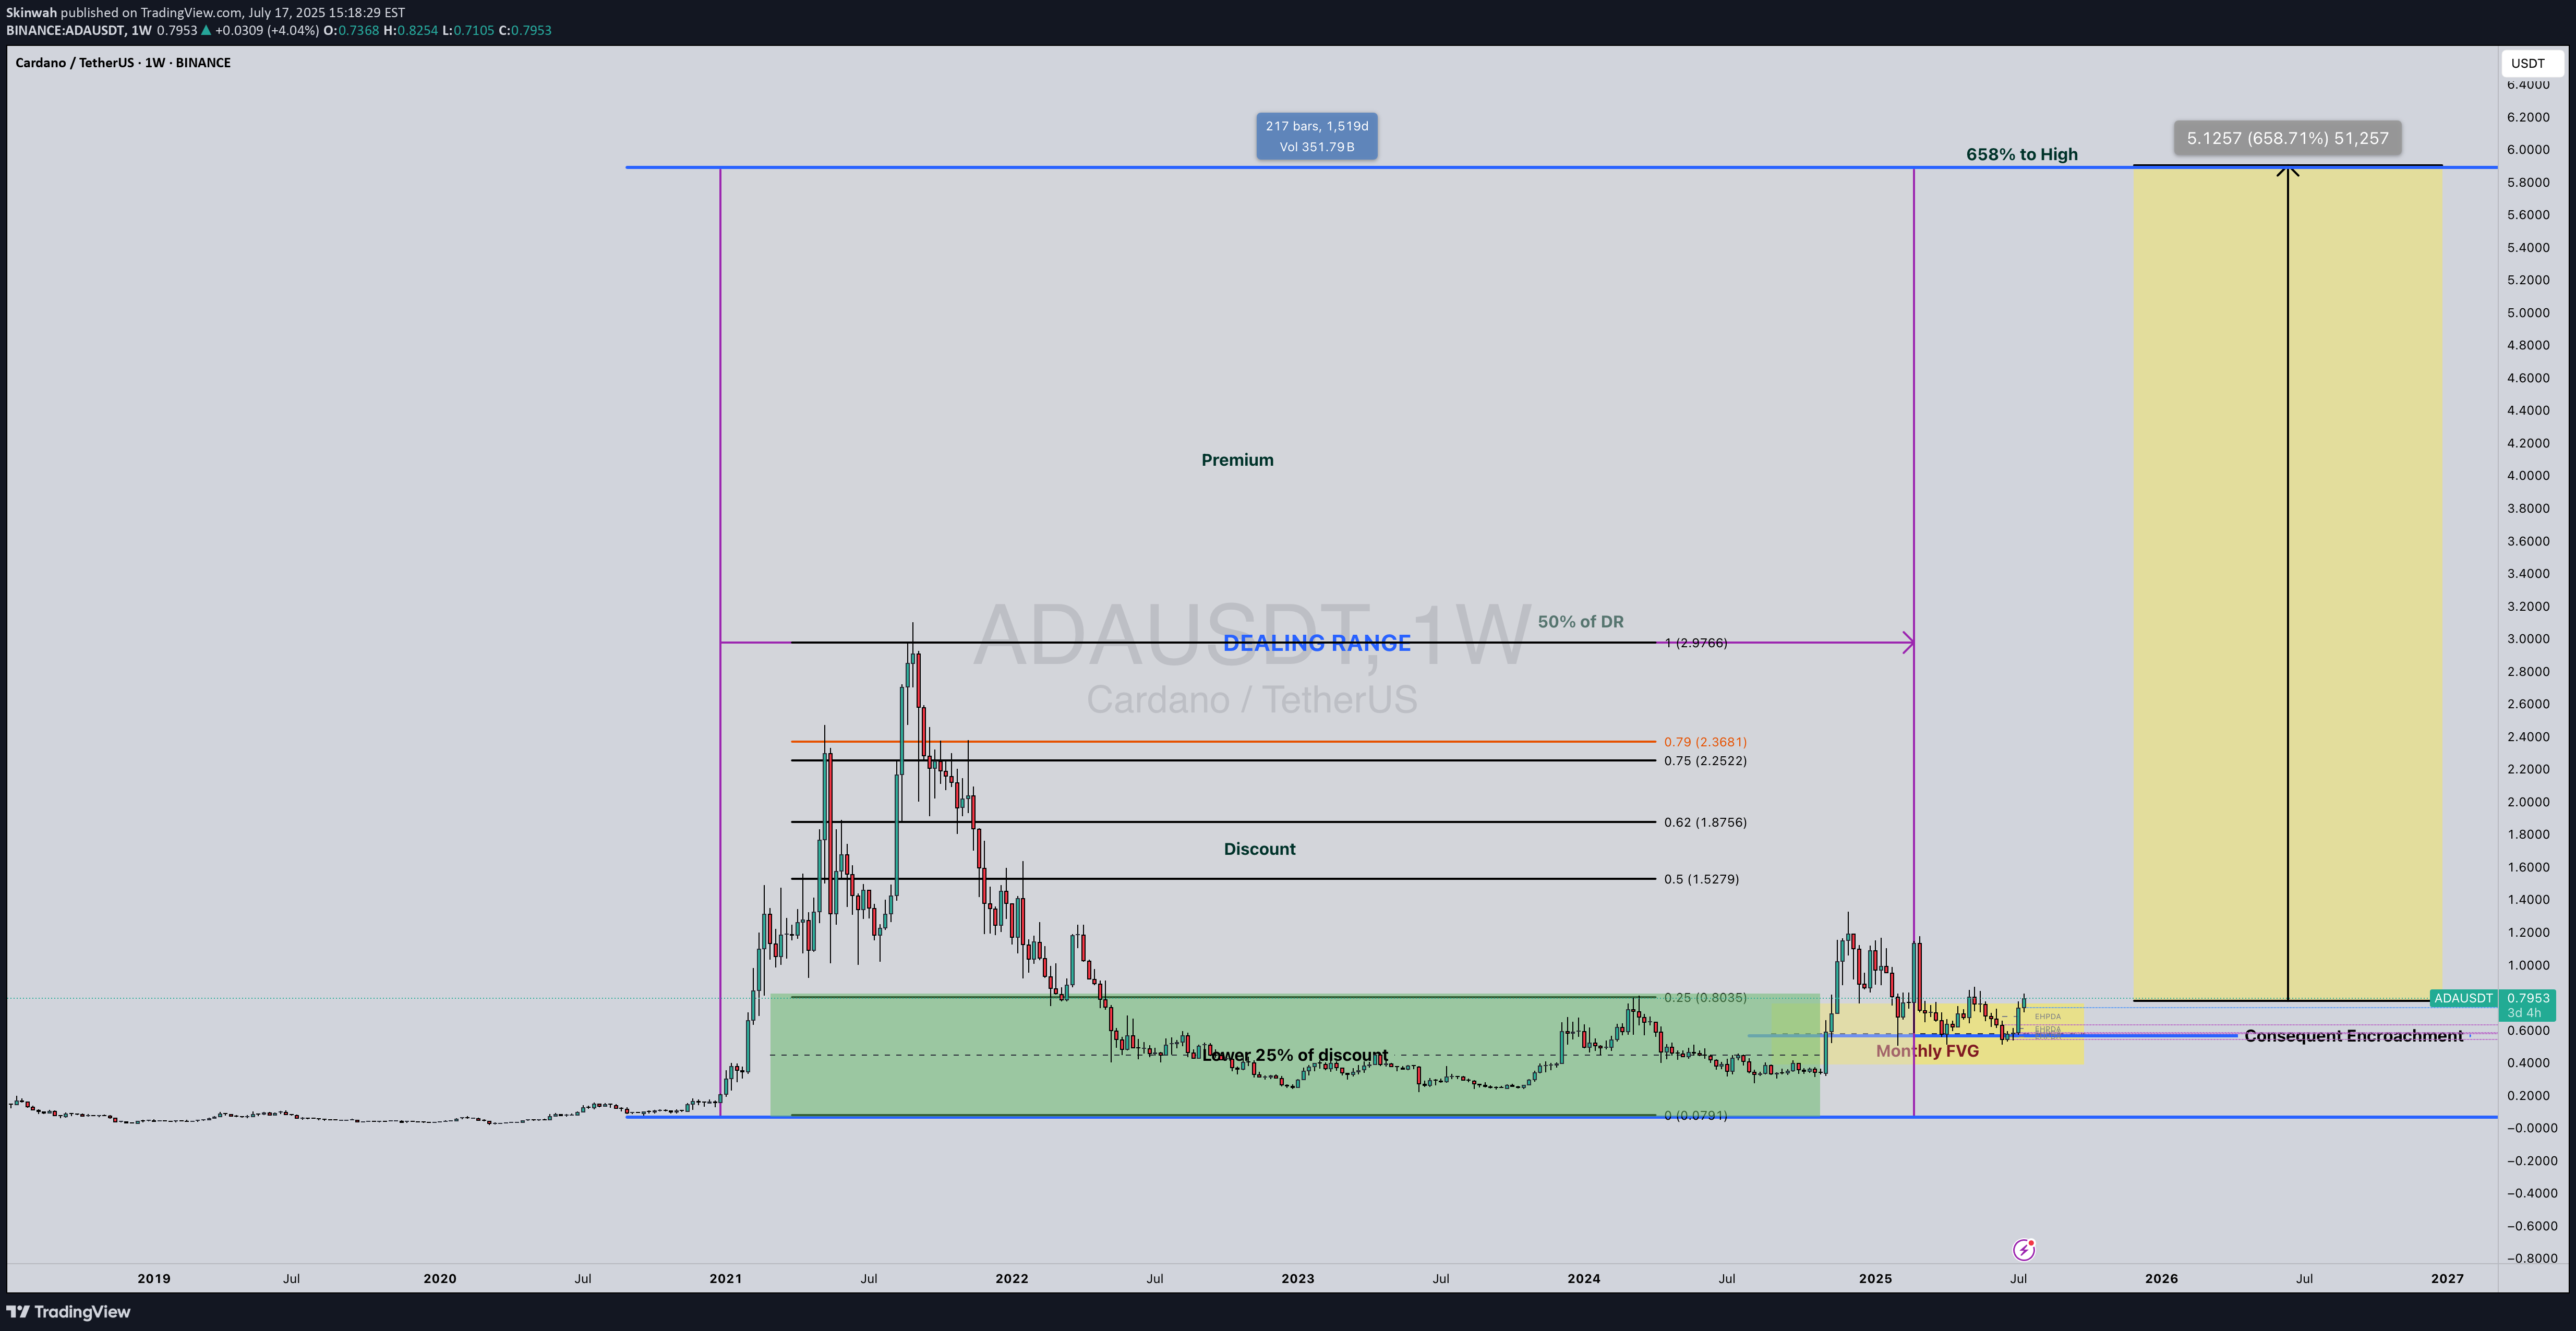
As of the July 2025 monthly close, ADA/USDT remains deep in the discount zone—more precisely, within the lower 25% of the discounted portion of the overall Dealing Range. At a current price of $0.79, ADA is still presenting what I view as a high-R multiple opportunity, technically speaking. The monthly chart shows that price has decisively respected the 50% Consequent Encroachment level of the previous monthly Fair Value Gap (FVG). This happened after a clean breakout and retest of the buy-side imbalance, confirming bullish intent from a macrostructure standpoint. We are still significantly below the midpoint (50%) of the Dealing Range, with a long-term projection target of around $5.13, which represents a potential move of approximately 658% from current levels. That would take us back to the high of the Dealing Range, where premium pricing begins to dominate. Key Highlights: Current Price: $0.79 Dealing Range High Target: ~$5.13 % Move to High: ~658% Context: Monthly structure, liquidity considerations, and premium/discount framework Market Condition: Post-gap retest, structure remains bullish while in deep discount This setup aligns with my long-term bias while ADA remains deeply discounted. Still, as always: This is for my personal journaling purposes only. Not financial advice. Always DYOR. — Lord MEDZ🙏 Thank You 🙏 Massive thanks to everyone who’s shown support—whether through likes, shares, sponsorships, or thoughtful comments. Your engagement keeps me motivated to stay consistent in this journey. I'm truly grateful for the community that's forming around these insights. Let’s continue learning, growing, and navigating these markets together. Much love and respect. 💙 — Lord MEDZ
Skinwah
HBAR/USDT Weekly Setup – Lord MEDZ Trading Journal
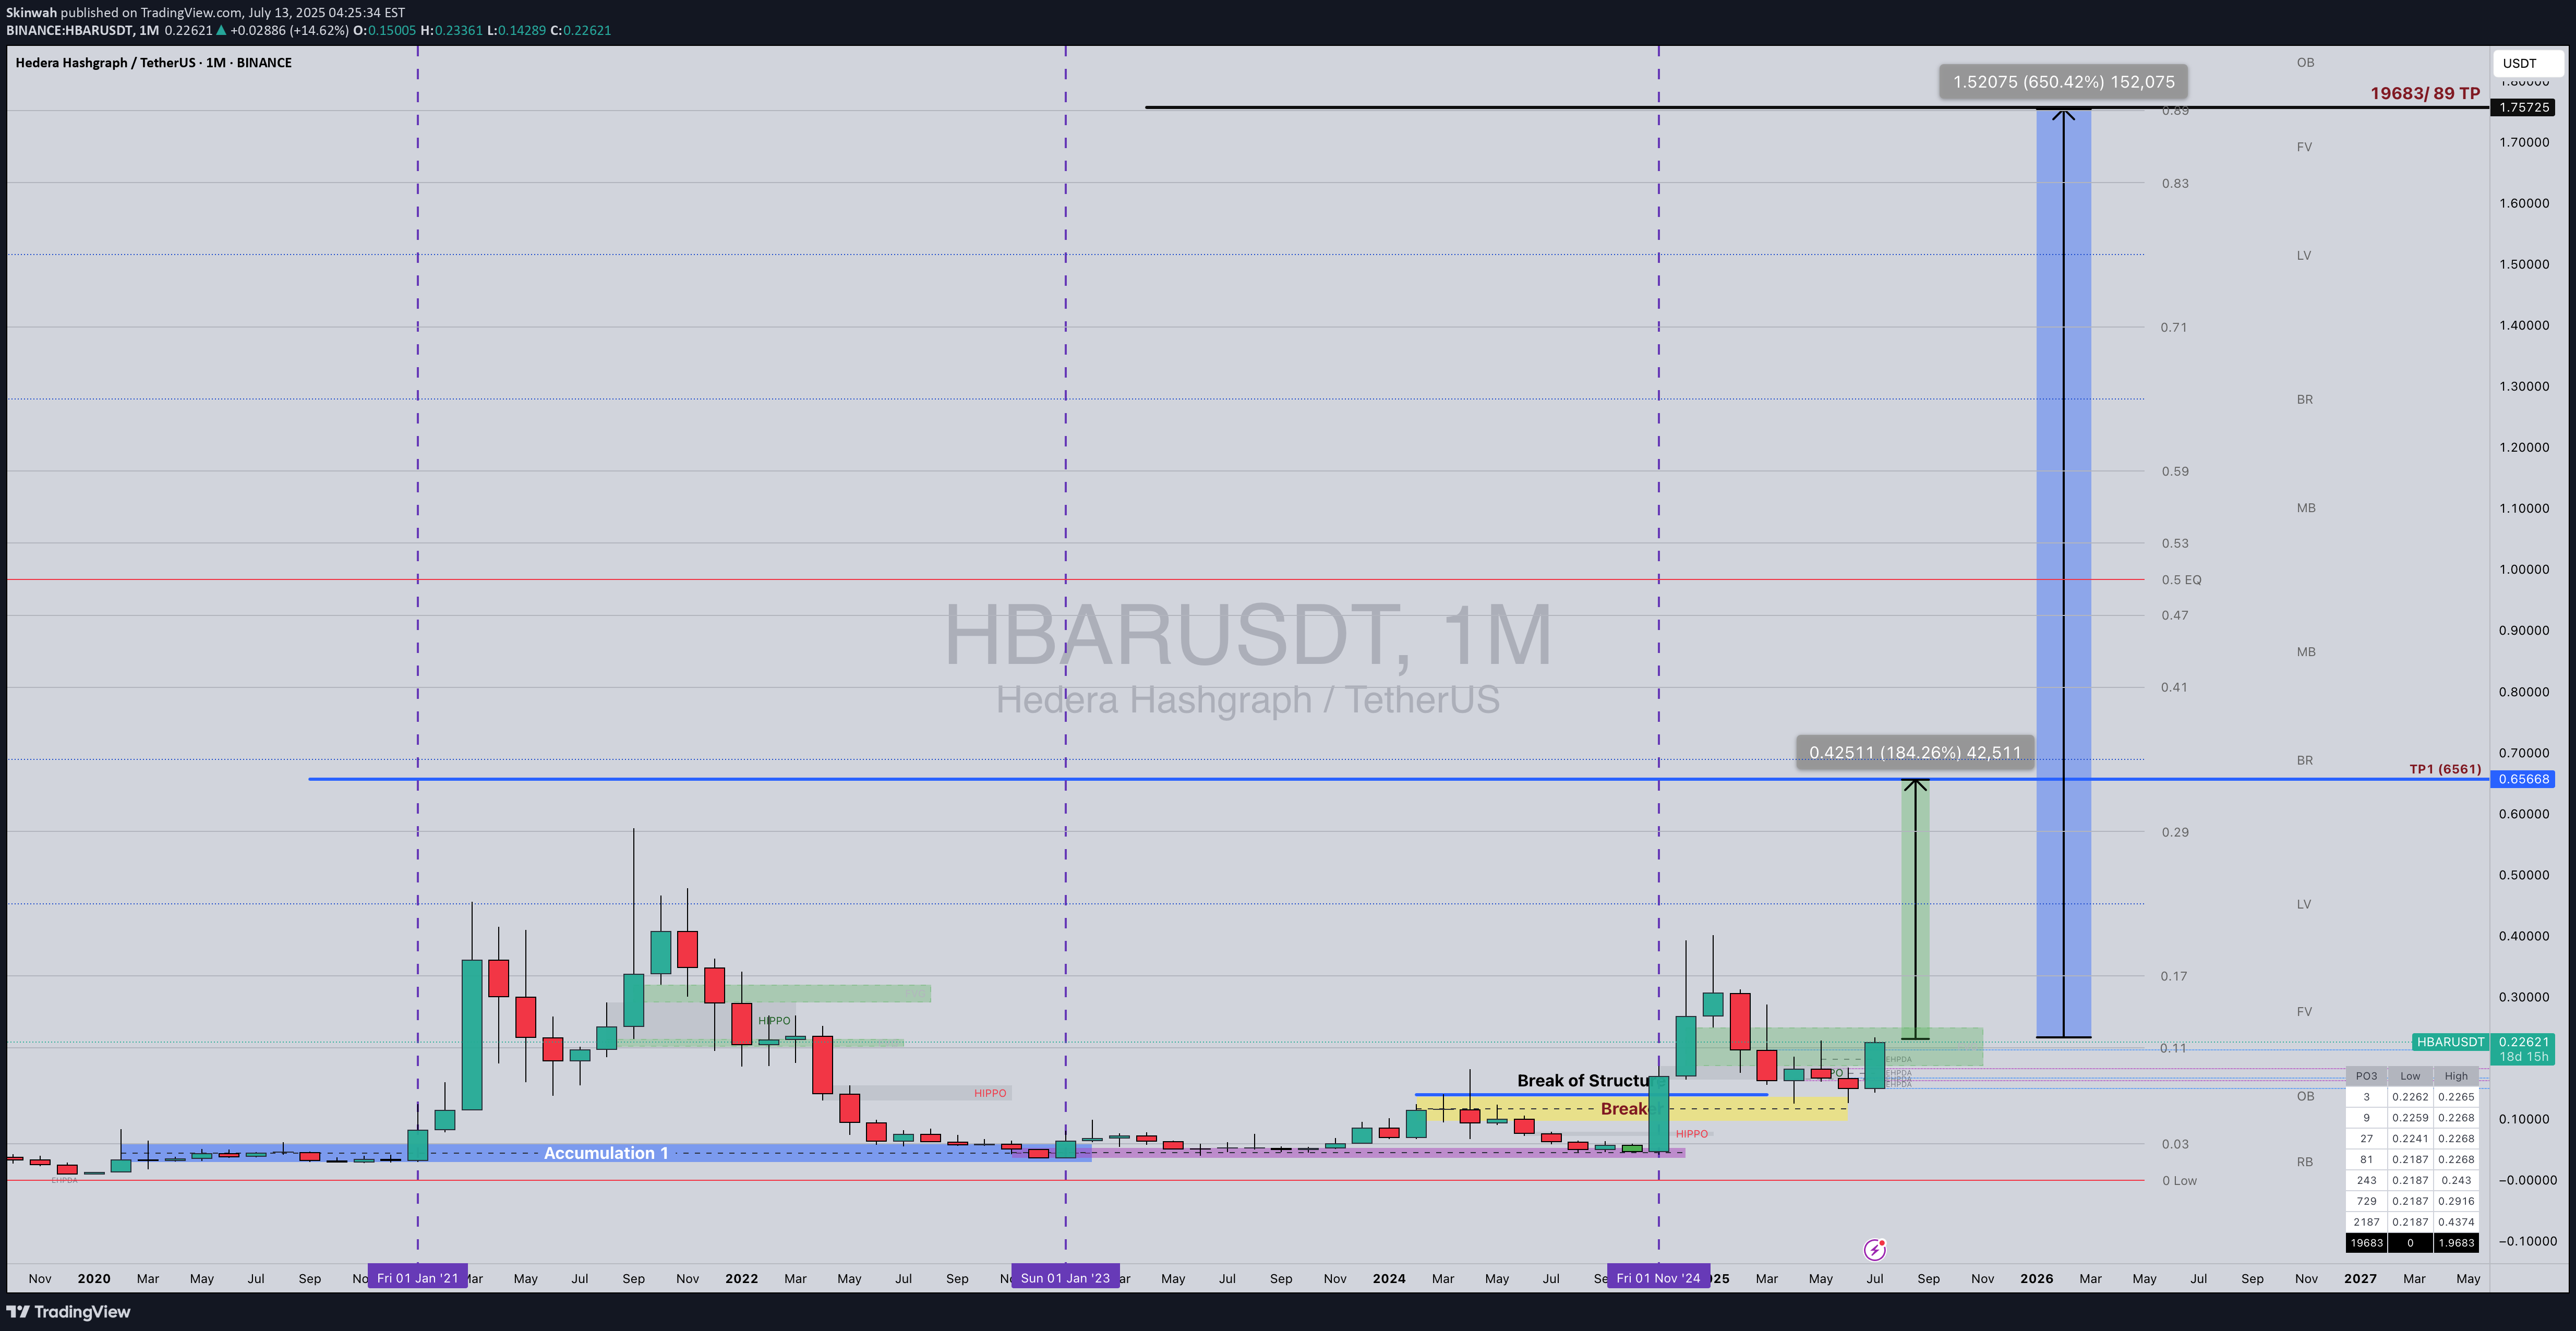
"Where Smart Money Moves, Profits Follow" This is not financial advice. This post is for personal trading journaling and educational purposes only. Overview In this week's market breakdown, I’m sharing my current view on Hedera Hashgraph (HBAR/USDT) using a combination of Smart Money Theory (SMT), Supply & Demand zones, and my proprietary Goldbach Timing Model. Structure and timing are finally aligning after years of preparation. Based on my analysis, HBAR is showing the potential for a 184% breakout in the near term, with a longer-term projection targeting $1.75 by 2026. Smart Money Theory (SMT) – From Accumulation to Expansion HBAR has completed a textbook accumulation cycle, marked by stealth positioning from smart money: From 2020 to late 2021, price action showed clear signs of Accumulation Phase 1, with suppressed volatility and low-volume accumulation. In early 2023, HBAR completed its retest phase, holding structural support and rejecting lower demand levels. A Break of Structure (BOS) occurred in Q4 2024, confirming bullish intent, followed by a clean retest of the Breaker Block (highlighted in yellow on the chart). According to SMT principles, this BOS confirms that institutional liquidity has re-entered the market—and now, we move toward expansion. Supply & Demand – Reading the Liquidity Landscape HBAR is being driven by strong demand and significant inefficiencies above price: The Breaker Block demand zone between $0.06 and $0.08 held firm, acting as a base for the recent move. There are large Fair Value Gaps (FVGs) between $0.17 and $0.29, which often act as magnets for price seeking balance. The next major supply zone sits around $0.65, which also aligns with previous highs and is now my first major target (TP1). Price is currently reclaiming these inefficiencies, and if momentum holds, we could see rapid continuation toward the upper supply targets. Goldbach Timing Model – Precision Cycle Forecasting The Goldbach Cycle Window I use is a proprietary time-based projection model designed to capture cyclical expansions around liquidity events. It has successfully forecasted previous expansions with high precision. For HBAR, here’s how the model lines up: November 2024 marked the break of structure and initiation of the current bullish leg. May 2025 is my forecasted expansion window, when momentum is expected to accelerate further. The final cycle confluence target is projected to align with $1.75 by 2026, based on historic symmetry and previous expansions. This alignment of price action and time-based expansion gives me high confidence in the setup. Trading Plan (as of July 2025) My personal trading strategy here is structured as follows: I am currently re-accumulating long positions around $0.22, as price consolidates above the previous range highs. Upon a clean breakout and close above $0.23, I plan to add to my position. My first target is $0.65, which aligns with a major supply zone and likely liquidity cluster. I intend to take partial profits there. If market conditions remain favorable and we maintain momentum through the Goldbach window, my final long-term target is $1.75—a projected cycle top based on structural and time confluence. Final Thoughts HBAR is no longer in sleeper territory. It’s now a chart with structure, imbalance, and timing on its side. As always, I remain patient and disciplined. If we see clean continuation through $0.60–$0.65, we enter what I consider clear skies—where price has little resistance on the way to cycle targets. 🙏 Thank you for taking the time to read. I appreciate every like, repost, and follow as I continue journaling these setups. Grateful for the support! 🔔 Follow Lord MEDZ for more cycle-based Smart Money setups and insights.
Skinwah
XLMUSDT SPOT PLAY – LORD MEDZ JOURNAL UPDATE
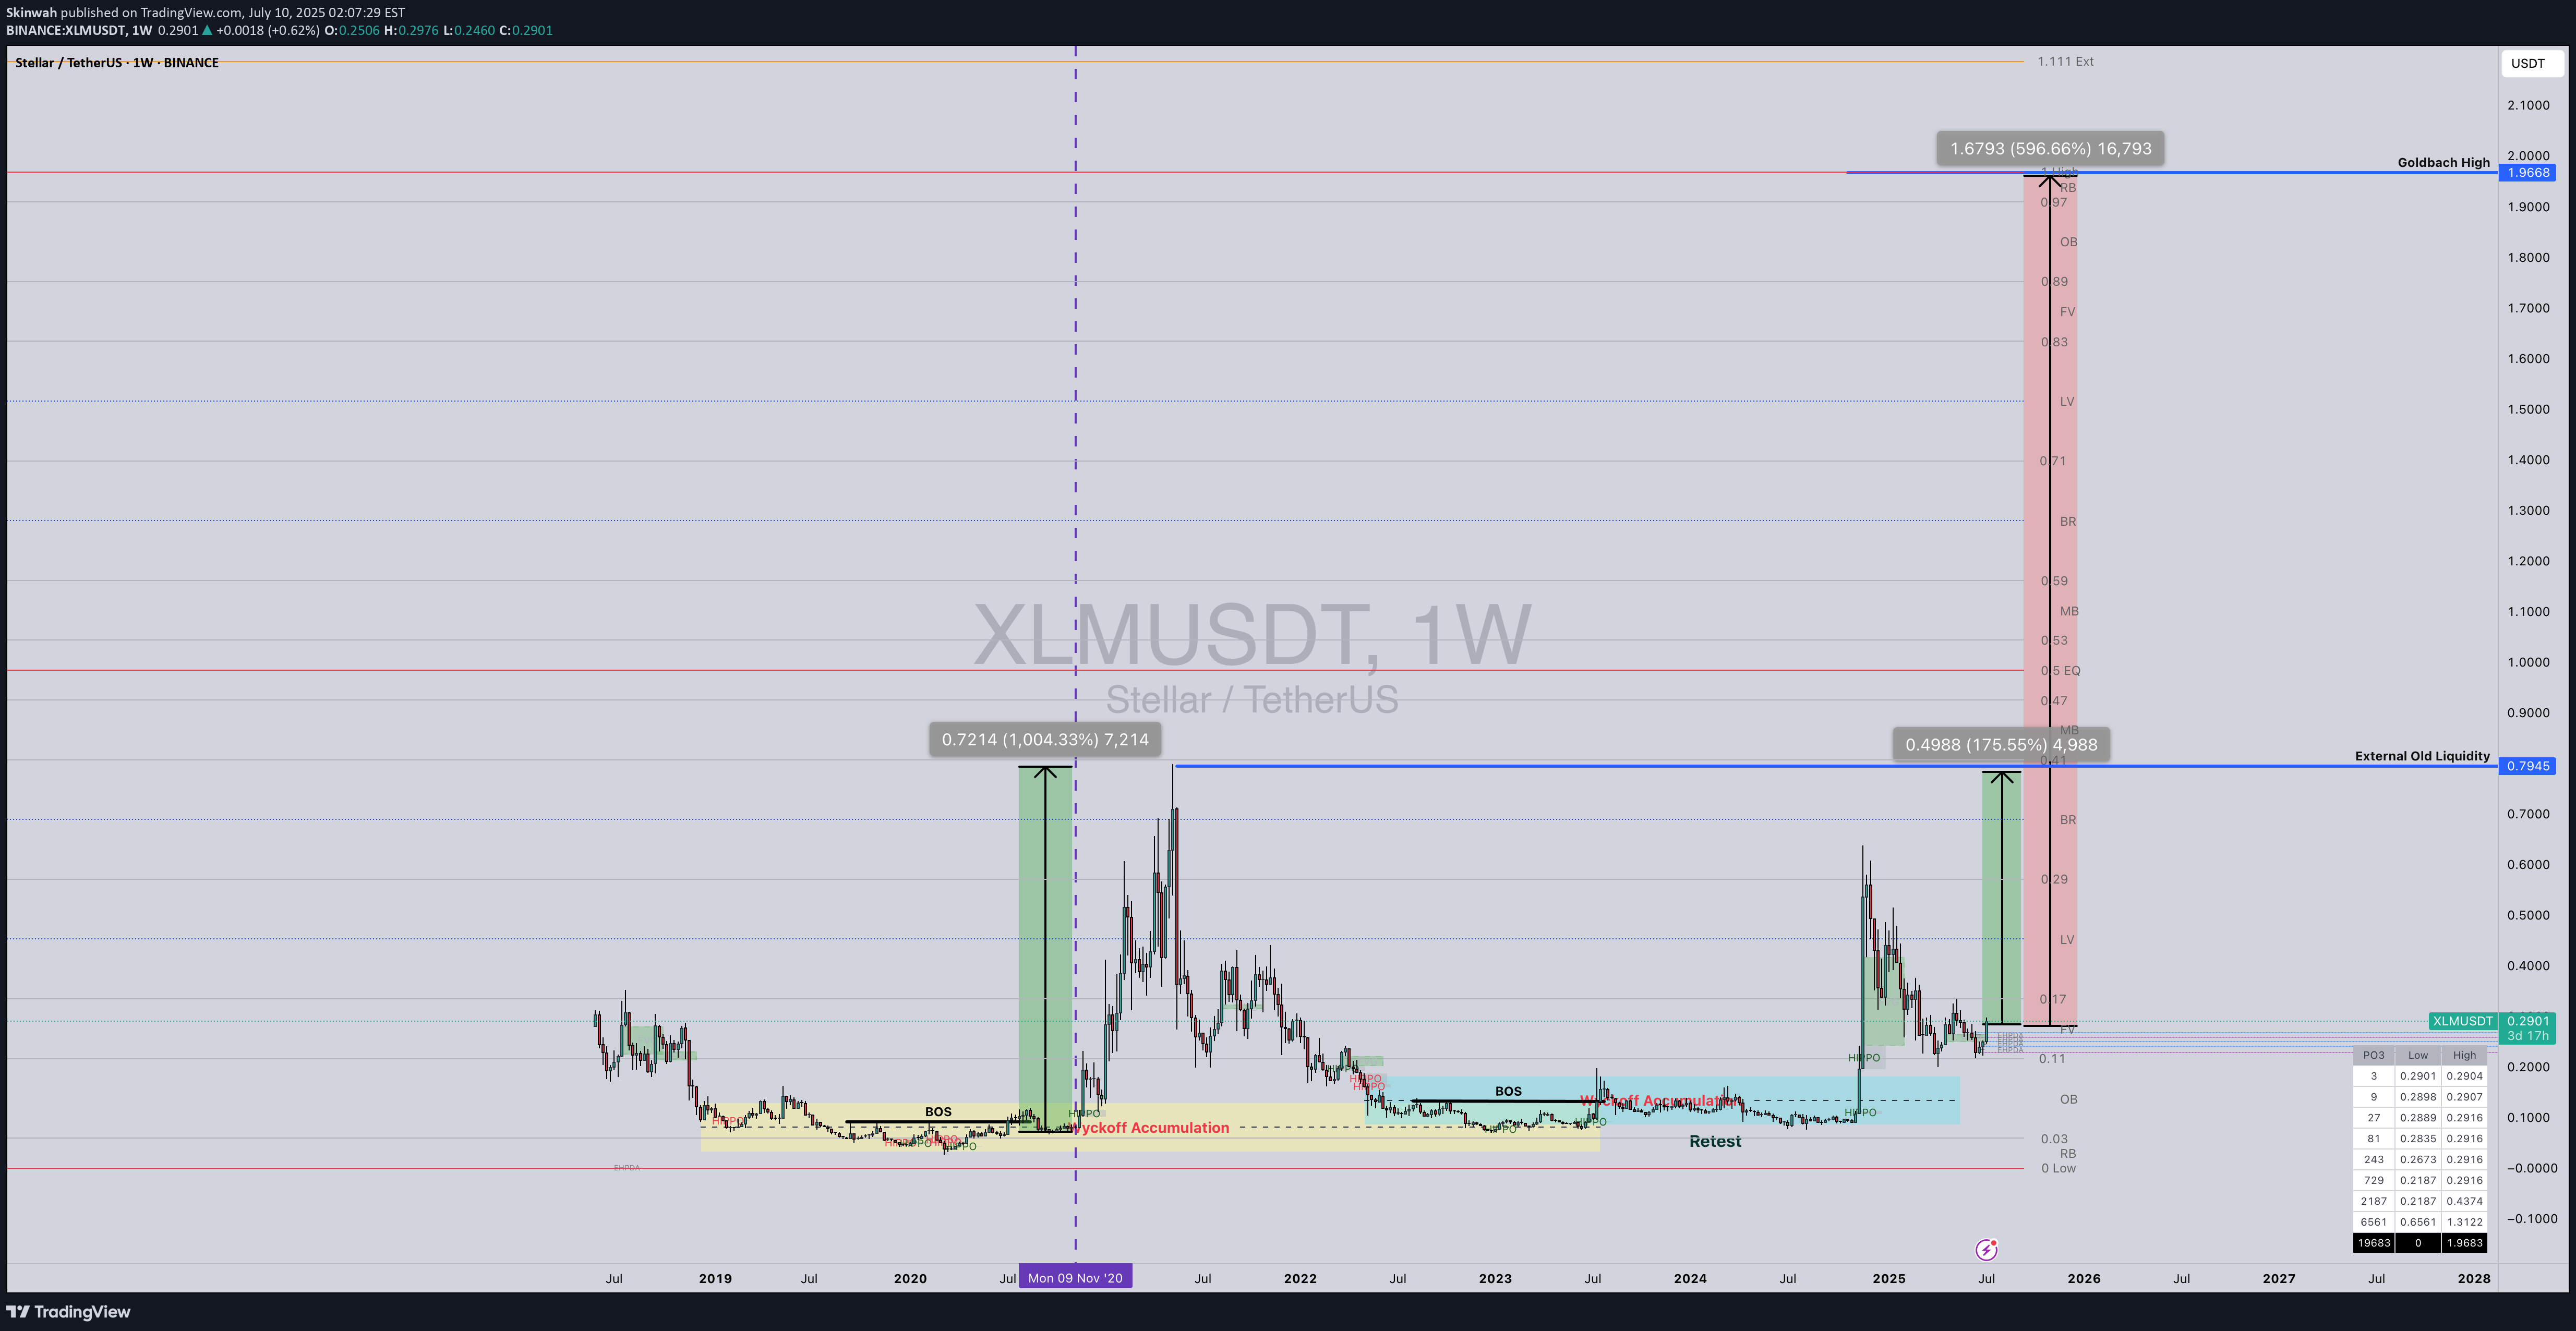
Framework: SMC x Goldbach | Chart TF: 1W | Asset: Stellar (XLM) 📆 Update Date: July 2025 📌 Disclaimer: This is for journaling purposes only. Not financial advice. DYOR. 🔍 Observing the Macro: The Wyckoff Legacy Lives On Looking left on the weekly chart, Stellar (XLM) executed a textbook Wyckoff Accumulation structure back in November 2020, forming a solid base at the lows. That structure didn’t just sit there — it sponsored a 1,004% rally, breaking key structure and running external liquidity with clean aggression. What makes this setup particularly compelling in 2025 is the retest narrative. Price has gradually retraced back into the original demand zone, revisiting that same accumulation origin — not with panic, but with controlled compression and absorption. Following this retest, XLM has already begun an impressive move away from the zone, signaling potential for continuation. 📈 Current Playbook Setup ✅ Demand Revisit: Price has returned to the very zone that birthed the 2020 pump — a validated origin of strength. ✅ Break of Structure (BOS) occurred earlier this cycle, confirming accumulation completion. ✅ Retest of Accumulation Range happened cleanly, just before this fresh impulse. From an SMC and Goldbach lens, this is a premium long-term opportunity for spot holders, not futures traders. The structure, timing, and liquidity align for a macro bullish leg. 🎯 Targets of Interest 🟦 External Old Liquidity at $0.79 – First major target, where past wicks were left unchallenged. 🔺 Goldbach Projected High at $1.96 – Ultimate macro target, representing a potential +596% move from current levels. This aligns with the Goldbach model’s high-probability expansion zones and historical confluence levels, not just speculation. 🧠 Conclusion & Outlook We’re now in a phase where smart money has loaded, the latecomers haven’t arrived yet, and the chart is whispering re-accumulation. This is shaping up to be the second great leg of the XLM cycle, potentially echoing the 2020–2021 explosion. The move away from demand has begun. The targets are mapped. As always: no leverage, no noise — just spot and time. 📓 Lord MEDZ Signing Off ✍️ This post is part of my private trading journal and is not financial advice. Always do your own research (DYOR). 🔒 This setup is for SPOT HOLDING — not futures trading.Up 55% since I posted this call.
Skinwah
XRP/USDT Trade Setup – 15min

London session raided Asia's lows, grabbing liquidity and creating the conditions for a bullish reversal. This setup aligns with the NY session's typical continuation behavior following a London manipulation move.Post-raid, price structure shifted bullish, indicating smart money accumulation. A clear fair value gap (FVG) formed, and entry was taken upon confirmation of bullish order flow.Entry: 2.227Stop Loss: 2.200Take Profit: 2.400Risk-Reward Ratio: 9.23RNarrative:London session swept Asia lows (liquidity engineered).Break in market structure confirmed shift.Entry aligned with FVG and order block mitigation.Targeting inefficiency fill and liquidity above recent highs.Note:This trade is for journal purposes only and not financial advice.Always perform your own analysis and manage risk accordingly.2.40 hit
Skinwah
BTC/USDT Trade Setup – Lord MEDZ

Strategy: Goldbach Fair Value Gap + Smart Money Concepts (SMC) Timeframe: 6H Bias: Long Trade Parameters Entry: 102,577 Stop Loss: 99,527 Take Profit: 118,153 Risk to Reward: Approximately 5:1 Confluences and Justification Price is expected to retrace into a clear Fair Value Gap (FVG) formed after displacement, aligning with the Goldbach model. The structure confirms a completed reaccumulation phase, presenting a high-probability long setup. This would complete the right shoulder of the classic inverse head and shoulders pattern, with the shoulder projected to dip into the POI. Head and shoulders patterns are often manifestations of Wyckoff accumulation or distribution phases, for those who may not be aware. Liquidity left inside the gap provides inducement, increasing the likelihood of a sweep into the 102.5K zone. The take-profit target at 118,153 aligns with the high of the Goldbach Fibonacci extension level. Execution Plan Wait for price to return to the FVG zone around 102,577. Look for confirmation such as a bullish displacement candle, a lower time frame BOS (break of structure), or mitigation of a lower time frame order block. Upon confirmation, execute long with a stop below 99,527. Take profit is set at 118,153. Final Note from Lord MEDZ "I await the return of price to imbalance. The reaccumulation is complete, and the alignment is clear. Entry shall be taken where inefficiency remains, and profit shall be claimed where liquidity awaits."Never came back to entry but TP £118k reached.
Skinwah
Pair: XRP/USDT

Session: NY OpenFramework: Smart Money Concepts x Goldbach PrecisionSwept the Asia Low — textbook liquidity grab.Price retraced perfectly into a Goldbach Fair Value Gap (FVG) following the sweep, aligning beautifully with Smart Money logic.This setup confirms internal liquidity was cleared and we're now respecting a high-probability demand zone.The confluence of the Goldbach FVG + accumulation range + OB is giving this long position serious weight.Holding the 2.0767 entry, with stop loss tight below the sweep at 2.0669, targeting the high-efficiency zone above at 2.19.12:1 RR still in play. Now we wait for structure to shift and price to deliver.Stay sharp — premium is ahead.TP1, TP2 AND TP3Target Hit — Precision ExecutionPair: XRP/USDTFramework: Smart Money x Goldbach MethodologyTimeframe: 5MEntry: 2.0767TP: 2.19SL: 2.0669Risk:Reward: 12:1Outcome: TP HITExecuted flawlessly.After sweeping the Asia low, price retraced back into the Goldbach Fair Value Gap.That was the golden moment — confirmation aligned with macro accumulation and OB structure.From there, price respected the entry zone and surged with clean displacement straight into TP1 (2.19).No drawdown past SL zone — pure SMC flow.This wasn’t luck — this was precision logic + data-backed execution.Goldbach + Smart Money delivers again.Lord MEDZ signing off.Wait for the next sweep — the market always leaves a footprint.
Skinwah
BTCUSD 1M (Monthly)

Alright folks, here’s the latest view on Bitcoin from yours truly, Lord MEDZ. Things are getting interesting — let’s break it down nice and simple. Step A – The Pump to $167,000 Bitcoin looks ready to break out from the old highs around $109K and could rally straight up to around $167K. That would be a big move — about a 50% gain from where we are now. There's not much resistance above the old high, so this move could be fast and strong. Step B – A Healthy Pullback to $125,000 After that run-up, I’m expecting a pullback — possibly back to around $125K. That’s about a 25% drop. Nothing scary, just a typical correction to shake out the weak hands before the next leg. Step C – Final Move to $177,000 From there, I see Bitcoin pushing one more time to a final high around $177K. That would complete the A-B-C pattern I’m tracking on the monthly chart. Summary We're currently around $109K. First target = $167K Possible pullback = $125K Final high = $177K I think we’re in the early stages of a big move. The old highs are behind us. Above here? It’s clear skies. ⚠️ DISCLAIMER: This is not financial advice. Just sharing how I see the chart. Always do your own research and manage your risk. The market doesn’t owe us anything. Stay sharp out there. – Lord MEDZBuckle up
Disclaimer
Any content and materials included in Sahmeto's website and official communication channels are a compilation of personal opinions and analyses and are not binding. They do not constitute any recommendation for buying, selling, entering or exiting the stock market and cryptocurrency market. Also, all news and analyses included in the website and channels are merely republished information from official and unofficial domestic and foreign sources, and it is obvious that users of the said content are responsible for following up and ensuring the authenticity and accuracy of the materials. Therefore, while disclaiming responsibility, it is declared that the responsibility for any decision-making, action, and potential profit and loss in the capital market and cryptocurrency market lies with the trader.