
SigmaSignals
@t_SigmaSignals

What symbols does the trader recommend buying?
Purchase History
پیام های تریدر
Filter
SigmaSignals
Ethereum's Path to $53,000: Multi-Year Breakout Pattern?
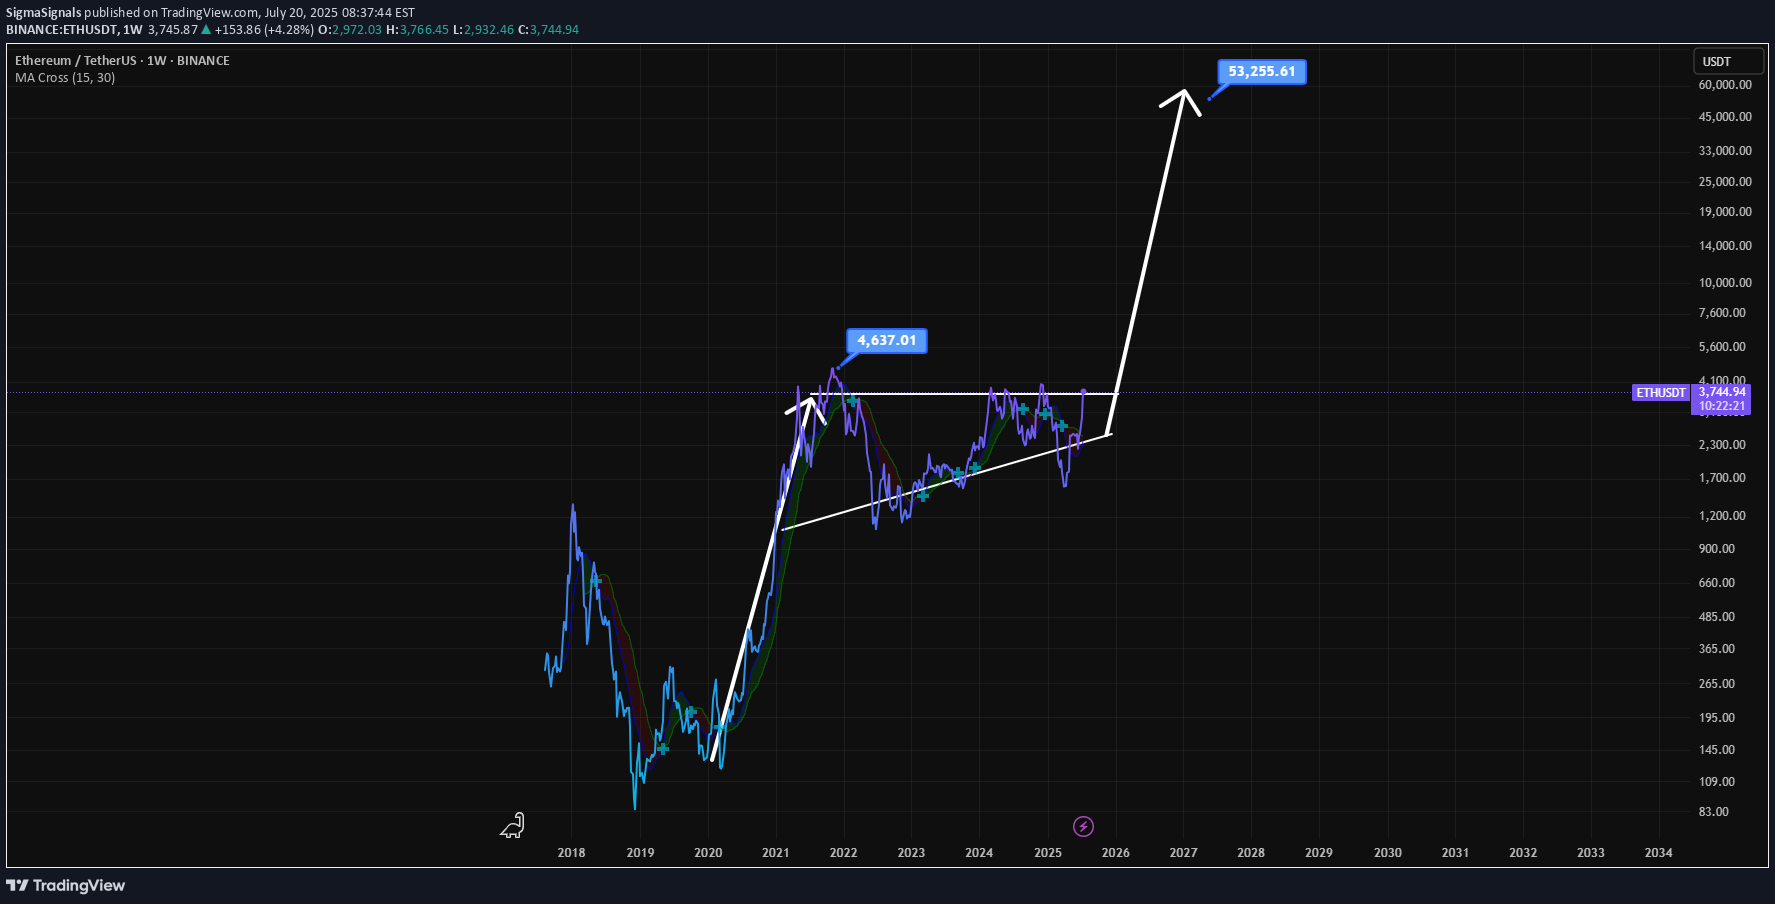
This is a long-term technical analysis chart for the Ethereum/TetherUS (ETH/USDT) pair, presented on a weekly (1W) timeframe and using a logarithmic scale. The logarithmic scale is important as it visualizes percentage-based movements equally, which is crucial for analyzing an asset that has experienced exponential growth over many years. Crucially, the date on the chart is "Jul 20, 2025," which is in the future. This indicates the chart is not just an analysis of past events but a speculative forecast of future price action. Key Elements and Pattern Analysis The chartist has identified and drawn a classic bullish continuation pattern known as an Ascending Triangle. Let's break down its components: The Prior Uptrend (The "Flagpole"): Before the triangle formation, there was a massive upward price move starting in 2020 and peaking in late 2021. This powerful uptrend is the prerequisite for a bullish continuation pattern. The Ascending Triangle Pattern: This is the multi-year consolidation phase that has been forming since the peak in late 2021. Horizontal Resistance: The top of the triangle is a flat resistance line drawn at the previous all-time high, marked with a label at $4,637.01. The price has tested this level and failed to break through it, establishing it as a significant supply zone. Ascending Support: The bottom of the triangle is a rising trendline. The price has made a series of "higher lows" since the market bottom in 2022. This indicates that despite pullbacks, buying pressure is consistently stepping in at higher price levels, showing underlying strength. The Projected Breakout and Target: The core of this analysis is the prediction of what happens next. Breakout: The chartist predicts that the price will continue to consolidate within this triangle until approximately late 2025 or early 2026. At that point, it is projected to break out decisively above the horizontal resistance. Measured Move Target: The extremely bullish price target of $53,255.61 is calculated using a common technical analysis technique called a "measured move." The height of the triangle at its widest part (from the low around mid-2022 to the resistance line) is measured and then projected upward from the breakout point. This results in the highly ambitious target. Interpretation and Narrative The story this chart tells is as follows: After its parabolic run in 2020-2021, Ethereum entered a necessary, long-term consolidation period. During this multi-year phase, it has been building a massive base of support, with buyers absorbing selling pressure at progressively higher prices (the higher lows). The chartist believes this long period of accumulation will eventually resolve to the upside, with a powerful breakout above the previous all-time high. Such a breakout would signal the end of the consolidation and the beginning of a new major bull market cycle for Ethereum, with a projected target far exceeding the previous peak. Important Caveats Highly Speculative: This is a long-term forecast. Technical patterns are about probabilities, not certainties, and they can fail. The future date and extreme target price highlight the speculative nature of this analysis. Pattern Invalidation: The entire bullish thesis is invalidated if the price breaks down below the ascending support trendline. Such a breakdown would be a significant bearish signal, suggesting a major trend reversal instead of a continuation. External Factors: This technical analysis does not account for fundamental factors, macroeconomic shifts, regulatory changes, or other black swan events that could dramatically impact the price of Ethereum. In summary, the chart presents a very bullish long-term outlook for Ethereum, based on the formation of a classic ascending triangle pattern. It forecasts a multi-year consolidation followed by a powerful breakout and a new, explosive bull run to over $50,000. However, this should be viewed as one possible scenario among many, with its own specific conditions for validation and invalidation. Disclaimer: This is not a financial advise. This analysis is purely for informational purposes and should not be considered as investment advice. Trading involves risk, and you should consult with a financial professional before making any decisions.
SigmaSignals
A Colossal Rally Scenario for HBAR to $1,966

HBAR is the utility and security token of the Hedera network, a high-performance distributed ledger that aims to be a faster, fairer, and more secure alternative to traditional blockchains, specifically designed to meet the needs of mainstream and enterprise-level applications.Chart Pattern AnalysisMajor Pattern: Descending TriangleThe most significant pattern on this monthly chart is a large descending triangle that has been forming since late 2021.The upper boundary is a descending trendline connecting the lower highs.The lower boundary is a strong horizontal support line around the $0.042 level, which was tested and held multiple times throughout 2023.Bullish Breakout and RetestIn early 2025 (according to the chart's timeline), the price has decisively broken out of the top of this descending triangle. A breakout from such a long-term consolidation pattern is typically a very strong bullish signal.Following the breakout, the price seems to be performing a retest. It has come back down to touch the former resistance trendline, which is now acting as new support. This is a classic technical move that confirms the strength of the breakout.Candlestick AnalysisThe breakout candle is a strong, full-bodied green candle, indicating significant buying pressure and conviction behind the move.The most recent candles are consolidating above the breakout level, holding the new support. This suggests that buyers are absorbing any selling pressure and preparing for the next move higher.Price PredictionBased on this technical setup, the outlook for HBAR is bullish.Short-Term to Medium-Term: After successfully holding the retest of the broken trendline, the price is poised to continue its upward trend. The first major target would be the previous all-time high from 2021 (around $0.57).Long-Term Projection: The analyst who created the chart has plotted a very ambitious long-term target at $1,966.87643. This is likely a calculated "measured move" of the triangle pattern, projected upwards from the breakout point. While the pattern itself is very bullish, this specific target is extremely optimistic and would represent a massive, multi-year bull run.SummaryThe chart suggests that HBAR has completed a long bearish/consolidation phase and has begun a new major uptrend. The breakout from the multi-year descending triangle, confirmed by a successful retest, is a powerful signal for future price appreciation.The price is expected to go up. The immediate trajectory is likely continued upward movement, with key historical resistance levels as initial targets. The extremely high long-term target should be viewed as a highly speculative, best-case scenario.Key Levels to Watch:Support: The descending trendline (currently around 0.12−0.15) and the horizontal support at $0.11705.Invalidation Point: A decisive drop back below the major support level at $0.04207 would invalidate this bullish thesis.
SigmaSignals
WLD/USDT Breakout Pattern: Sam Altman’s Stargate and AI Impact

Analyzing the WLD/USDT 1-day candlestick chart on Binance, an overall downtrend is evident since early 2024, marked by a peak in early March followed by consistent declines, indicating significant selling pressure. A descending triangle pattern formed between late November 2024 and early January 2025, characterized by a horizontal support line around 1.843 and a series of lower highs. The price has broken out of this pattern, currently at 2.372, up 11.47% on the day of observation. A retest of the 1.843 support level is anticipated, with a potential rally towards the 10.613 mark if successful, suggesting a bullish outlook based on technical analysis.Worldcoin (WLD) is a cryptocurrency project that aims to establish a global identity and financial network by utilizing "Orb" devices to scan users' irises, creating unique and verifiable identities. The WLD token serves governance and payment functions within the Worldcoin ecosystem. As a relatively new project, its value is subject to high volatility, a common characteristic among emerging crypto assets.In related news, OpenAI CEO Sam Altman, also a co-founder of Worldcoin, has gained significant advantages through the Trump administration's Stargate AI infrastructure project. Announced on January 21, 2025, Stargate is a $500 billion initiative led by OpenAI, SoftBank, and Oracle, aiming to construct AI data centers across the United States. The project is expected to create over 100,000 American jobs and enhance the nation's AI capabilities. Altman emphasized that Stargate would enable the development of artificial general intelligence (AGI) within the U.S., marking it as a pivotal project of this era.Disclaimer: This is not a financial advise. This analysis is purely for informational purposes and should not be considered as investment advice. Trading involves risk, and you should consult with a financial professional before making any decisions.
SigmaSignals
LADYS Meme Coin Sees Whale Activity: Bullish Breakout Ahead?

The daily price chart for LADYS/USDT reveals significant developments in its technical analysis, suggesting the potential end of a prolonged downtrend and the onset of upward momentum.The price had been consolidating within a falling wedge pattern, a structure marked by converging downward-sloping orange lines. Falling wedges are typically considered reversal patterns, and this case aligns with that narrative. The trend took a decisive turn with a breakout characterized by a prominent "whale candle in hourly timeframe," signifying strong upward movement and increased buying interest.Following the breakout, a retest confirmed the former resistance line as a new support level, reinforcing the validity of the move. This technical confirmation has set the stage for a bullish outlook, with the chart's green box marking a projected price target around 0.000000089121 USDT.Adding further strength to this analysis is the presence of key support zones. The purple-shaded area below the current price acted as a support in earlier price action and remains a critical level for maintaining the bullish structure. Similarly, the falling wedge's former resistance line now serves as an additional support layer.At present, LADYS/USDT is trading at 0.00000007719 USDT. If the bullish momentum continues, it could align with the chart's projection, presenting potential opportunities for traders.Understanding LADYS: The Milady Meme CoinLADYS represents Milady Meme Coin, trading against Tether (USDT). As a meme coin, its value is heavily influenced by social sentiment, online trends, and speculative trading. While the chart suggests technical bullishness, it is essential to note the high volatility typically associated with meme coins.Risks and ConsiderationsThe broader cryptocurrency market's sentiment will inevitably impact LADYS/USDT's trajectory. Traders should approach this analysis with caution, considering both the potential reward and the inherent risks of trading meme coins. Effective risk management, such as setting stop-loss orders and staying informed on market conditions, is crucial for navigating this space.In conclusion the breakout from the falling wedge and the subsequent retest indicate a strong bullish scenario for LADYS/USDT. While the technical setup points toward upward momentum, traders should remain cautious given the speculative nature of meme coins like Milady. Careful planning, thorough research, and a balanced approach are key to capitalizing on the opportunities presented by this chart.Disclaimer: This is not a financial advise. This analysis is purely for informational purposes and should not be considered as investment advice. Trading involves risk, and you should consult with a financial professional before making any decisions.
SigmaSignals
2021 Resistance Broken: 1INCH Eyes Major Bullish Potential

The 1INCH/USDT monthly chart provides a compelling glimpse into the long-term price action and potential future trajectory of the cryptocurrency. The chart captures key market dynamics, highlighting a prolonged downtrend and a recent breakout that could signal the beginning of a new bullish cycle. The overall context suggests that 1INCH has experienced a significant long-term downtrend, marked by a descending white trendline originating from its peak price of 7.3345. This trendline underscores consistent selling pressure and a bearish market sentiment that persisted for an extended period. However, the broader picture also reflects the cyclical nature of markets, with an initial strong rally in early 2021, followed by a protracted consolidation phase, and now the possible emergence of a fresh upward trend. A pivotal development is the recent breakout above the downward-sloping trendline. Such a breakout often indicates a shift in market momentum from bearish to bullish, signaling that the downward pressure may be easing. This breakout is further underscored by annotations on the chart suggesting that the price is “ready for re-test.” This refers to the likelihood of the price pulling back towards the broken trendline to confirm it as a new level of support before continuing its upward trajectory. Retests are a natural and critical component of breakout scenarios, offering traders an opportunity to validate the strength of the breakout. The chart also highlights a projected target price of 7.9266, indicated by a green rectangle. This ambitious target represents a substantial increase from the current price of 0.4005, suggesting the potential for a significant rally if the bullish momentum holds. Additionally, key support levels are identified at 0.3286, 0.2600, and 0.2304, providing important reference points for risk management and trade planning. From a trading perspective, the breakout sets the stage for a bullish outlook, with the re-test offering a potential entry point. Traders might wait for the price to dip towards the broken trendline or one of the identified support levels and observe whether these levels hold as support. Confirmation of support can come in various forms, such as the formation of a higher low or a strong green candle signaling buyer strength. However, trading based on this analysis should include proper risk management. Setting a stop-loss near critical support levels can help mitigate potential losses if the breakout fails or market conditions reverse unexpectedly. Furthermore, traders should remain aware of the high volatility inherent in cryptocurrency markets and adjust their strategies accordingly. It’s also essential to acknowledge that this analysis is based on a monthly timeframe, which means the trends and price movements are likely to unfold over an extended period, spanning weeks or months. While the technical setup appears promising, it’s important to incorporate fundamental factors such as news, project developments, and broader market sentiment to gain a more comprehensive view. In conclusion, the 1INCH/USDT monthly chart reveals a promising bullish scenario with the potential for significant upside, provided the breakout holds and the market aligns with the technical projections. Observing the re-test and confirming the newly established support levels will be key steps in navigating this potential rally. Disclaimer: This is not a financial advise. This analysis is purely for informational purposes and should not be considered as investment advice. Trading involves risk, and you should consult with a financial professional before making any decisions.It seems the real breakout just arrived.
SigmaSignals
XRP’s Bullish Breakout: Is a $100+ Price Target Within Reach?

The XRP/USD monthly chart offers a comprehensive view of its price action, highlighting significant patterns and potential for future gains. This analysis examines the cryptocurrency's historical performance, current trajectory, and the implications of its recent breakout.The monthly timeframe provides a long-term perspective, with each candlestick representing a full month of trading activity. This timeframe is particularly useful for identifying overarching trends and minimizing the noise of short-term price fluctuations. Key levels on the chart include XRP's current price of $3.24, a potential accumulation zone around $0.70, and a long-term price target of $131.Historically, XRP's price movements have been defined by two primary patterns. The first is a wedge pattern that occurred between 2014 and 2016. This pattern marked a phase of consolidation before the price broke out sharply, culminating in a peak around $3.17. This initial breakout laid the groundwork for the subsequent ascending triangle pattern that has developed since 2017.The ascending triangle is a bullish continuation pattern that features a horizontal resistance line at approximately $3.17 and an ascending trendline connecting higher lows. This formation signals increasing buying pressure and accumulation over time. The recent price movement shows a breakout above the resistance level, suggesting that the pattern is playing out as expected. The projected price target, calculated based on the height of the triangle, points to a potential long-term valuation of $131.The chart highlights two critical zones: the red box and the green box. The red box, located below the ascending triangle around $0.70, represents a potential accumulation zone and serves as a critical support level. Traders often use this area as a stop-loss point to minimize risk. Meanwhile, the green box above the breakout level indicates the potential price projection, with a target near $131.4. Reaching this zone would represent a dramatic upside from current levels.While the recent breakout above $3.17 is an encouraging signal, further confirmation is required to ensure the move is sustained. A consistent upward trajectory beyond the resistance level will validate the bullish pattern and strengthen confidence in the price target. However, achieving this target will likely take a considerable amount of time, as the monthly timeframe suggests a long-term horizon, potentially spanning months or even years.Market sentiment and fundamental factors remain crucial to XRP's future performance. Broader cryptocurrency market trends, adoption developments, and regulatory news can significantly influence its trajectory. Additionally, the volatile nature of cryptocurrency markets means short-term dips are always possible, even within a bullish trend.In conclusion, the XRP/USD monthly chart reveals a promising ascending triangle breakout, signaling the potential for significant long-term gains. With a price target of $131 in sight, XRP could deliver substantial returns for long-term investors. However, careful risk management, patience, and a comprehensive approach that combines technical and fundamental analysis are essential for navigating this opportunity.Disclaimer: This is not a financial advise. This analysis is purely for informational purposes and should not be considered as investment advice. Trading involves risk, and you should consult with a financial professional before making any decisions.
SigmaSignals
Is Bitcoin Heading for $5M? An Analysis Using Fibonacci Channels

The report covers Bitcoin's price movements from its inception in 2012 to January 2025. By employing a logarithmic scale, percentage-based changes over time are emphasized, making it easier to identify growth trends and long-term movements.Fibonacci ChannelThe Fibonacci channel serves as the primary tool for identifying potential support and resistance levels. The parallel lines of the channel are spaced according to Fibonacci ratios and applied to price action to predict future movements. The report highlights that the current price ($101,419) is approaching the upper range of the channel.Price TargetsThe analysis proposes three speculative price targets for Bitcoin based on the Fibonacci channel:Conservative Target: $271,117Moderate Target: $1,357,044Aggressive Target: $5,045,505These levels are plotted at the upper bounds of the Fibonacci channel, reflecting potential resistance zones in the long-term trajectory of Bitcoin.Bullish Long-Term PerspectiveThe upward slope of the Fibonacci channel confirms the long-term bullish trend of Bitcoin. The fact that Bitcoin has maintained its position within this channel for over a decade strengthens its technical validity. The proximity of the current price to the channel's upper bound suggests potential volatility in the near term, with possibilities of either a breakout or a correction.Price Target FeasibilityWhile the speculative targets indicate optimism, their exponential nature should be viewed with caution:Conservative Target: Plausible within a long-term context if Bitcoin's adoption and market dynamics sustain growth.Moderate and Aggressive Targets: These levels assume substantial market capitalization expansion, requiring significant adoption, institutional interest, and macroeconomic conditions conducive to growth.Critical ConsiderationsTechnical vs. Fundamental FactorsThe analysis is purely technical, overlooking fundamental elements such as:Adoption rates (e.g., Lightning Network growth, institutional investment).Regulatory developments (e.g., government interventions, taxation policies).Macroeconomic factors (e.g., interest rates, economic stability).These factors could significantly influence Bitcoin's trajectory.Volatility and RiskBitcoin's notorious volatility makes long-term projections uncertain. Historical data reveals frequent deviations from expected patterns, meaning Fibonacci-based targets might not materialize as anticipated.Logarithmic Scale and Weekly TimeframeThe logarithmic scale provides a useful perspective for long-term percentage changes but may obscure short-term fluctuations. The weekly timeframe reinforces a macro view, but short-term traders may find limited actionable insights.ConclusionThe report presents a compelling long-term bullish case for Bitcoin, using the Fibonacci channel to project speculative price targets. While the technical analysis is insightful, reliance solely on Fibonacci levels is risky in a highly volatile market like cryptocurrency. Investors should supplement this analysis with fundamental insights and remain cautious of speculative targets.This analysis underscores Bitcoin's potential for growth but also highlights the need for diversified strategies and vigilance in navigating the dynamic crypto market.Disclaimer: This is not a financial advisor. This analysis is purely for informational purposes and should not be considered as investment advice. Trading involves risk, and you should consult with a financial professional before making any decisions.
Disclaimer
Any content and materials included in Sahmeto's website and official communication channels are a compilation of personal opinions and analyses and are not binding. They do not constitute any recommendation for buying, selling, entering or exiting the stock market and cryptocurrency market. Also, all news and analyses included in the website and channels are merely republished information from official and unofficial domestic and foreign sources, and it is obvious that users of the said content are responsible for following up and ensuring the authenticity and accuracy of the materials. Therefore, while disclaiming responsibility, it is declared that the responsibility for any decision-making, action, and potential profit and loss in the capital market and cryptocurrency market lies with the trader.