
Shepherd_Investor
@t_Shepherd_Investor

What symbols does the trader recommend buying?
Purchase History
پیام های تریدر
Filter
Shepherd_Investor
Bitcoin to $100K

Overview Bitcoin is the best litmus test for the crypto market. Whenever I can't get a read on a particular token, I refer back to Bitcoin. After reviewing the chart I believe Bitcoin is on route to $100K. Honestly, I wouldn't be surprised if it rockets pass this price and hits the next key Fibonacci level around $150K but that is months down the line. For now I'd like to stick with a March '24 prediction. Trading Patterns Bitcoin appears to be setting up for an Inverse Head & Shoulders or a Cup & Handle pattern. While both are bullish signals it does imply there will be a temporary dip in the price before further buying volume ensues and takes it to new highs. Scenario 1 (Inverse H&S) An Inverse H&S could result in a correction back to $35K-42K if it comes to fruition. Scenario 2 (Cup & Handle) A Cup & Handle could result in a correction to the same range with a more likely price target near 42K. Supporting Theory You may be wondering what the white vertical line is in both of the trading pattern scenarios. It marks the next FOMC meeting which occurs on 19-20 March 2024. I believe a significant correction is going to occur within the equity market following this meeting and while its timing in relation to the development of these trading patterns could be coincidental, I believe it supports the idea that the crypto market may also experience a drawback. Now I think it goes without saying that I don't believe these corrections will be a market reversal back into a crypto winter. I just believe the FOMC is going to finally make changes regarding the Fed Rates and that, when it does, regardless of whether they are increased or decreased the large investors are going to withdraw for two reasons: 1) Realize profits 2) To get a feel for the direction of the market moving forward Once the second condition has taken place then I believe both the equity and crypto markets will continue their rallies as the "whales" reinsert their liquidity. March Price Prediction Everything aside, I believe Bitcoin will continue to grow for the next week or two. While there is not much room left before the prior trading patterns would need to see a correction, I believe that Bitcoin could reach 69K before the next FOMC meeting.
Shepherd_Investor
Pepe: Bull Run Price Target ($0.000059)

Overview Pepe is one of those speculative assets that I treat like a first date. I go in with the hopes that it could be an absolute winner but my expectations are that it will be a bust. Because of this I couldn't invest too heavily in the up and coming meme coin but I could invest just enough that if I lost it, I wouldn't be bothered. But if it becomes a winner then my insignificant investment just became a significant gain. Let's crunch price targets. There's not many technical indicators that I feel are reliable enough to go off of so I am solely using Fibonacci retracement levels and theoretical market caps. As the anticipated crypto bull run begins to warm up, it's a good practice to begin setting price targets so that when the market cools again all of those gains don't get flushed down the drain. With any bull run, especially in the crypto market, it's not a matter of IF but WHEN the rally will end. At a token price of $0.000011375 the market cap would be a measly $4.7B which is practically nothing to an established cryptocurrency. This price level reflects the 2.618 Fibonacci retracement level. Further climbs would need to be supported by significant volume but let's continue forward as if those requirements have been met. At a market cap of $25B, the Pepe token value would be $0.000059 which is a whopping 1,375% gain. In crypto, this isn't unheard of. While I'd like to keep running numbers with growing market caps, I don't want to feed into FOMO which is extremely present during rallies so I will leave the cap at a $25B ceiling. This means that a theoretical investment of $100 at today's value ($0.0000040) would be worth $1,475 if Pepe can maintain its steam to the $25B market cap. As I said before, I treat Pepe like a first date. I don't invest too much into it but just enough that I maintain the opportunity of being pleasantly surprised.
Shepherd_Investor
Shiba Inu: Bull Run Price Target (0.000145)

Overview In the last couple months my attitude towards crypto has gone from swing trading it to just holding it, especially with the much anticipated Bitcoin halving event approaching next month. In the past, strong crypto bull rallies occurred within the months following the halving events which leads me to believe that our favorite cryptocurrencies could be hitting record highs by the end of 2024. Shiba Inu Price Target If the bull market continues then a price target near 0.00014559 appears to be a healthy time to take profits. I found this price level through the use of Fibonacci retracement levels. However, Shiba Inu has been around longer than the attached TradingView chart suggests so the correct Fibonacci levels may vary. To make up for the lack of historical price data, I put the bottom Fibonacci level as close to zero as possible. There are several key areas of resistance that Shiba will need to push through before a price target near 0.00015 can be considered practical. I believe that if the token's value can exceed its 61.8% Fib Level at 0.00005570 with growing volume then the target may only be a few months away. At the 0.00015 price level the market cap for Shiba Inu will be around $82.5 billion so as this price level is approached it would be wise to reassess market sentiments so as to avoid pulling out too soon. It is my opinion that a $250 billion dollar market cap is not unreasonable for a successful token, but it is a bit of a stretch and holding too long could result in losing unrealized profits if the market cools. At the $250 billion market cap, Shiba Inu's price would be around $0.00045. Technical Indicators Volume on the 1D chart supports bullish momentum as the breakout is occurring alongside significant, increasing volume and the On-Balance Volume indicator reveals that buying pressure has surpassed prior highs.
Shepherd_Investor
AMZN to $188
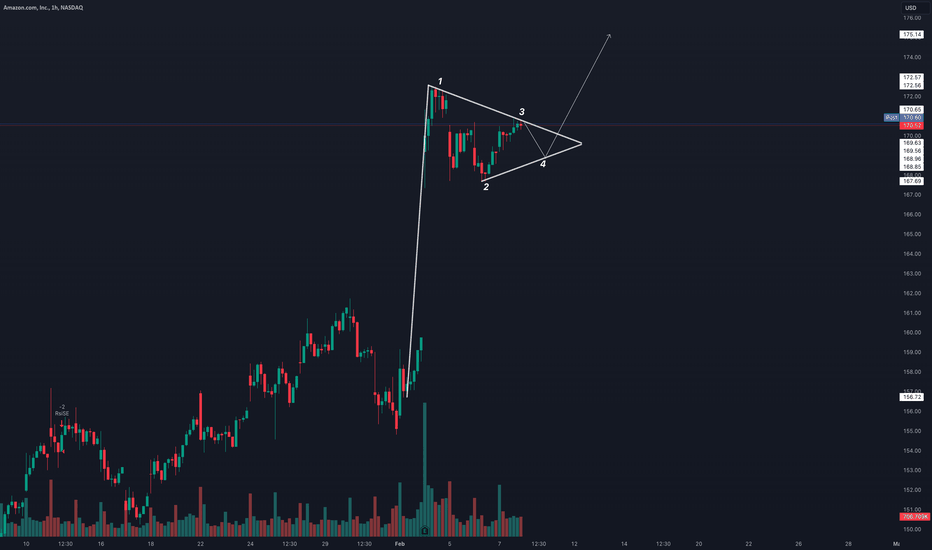
1HR Chart Amazon ( AMZN ) has developed a bullish flagpole formation that is more easily seen on the hourly charts. This may serve as a continuation pattern that will launch AMZN to a 52 week high of $188 -- a level that hasn't been tested since July of 2021. Fibonacci retracement levels for the current trading pattern support the $188 ceiling as this value rests near the 168.1% level. On-Balance Volume (OBV) has a positive slope which suggests that bullish investors are outpacing the bears. I also recently began using the Relative Strength Index (RSI) and Moving Average Convergence/Divergence (MACD) indicators. While my experience with RSI and MACD is limited, the RSI appears to be approaching a bearish crossover before the MACD crosses above its signal line. I interpret this as a possible correction to the pennant support line (the 4th leg) with a near immediate recovery. 1D Chart A share price in the $180s should be carefully watched as this level has been a significant area of resistance in the past. As tempted as I am to suggest it may be forming a double top, the middle trough dipped too low and it appears that AMZN may be trading in a horizontal channel. If AMZN surpasses the $188 price ceiling with significant volume then a 12 month price target of $250 is pragmatic. Should the opposite occur then a 12 month target of $80 could also be expected.Ascending channel in progress. On several time charts, MACD is about to cross its signal line from above which is a bearish signal. Possible low of $170.60 before future movements can be accurately projected.It is now a possibly good time for Puts as AMZN appears to be on course for a correction to the ascending channel support line, approximately $162.50. 1D chart reveals more significant, bearish signals: RSI has a negative slope and is beneath its MA line while MACD shows an approaching cross from above.
Shepherd_Investor
GOOGL to Low $100s?
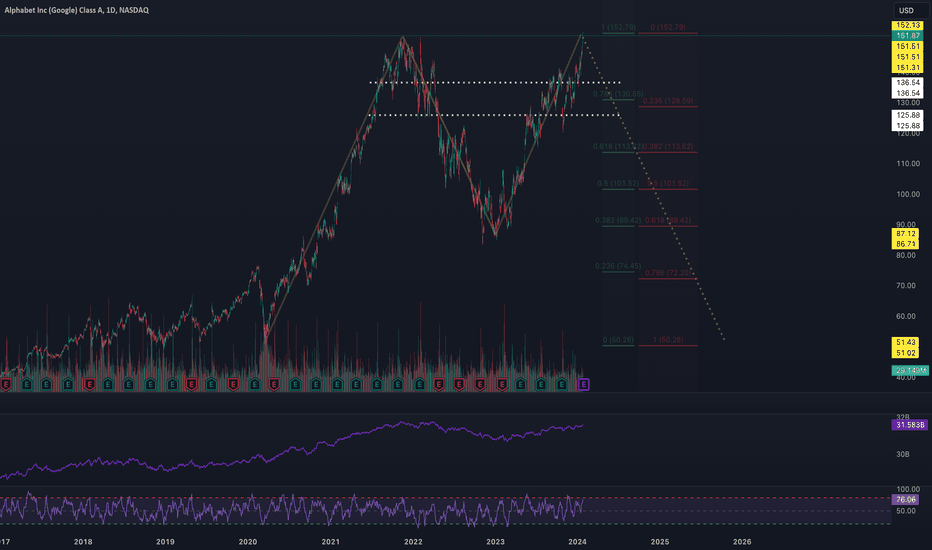
Overview Google ( GOOGL ) is in the dangerous territory of a double top formation. I've discovered this same macro-pattern with a few other assets as well. In combination with a rise in long-term Treasury Yield Curve rates since December 2023, I think a rush of selling pressure could be around the corner. Technical Analysis Utilizing Fibonacci retracement levels along with historical supports & resistances, the $126-136 range appears to be a key level in the share price. The double top formation is a bearish reversal pattern that resembles the letter "M" and, when valid, the second peak is greeted with significant selling pressure. According to technical indicators GOOGL is beginning to reveal the symptoms of a bearish reversal. The share price has risen on dwindling volume, Money Flow Index (MFI) is approaching overbought territory, and the On-Balance Volume (OBV) is still under a ceiling created in March 2022. A rising wedge is also visible on the hourly charts with a micro Head & Shoulders in development. Should a high volume breakdown occur then I believe a price target range between $109-126 is probable, however, I am expecting adequate support around $126 as it correlates with both a 61.8% Fibonacci level and has history as a key area of support & resistance. Speculations Earnings season is a great time to profit from derivative trading, however, it can also be more treacherous due to the volatility most stocks experience in the days leading up to and immediately following their Quarterly Releases. Because GOOGL is having their Earnings Call in the next few days, I would not be surprised to see sharp price movements in either direction regardless of the current trends. Concrete stop-losses and price targets should be determined before entering any positions.Heavy insider liquidation. Micro double top pattern formation within rising channel. Overbought signals on 4H and 1D chart. GOOGL appears to be nearing a turning point where it will begin a downward trajectory to the support of the current rising channel. This support level is also a 50% Fib level so a potential recovery should be closely watched. If support at the $138 level fails, then a price target between $120-127 is reasonable.
Shepherd_Investor
ApeCoin: Double Bottom

Overview I recently cancelled one of my other ApeCoin projections where I believed a Three Hills & a Mountain pattern was forming. The second hill became a head and now a bearish Head & Shoulders is in progress. However, I am still bullish on the token because if the H&S is valid and the price is rejected back to $1.00 then this could become a setup for a medium-to-long term double bottom formation. Head & Shoulders The H&S can be seen on both the hourly and daily charts. The right shoulder is currently in development with a descending wedge that may squeeze the value back up to a resistance around $1.55. Should the ceiling be strong enough to extinguish any momentum that APEUSD may garner then a correction back to $1.00 is probable. However, if support is significant enough at this $1.00 level then this will become the second leg for the double bottom pattern. Double Bottom Projection There will be plenty of noise in-between that will facilitate short-term trades but I believe a price target near $6 is practical. This is near the same price target of a macro-Cup & Handle projection that I published a few weeks ago.
Shepherd_Investor
S&P500: Moving to the Dow
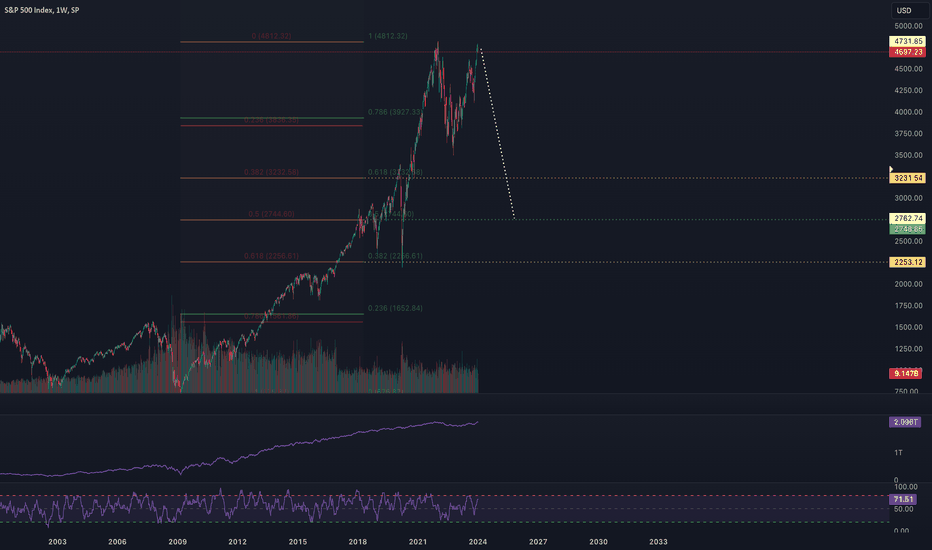
Overview I decided it was time to start taking control of my own retirement account. For years my account has been pulling in mediocre gains and the only reason I've put up with it for so long is because: 1) it took me years to hone my trading skills and 2) my employer matches my contributions. Well, after reviewing my available fund allocations and performing a quick technical analysis of the respective funds, I decided to pull completely out of the S&P500 ( SPX ) and placed them into the Dow Jones ( DJI ). Technical Analysis SPX A double top has appeared on the 1W chart. Combined with dwindling volume on top of increasing value, I think it's ready to fall. Utilizing Fibonacci retracements I believe a good time to re-enter the S&P 500 will be in the range of $2200-$3200 USD. DJI While it is still slightly early to confirm, it appears that the Dow Jones has escaped the double-top and in my opinion looks coiled up and ready to spring. Utilizing Fibonacci retracement levels -- supported by increasing volume with rising value -- $56.8K appears to be a practical price target.
Shepherd_Investor
Bitcoin: Quick Breather

Speculations I believe Bitcoin is coming due for a "steep" correction but not in an unload your wallets and get out of the game kind of way. It has rallied hard over the last few months and despite experiencing significant increases in value, Bitcoin's volume has slowly dwindled. It is for those reasons and -- more in the following paragraph -- that I believe Bitcoin will most likely see a drop to around $35K. Trend Analysis On the 1D and hourly charts, I have drawn out a symmetrical triangle (yellow) that envelops the $35K support which rests around the 61.8% Fibonacci retracement level. I utilized Fib retracements in both the up and downtrends to find what I believe will be a reasonable bottom; the downtrend Fib levels place 61.8% too low in my opinion. Bitcoin's current value is consolidating within a smaller symmetrical pennant (white) and appears to be on the verge of breaking down. Using the volume indicators and Fibonacci levels to support my theory, I believe that selling pressure will increase as we approach the Bitcoin ETF decision. I think that many traders will exit their positions out of fear of an ETF rejection which will cause a cascade to the 61.8% Fib level. Speculative Projections Because of the crypto market's overall bullish sentiments, I feel comfortable projecting a double bottom pattern that may develop within the symmetrical triangle. However, once an ETF decision has been made I don't believe the current patterns will remain valid. I am expecting that there will be a premature breakout or breakdown at this time.Bitcoin has broken out of the symmetrical pennant and triangle that is shown on my original idea but I still believe a correction is coming. I can't stress it enough that I am bullish on Bitcoin in the long-term so this is not coming from a place of bias. The volume is still decreasing while Bitcoin's price rises. This is what leads me to believe Bitcoin will experience a sharp correction.- Double top formation on the hourly charts - Volume within pennant has decreased suggesting a false breakout - Potential correction back to $35K is still probable
Shepherd_Investor
SHIB: Three Hills & a Mountain

Findings I believe I have discovered a Three Hills & a Mountain pattern on the SHIB hourly and daily charts. I recently posted about the same formation on ApeCoin which gives me the impression that certain altcoins are experiencing similar trading activities while Bitcoin consolidates. Bitcoin appears to be on the brink of a correction which could bring us to the 61.8% Fibonacci level where significant buying pressure should occur and begin developing the third hill. APEUSD Three Hills & a Mountain Publication https://www.tradingview.com/chart/APEUSD/2N72pW5c-ApeCoin-3-Hills-a-Mountain/ Trend Analysis Both of the proposed hills are of unequal magnitude which is why I do not believe this is a Three Drives pattern. While there was a brief decline beneath the 61.8% level before forming the second hill, the drop was insignificant and stayed in close proximity. On the 1W chart there is a Double Bottom "W" pattern forming which I have detailed in an earlier publication a few weeks ago; the Three Hills and a Mountain supports the W projection as the price target is around 0.000016. W Pattern Publication The volume is rising with increasing values and the succeeding hill has increasing volume as well, indicating bullish momentum. Should the pattern keep up I believe we will see a large spike in volume within the first half of the third hill. SHIBUSD https://www.tradingview.com/x/YXnNSq3g/The second hill has finally completed.The value of SHIB has declined further than I originally anticipated, however, I am not too concerned. After reviewing the 1D chart I believe the token is still on track for a Three Hills and a Mountain pattern. The supporting indicators are as follows: - Dwindling volume with decreasing value (suggests the current trend is temporary) - Money Flow Index (MFI) is approaching oversold territory
Shepherd_Investor
ApeCoin: 3 Hills & a Mountain

I believe I've identified a potential Three Hills & a Mountain pattern on ApeCoin's hourly and daily charts. At the time of this idea --- and should my projection be correct -- we are beginning the transition to the third hill. The supporting evidence for my idea is the following: 1) Both of the completed hills declined to, or near, their 61.8% Fibonacci levels as is consistent with the Three Hills & a Mountain pattern. 2) While they appear similar, both completed hills are of different magnitudes which separates itself from the Three Drives pattern. I made a crude projection for the third hill and price target by using downtrend Fibonacci levels (in red) to identify a 61.8% level between the first and second hill. The purpose of this level is to identify a potentially strong support that would ultimately lead to the rally of the Mountain. It is my understanding that the Mountain rallies at a magnitude equal to the lowest and highest value of the Three Hills which in this case would be $1.292 (indicated in white). Assuming this is correct, a rally of this proportion would bring us to a target price around $2.770. APEUSD https://www.tradingview.com/x/BizkGUwV/The second hill has finally completed.The value of APE has declined further than I expected and is potentially setting up for a head and shoulders pattern. After reviewing the 1D chart I believe the token's current decline won't last much longer, however, I will be remaining cognizant of significant resistance around the $1.50 range as this could confirm a H&S. Key indicators: - Dwindling volume with decreasing value (suggests the current trend is temporary) - Money Flow Index (MFI) is approaching oversold territory - Recovery to the $1.70 range could confirm that APE is back on track for the 3 Hills & a MountainI no longer believe that APE is following a Three Hills & a Mountain pattern. The second hill's support failed and it appears that a Head & Shoulders pattern is forming. Fortunately I believe this is just one step back to take two steps forward. On a macro-level, a valid H&S would facilitate the development of a double bottom which is very bullish. Should APE meet significant resistance around the $1.55 level over the next week or two, a breakdown back to $1.00 is probable. I will be watching for significant support at this level.
Disclaimer
Any content and materials included in Sahmeto's website and official communication channels are a compilation of personal opinions and analyses and are not binding. They do not constitute any recommendation for buying, selling, entering or exiting the stock market and cryptocurrency market. Also, all news and analyses included in the website and channels are merely republished information from official and unofficial domestic and foreign sources, and it is obvious that users of the said content are responsible for following up and ensuring the authenticity and accuracy of the materials. Therefore, while disclaiming responsibility, it is declared that the responsibility for any decision-making, action, and potential profit and loss in the capital market and cryptocurrency market lies with the trader.