
Scaling_mastery
@t_Scaling_mastery

What symbols does the trader recommend buying?
Purchase History
پیام های تریدر
Filter
رمز ارز ETH: استراتژی همزمان شکست سه خط روند صعودی؛ رمزگشایی بازار!
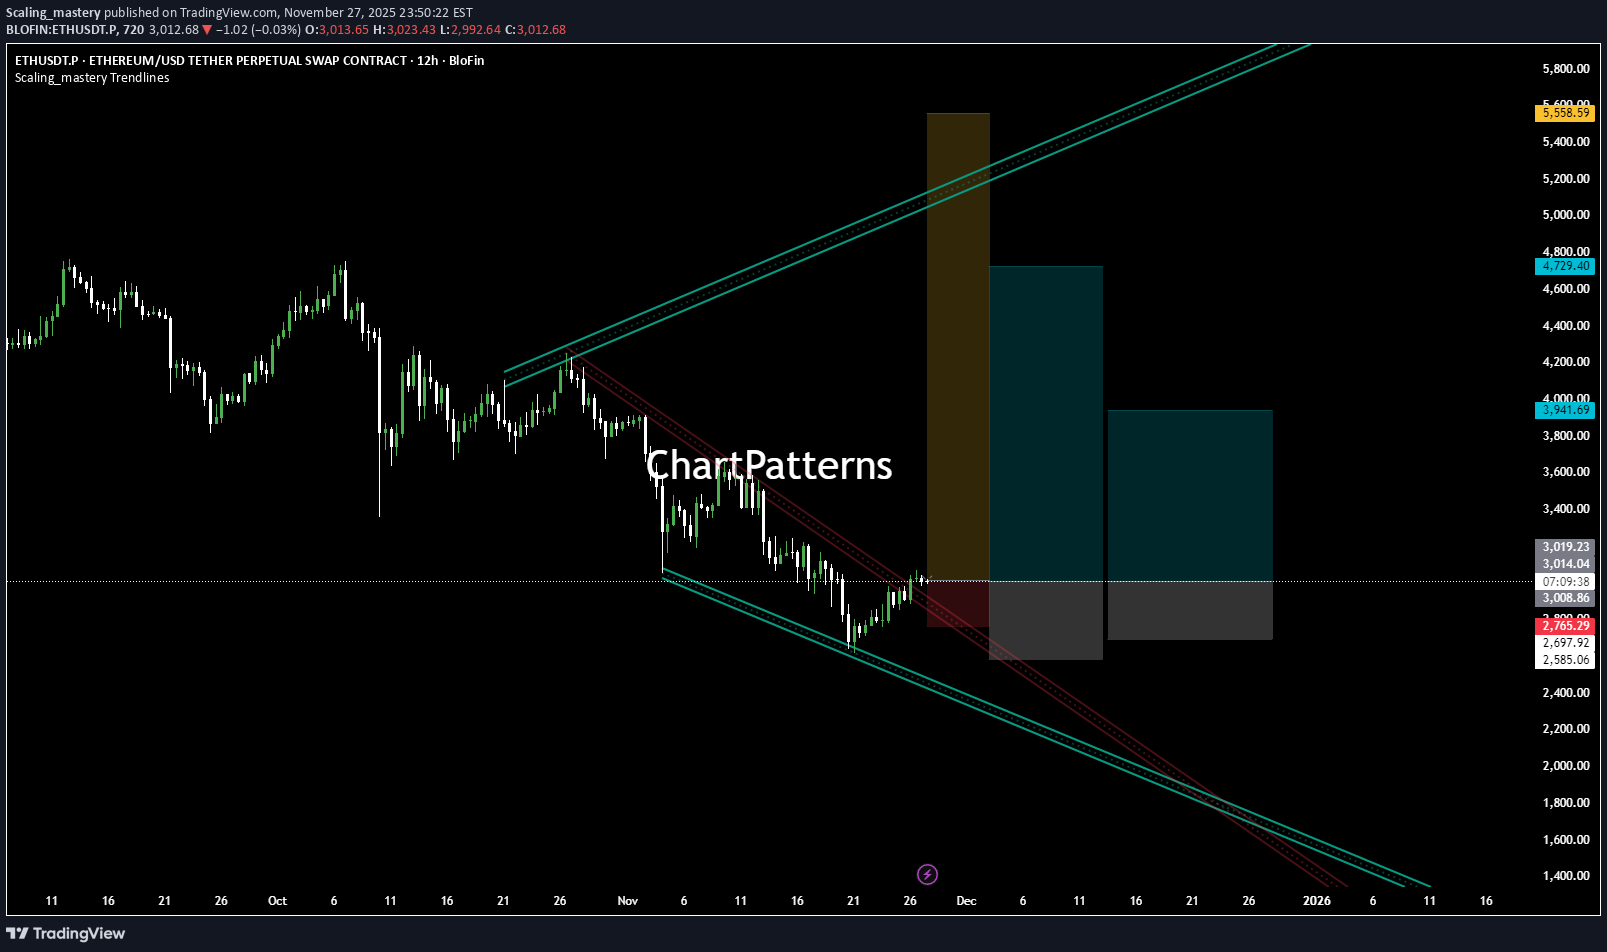
This ETH setup combines three Scaling Mastery setups—the 1/10, 1/4, and 1/3 structures—stacked inside the same region. That alone makes this a high-value educational chart, because seeing all three appear together is rare. 1️⃣ Scaling Mastery Trendlines (1/10 • 1/4 • 1/3 Sets) This chart uses the official Scaling Mastery Trendline System, where each trendline ratio tells you a different part of market behavior: 🟧 1/10 Trendline Shows micro-reaction structure Helps detect early shifts in momentum Usually breaks first and gives the initial signal ETH already broke this one cleanly. 🟦 1/4 Trendline Shows medium-level structure Confirms trend bias and filters false moves ETH is currently retesting/reclaiming this region. 🟩 1/3 Trendline The strongest diagonal structure When this breaks, major HTF direction usually follows ETH is attempting to push into this breakout zone now. Having all three ratios interacting inside the same price zone is extremely valuable because: ➡️ It shows a stacked confluence of momentum ➡️ It forms a “ladder” of breakout confirmations ➡️ It gives a clean model for trend reversal and expansion 2️⃣ Bullish + Bearish Trendlines Forming a Hidden Channel When you overlay: The bearish red channel (recent downtrend) The bullish turquoise macro expansion trendlines …you actually get a dual-channel structure. This means ETH is breaking both: ✔ The bearish downtrend channel ✔ Into the bullish expansion channel At the same time. This is a classic Scaling Mastery visual where bearish and bullish diagonals overlap and create a “channel breakout zone.” ETH is currently reacting inside that zone. 3️⃣ Expected Behavior if Breakout Holds If ETH continues to hold above the 1/10 → 1/4 → 1/3 progression: 🎯 Target 1: $3,941 Mid-channel expansion target. 🎯 Target 2: $4,729 – $4,800 Full expansion to the upper turquoise trendline. This aligns with standard Scaling Mastery expansion rules. 4️⃣ Structure Summary 1/10 broken ✔ 1/4 reclaim attempt ✔ 1/3 test incoming ✔ Bearish + Bullish diagonal confluence ✔ Dual-channel breakout structure ✔ Clear expansion targets to the upside ✔ This is a clean educational example of multi-trendline alignment, a signature technique of the Scaling Mastery system. ⚠️ Educational Disclaimer This idea is for educational purposes only. It is not financial advice or a trade signal. Always analyze your own charts and manage your own risk.
آیا ریپل (XRP) در آستانه یک تغییر بزرگ و تاریخی است؟ تحلیل ساختار ماکرو
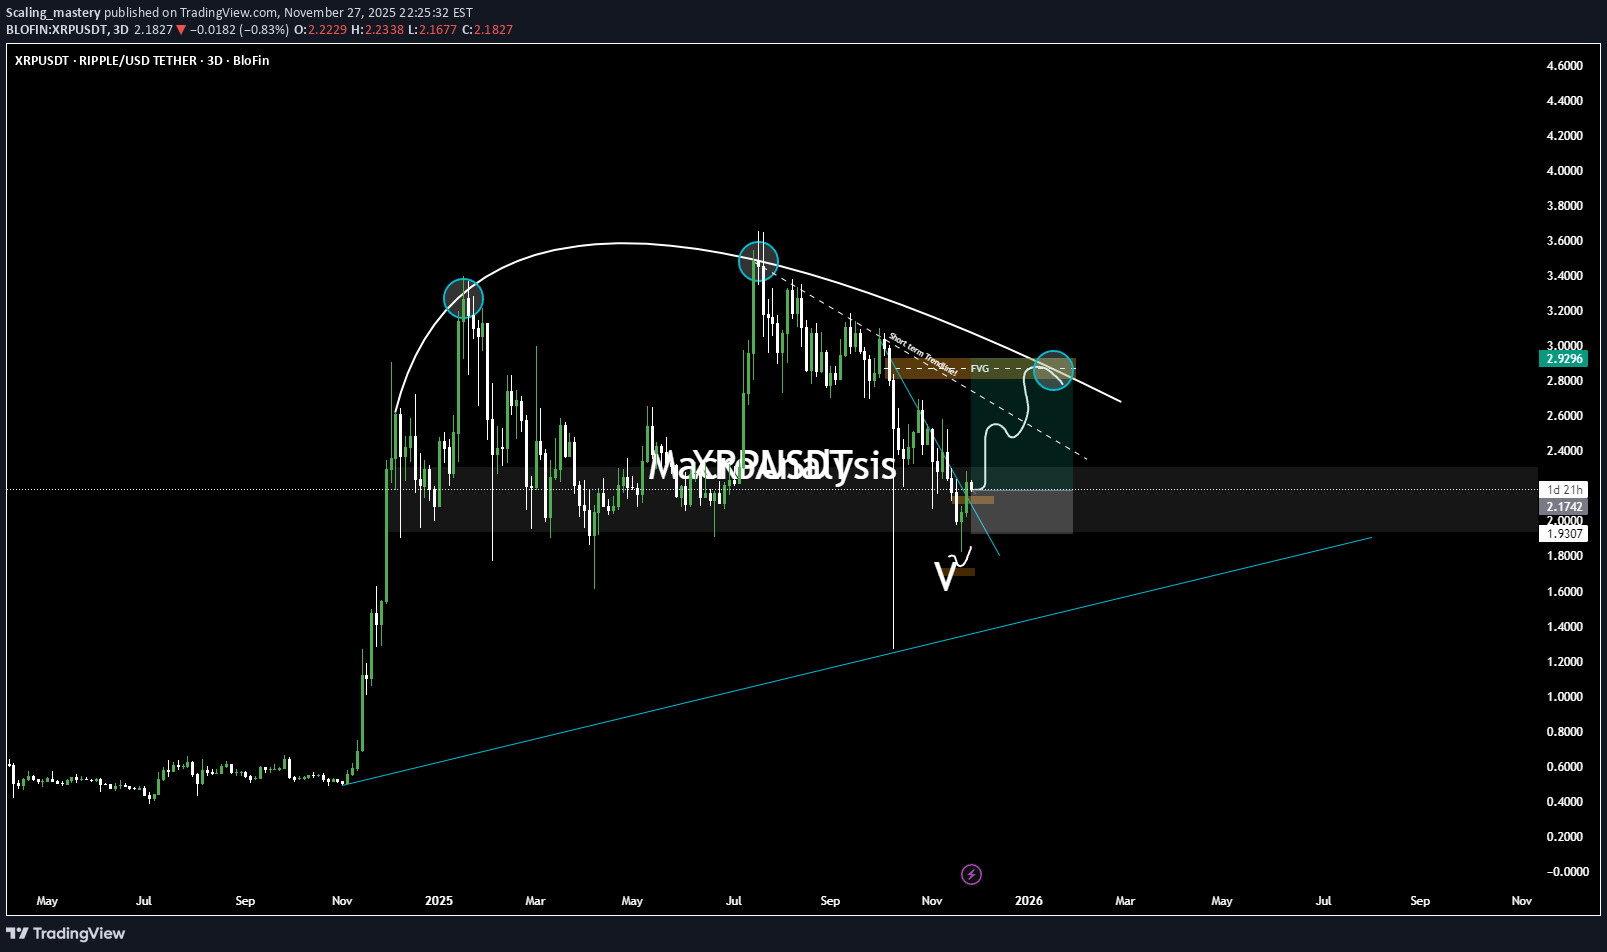
XRP is completing a long-term structural pattern that has been developing for months. This setup includes a rounded top distribution, a full breakdown into major demand, and a potential reversal structure forming at the bottom. This idea outlines both bullish and bearish pathways based on higher-timeframe confluence. 🔍 1️⃣ Rounded Top Distribution Completed XRP formed a clear rounded top on the macro chart, with three major distribution points (highlighted). Each point shows diminishing momentum and repeated rejection from the declining macro trendline. This structure typically precedes: Liquidity sweep lower Long accumulation phase Then high-timeframe reversal We’re now entering the second phase. 🔍 2️⃣ Price Now Sitting in Major Higher-Timeframe Demand Price has dropped directly into a large daily/3D demand block that held all previous macro corrections. This zone aligns with: Old imbalance fills Breaker structure retest Long-term ascending trendline below (blue line) This is where macro buyers have stepped in before — and may do so again. 🔍 3️⃣ Bullish Scenario (Blue Path) If price confirms demand strength, the bullish pathway is: Sweep of local V-shaped liquidity Retest of micro trendline (white dashed) Break above the short-term breaker + FVG layer Move toward the $2.95–$3.10 area (macro rejection zone) This is the first major upside target. A full reclaim above this level opens the door for a much larger trend reversal. 🔍 4️⃣ Bearish Scenario (White Path) If demand fails, watch for: Deviation above micro resistance Rejection from FVG / breaker Breakdown of V-swing formation Deeper move toward long-term trendline support below This would create a deeper macro accumulation before any major bullish cycle. 🎯 Summary XRP is at a macro inflection point We have: Completed distribution Full retest of long-term demand Early signs of reversal structure Clear upside targets and invalidation levels This is a high-timeframe educational structure outlook, not a signal. 📘 Disclaimer This post is for educational purposes only and reflects personal market analysis. It is not financial advice or a trade signal. Always DYOR and manage your own risk.
بیت کوین بر سر دوراهی: آیا خط روند میشکند یا سقوط میکند؟ (تحلیل کلیدی سطوح حمایتی و مقاومت)
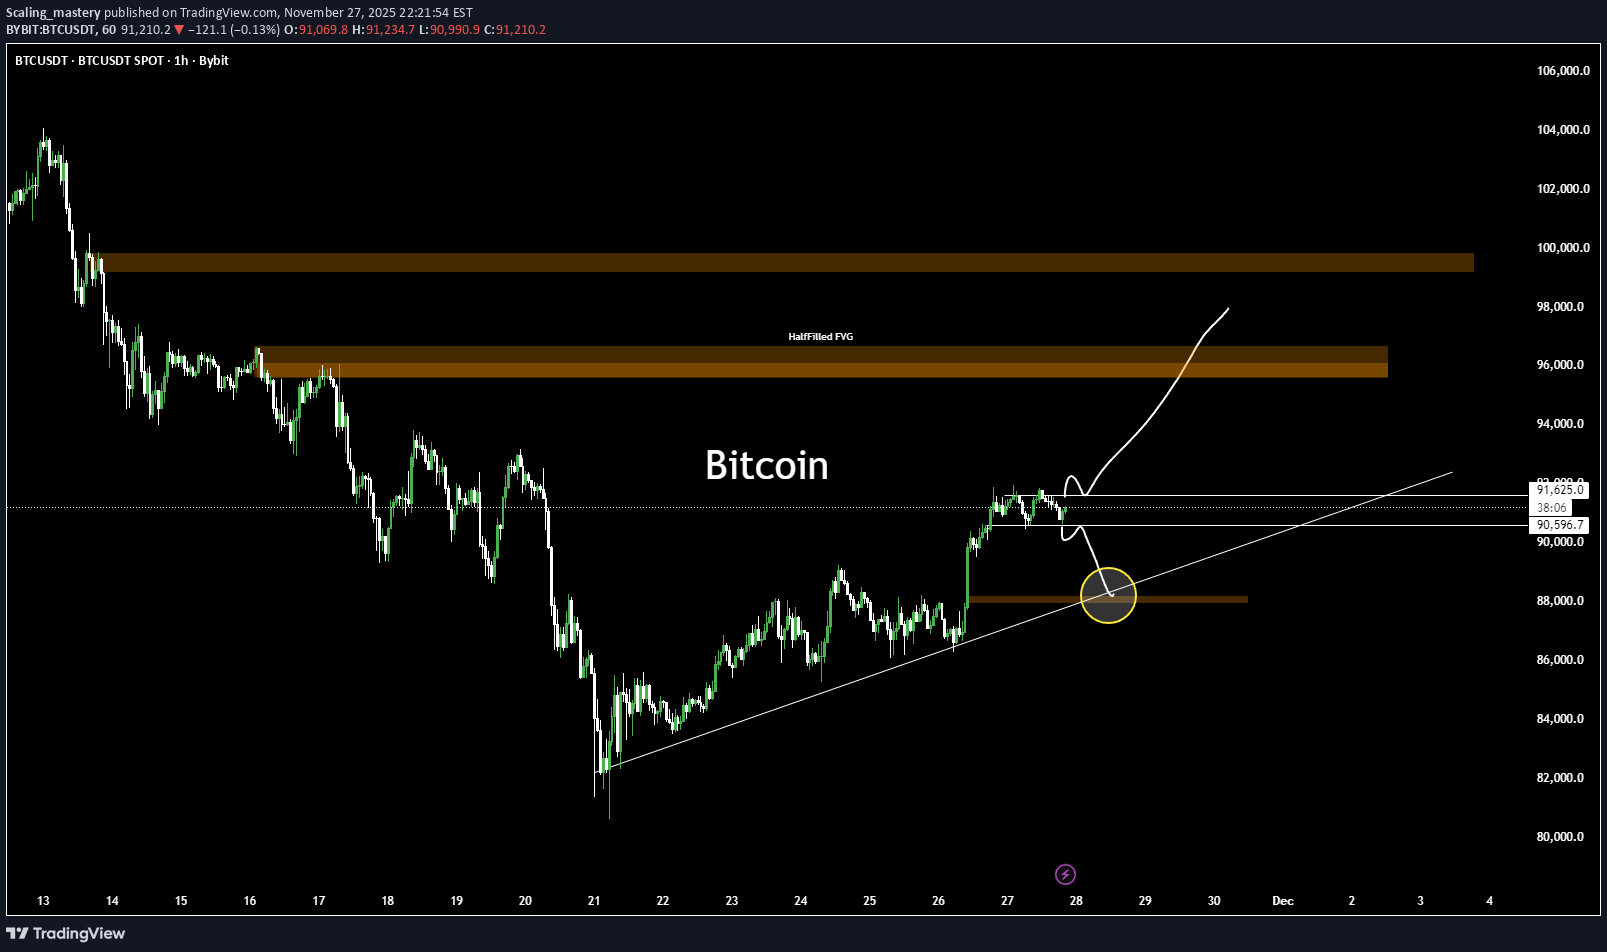
BTC is approaching a key structural decision point, and the next move will determine whether we see continuation upward or a corrective sweep to lower liquidity levels. This idea outlines both scenarios with clear targets and educational structure analysis. Key Structural Areas 1️⃣ Rising Trendline Support BTC continues to respect a clean ascending trendline. This line has been a major pivot for the past several days. Price is currently hovering just above it, and the yellow circle marks the confluence of: Rising trendline support A local demand block Prior liquidity sweep zone This is the most important area to watch for reaction. 2️⃣ Short-Term Rejection Scenario (White Path) Before breaking upward, BTC may show short-term downside rejection, targeting: ➡️ Short-Term Target: $88,180 This level aligns with: Demand block retest Trendline kiss Local inefficiencies needing fill A rejection into 88,180 would be normal and healthy before a potential bullish continuation. 3️⃣ Bullish Reclaim Scenario If price taps the rejection zone and reclaims the trendline, upside targets remain: $95,800 – $96,500 → Half-filled FVG + structural supply $99,500 – $100,200 → Major FVG + macro resistance zone These zones are where we expect strong reaction and profit-taking. 4️⃣ Breakdown Scenario If BTC fails the trendline with a full candle close below, expect: Breakdown of structure Full sweep of demand Deeper correction into mid-range levels Not my primary bias, but it's critical to acknowledge the possibility. Summary BTC is sitting on an important trendline. A quick rejection into 88,180 could be the liquidity grab needed before upside continuation. Reclaiming the trendline = bullish continuation toward FVGs. Breaking below = deeper corrective move. 📘 Disclaimer This analysis is for educational purposes only. It represents personal opinion and not financial advice. Always do your own research and manage your own risk.
تحلیل شگفتانگیز FARTCOIN: آیا زمان خیزش بلندمدت فرا رسیده است؟
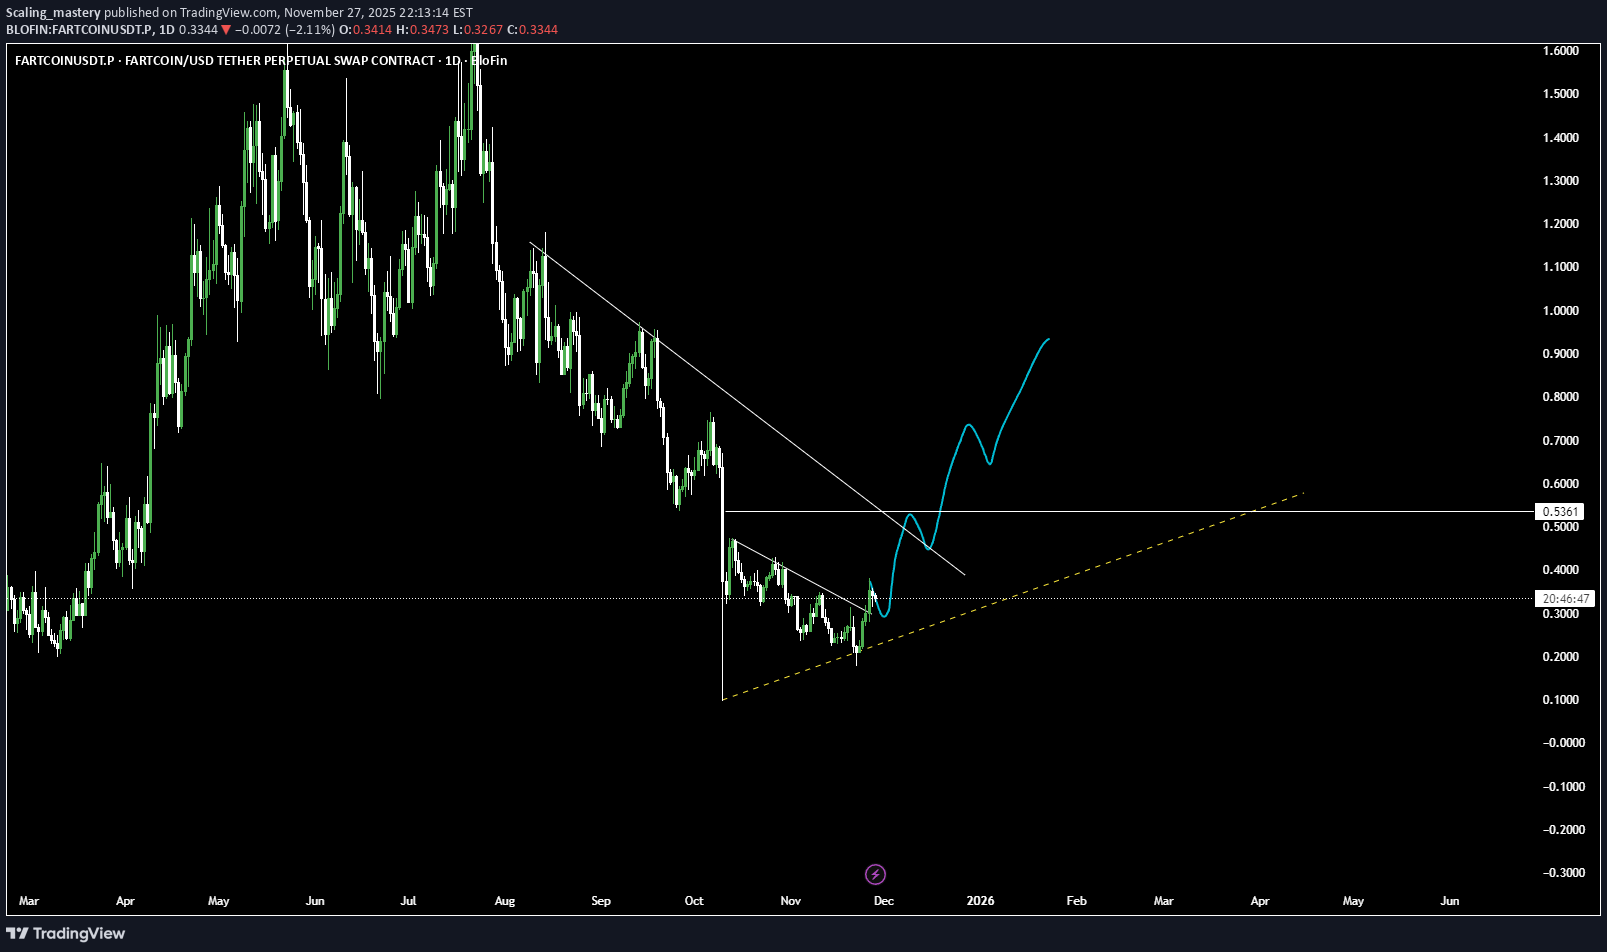
After a long period of compression, FARTCOIN (FART/USDT) is showing early signs of a potential trend reversal on the 1D chart. Price has respected a descending resistance line for months while simultaneously forming higher lows on the ascending yellow trendline — signaling that bullish pressure may be building. Currently, price is testing the intersection point between descending resistance and ascending support, forming what could be a symmetrical triangle breakout setup. If we can hold above the breakout area and reclaim the mid-structure level (~0.40–0.42), the next technical objectives would be: TP1: 0.56 – Retest of prior structural resistance TP2: 0.73 – Measured move from the breakout pattern TP3: 1.00+ – Potential full cycle expansion target ⚠️ Invalidation: A daily candle close below 0.30 would suggest a failed breakout and continuation of the prior downtrend. Educational Breakdown: This setup is designed to teach how trendline confluence + structural compression can reveal early trend reversal zones. Notice how the breakout leg aligns with a swing projection pattern, confirming momentum shift probability. Bias: Directional Bias: Bullish Setup Type: Breakout + Retest (Mid-term swing) Timeframe: 1D📘 Disclaimer (Education Only) This post is for educational purposes only. It is not financial advice. All analysis represents personal opinion, not a recommendation to buy or sell. Always do your own research and manage your own risk.
Disclaimer
Any content and materials included in Sahmeto's website and official communication channels are a compilation of personal opinions and analyses and are not binding. They do not constitute any recommendation for buying, selling, entering or exiting the stock market and cryptocurrency market. Also, all news and analyses included in the website and channels are merely republished information from official and unofficial domestic and foreign sources, and it is obvious that users of the said content are responsible for following up and ensuring the authenticity and accuracy of the materials. Therefore, while disclaiming responsibility, it is declared that the responsibility for any decision-making, action, and potential profit and loss in the capital market and cryptocurrency market lies with the trader.