Saeed966
@t_Saeed966

What symbols does the trader recommend buying?
Purchase History
پیام های تریدر
Filter
Signal Type
Saeed966
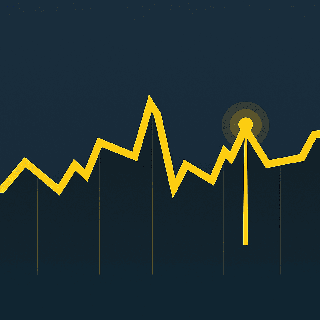
Here is the technical analysis of the gold/US dollar (XAU/USD) pair on the daily timeframe for today, April 18, 2025, identifying key support and resistance levels based on the latest available data: ⸻ 🔹 Current Price: The price of gold reached an all-time high of $3,357.40 per ounce, driven by growing concerns about tariffs, which Federal Reserve Chairman Jerome Powell described as "much larger" than expected, leading to slower economic growth and higher inflation. ⸻ 📊 Technical Analysis (Daily Timeframe): • Overall trend: Upward, with higher highs and lows, indicating continued positive momentum. • Moving Averages: The price is trading above all major moving averages, including the 20-day simple moving average at $3,114.60, supporting the uptrend. • Relative Strength Index (RSI): The RSI remains in the overbought zone, which could indicate a potential short-term price correction. ⸻ 🔻 Key Support Levels: 1. $3,317.20 – Immediate support reflecting a previous high. 2. $3,305.65 – Medium-term support. 3. $3,292.80 – Additional support reflecting a previous consolidation zone. ⸻ 🔺 Key Resistance Levels: 1. $3,335.00 – Current resistance that was recently tested. 2. $3,350.00 – Important psychological resistance level. 3. $3,375.00 – Potential resistance if the upward momentum continues. ⸻ ⚠️ Additional Notes: • Technical indicators are showing overbought signals, which could lead to a short-term price correction. • In the event of a correction, the above-mentioned support levels may be potential entry points for investors. • Upward momentum remains intact, but it is advisable to closely monitor technical indicators to identify appropriate entry and exit points.
Saeed966
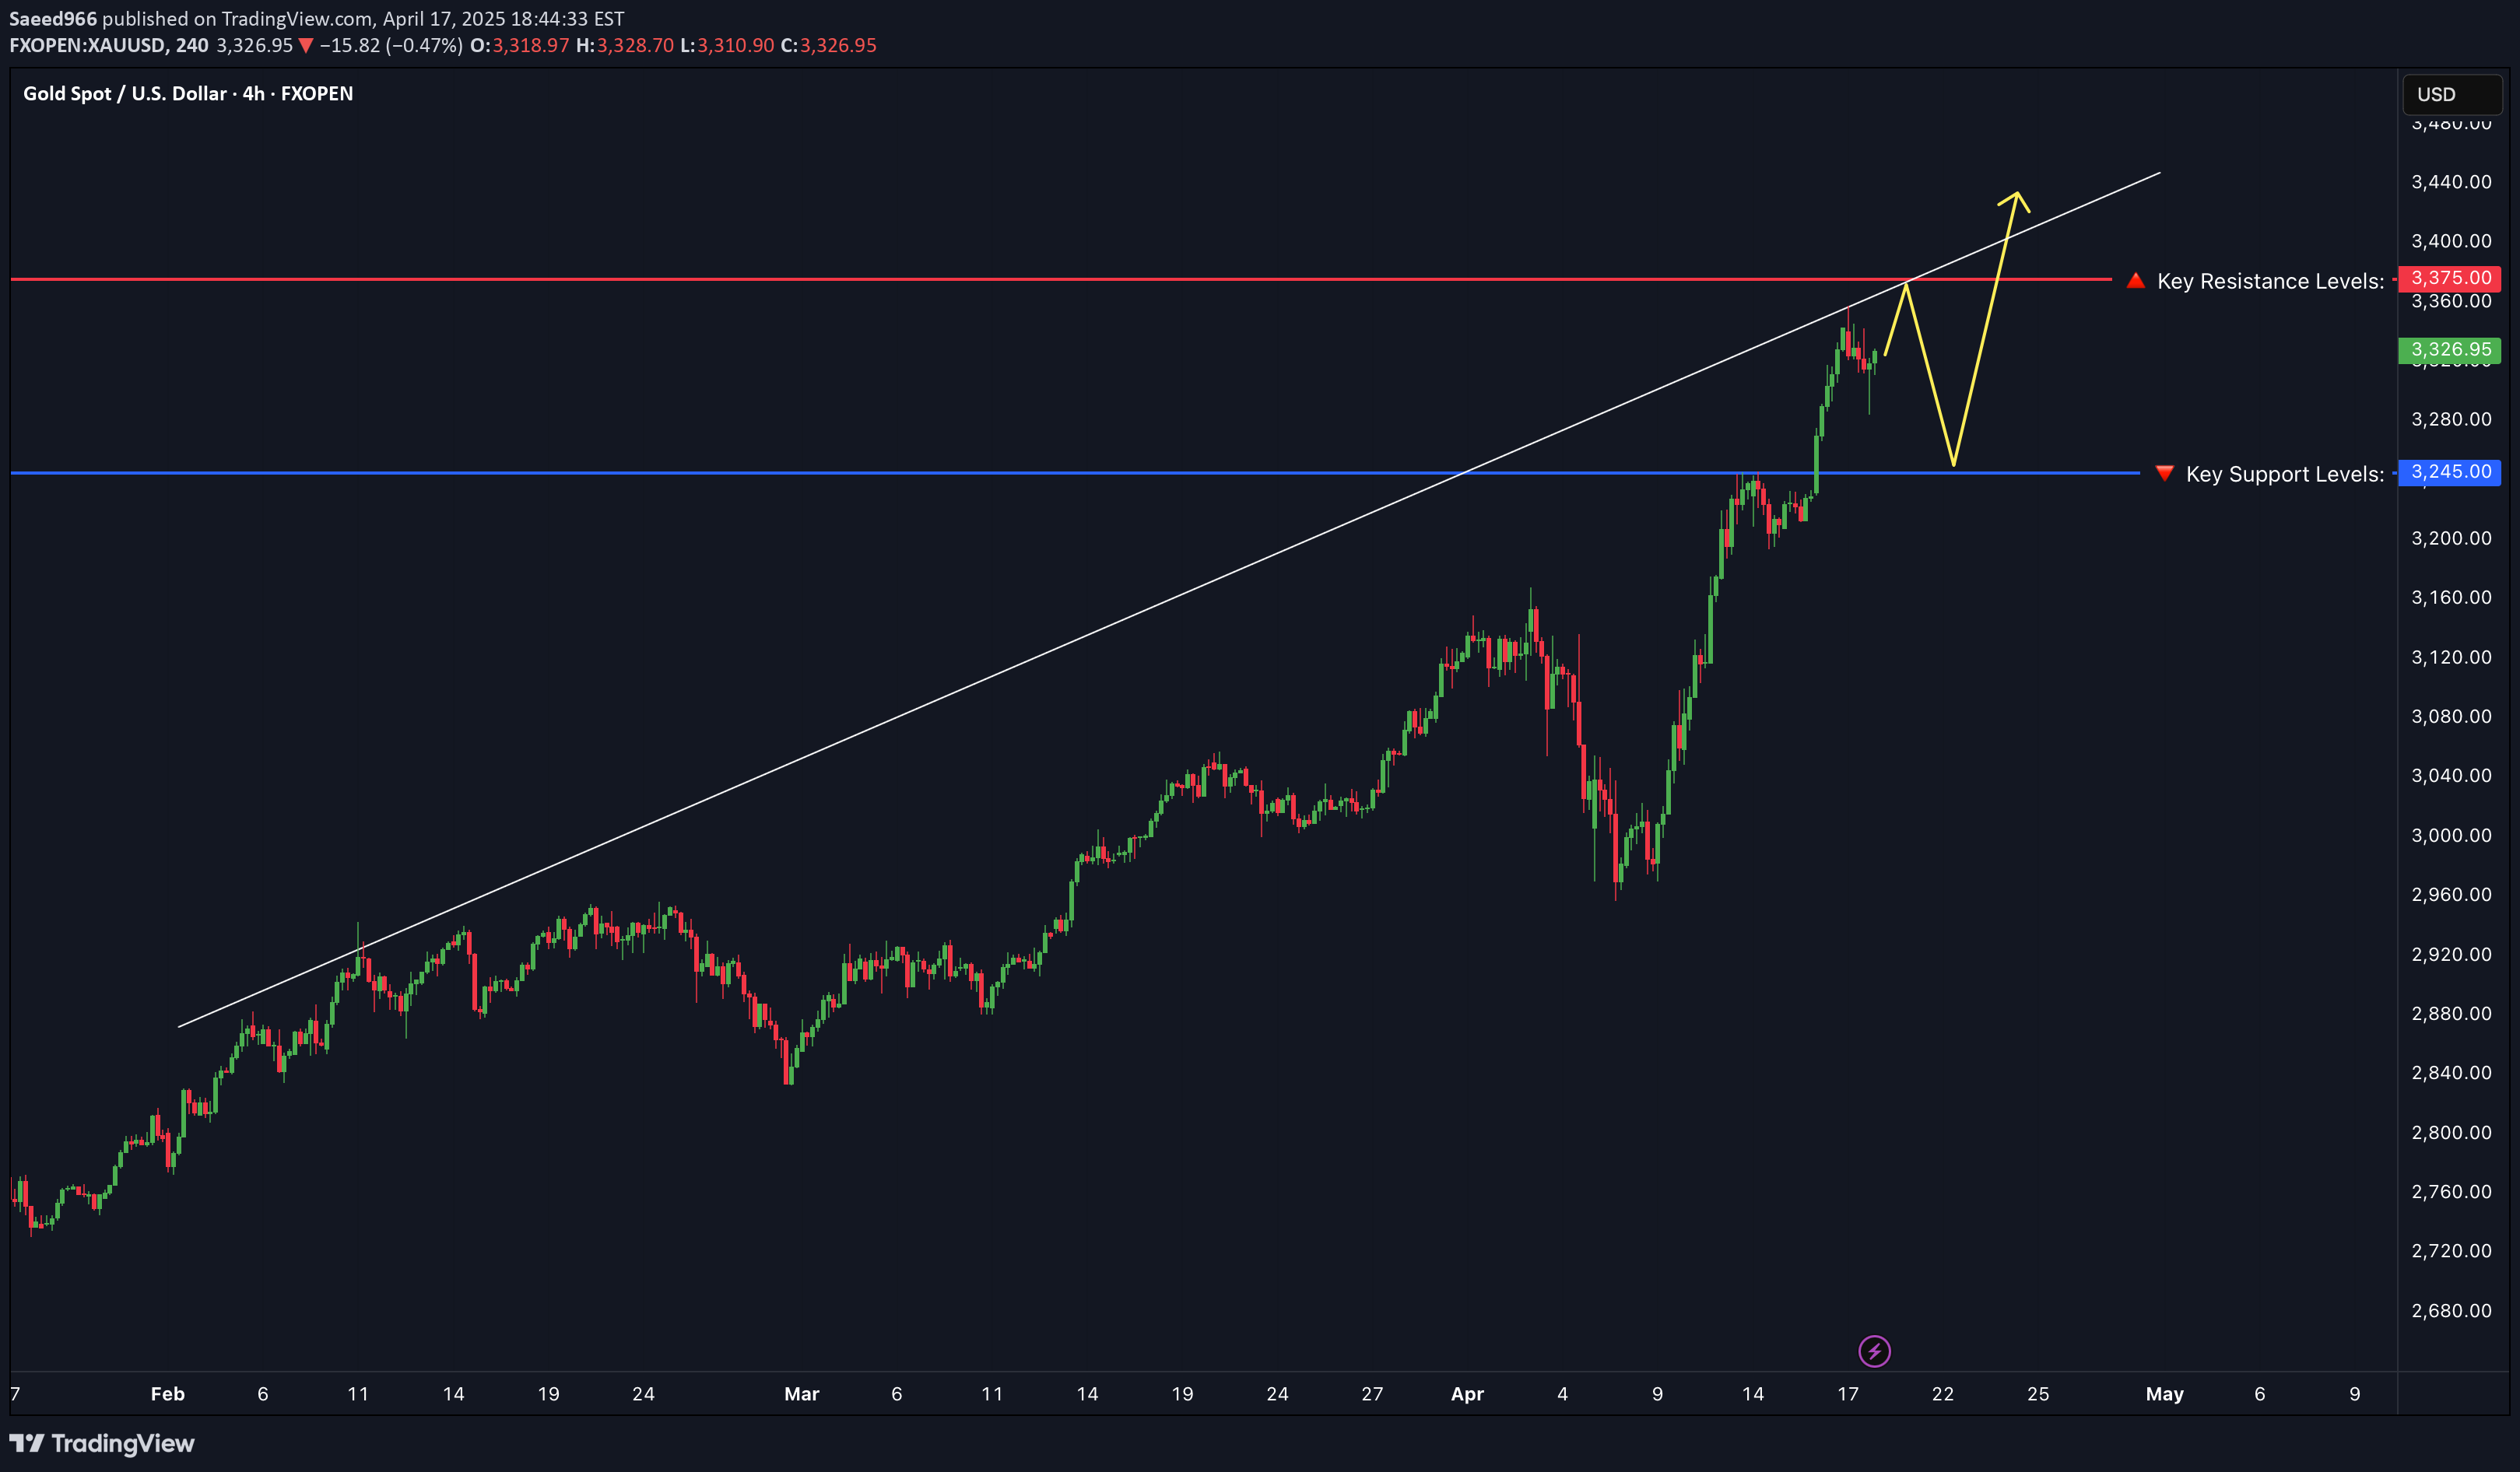
📊 XAU/USD Daily Technical Outlook – April 11, 2025 Gold rebounded strongly during Friday’s session, climbing from early lows around $3,177 to reach a high of $3,237. This bounce followed a brief correction the day before, as buyers stepped back in near key psychological levels. The move was partially driven by ongoing geopolitical tensions and renewed demand for safe-haven assets. At the moment, gold is trading around $3,212, holding its gains firmly into the weekly close. The broader market remains bullish, with the uptrend still intact unless key supports are breached. 📈 Current Market Structure: After Thursday’s pullback, Friday’s strong bullish candle suggests renewed momentum. Price is still moving within an ascending structure, and the sharp recovery could be an early signal of a continuation toward new highs. 🔹 Key Resistance Levels: $3,237: Immediate resistance. Friday’s high. A break above this level could trigger further bullish continuation. $3,280: Potential upside target if momentum continues. $3,300: Psychological resistance and potential long-term target. 🔸 Key Support Levels: $3,177: Intraday support. If gold pulls back again, this level may provide a bounce. $3,150: Near-term support and a key structural level. $3,095: Deeper support, marking the bottom of the previous breakout area. 📐 Price Action Patterns: Friday's bullish engulfing candle signals strong buying pressure, especially after Thursday’s correction. If buyers defend current levels early next week, we may see a bullish continuation. However, failure to break $3,237 may trigger another consolidation phase. 🧭 Potential Scenarios: ✅ Bullish Scenario: If gold breaks and holds above $3,237, this could trigger a move toward $3,280 or even $3,300. Buyers remain in control as long as price stays above $3,177. ❌ Bearish Scenario: If gold fails to push above resistance and breaks below $3,177, we could see a retest of $3,150, and possibly deeper toward $3,095 if bearish momentum increases. 📌 Conclusion: Gold showed resilience on April 11, recovering sharply from a brief dip and closing the week on a strong note. The market structure remains bullish, and a sustained break above resistance could lead to fresh all-time highs. Traders should continue to monitor geopolitical news and dollar strength for clues on short-term direction. 💬 What’s your take on gold heading into next week? Will bulls take control again, or are we in for more consolidation? Drop your thoughts below! Let me know if you want a version ready for TradingView or with hashtags and emojis for social media!
Saeed966
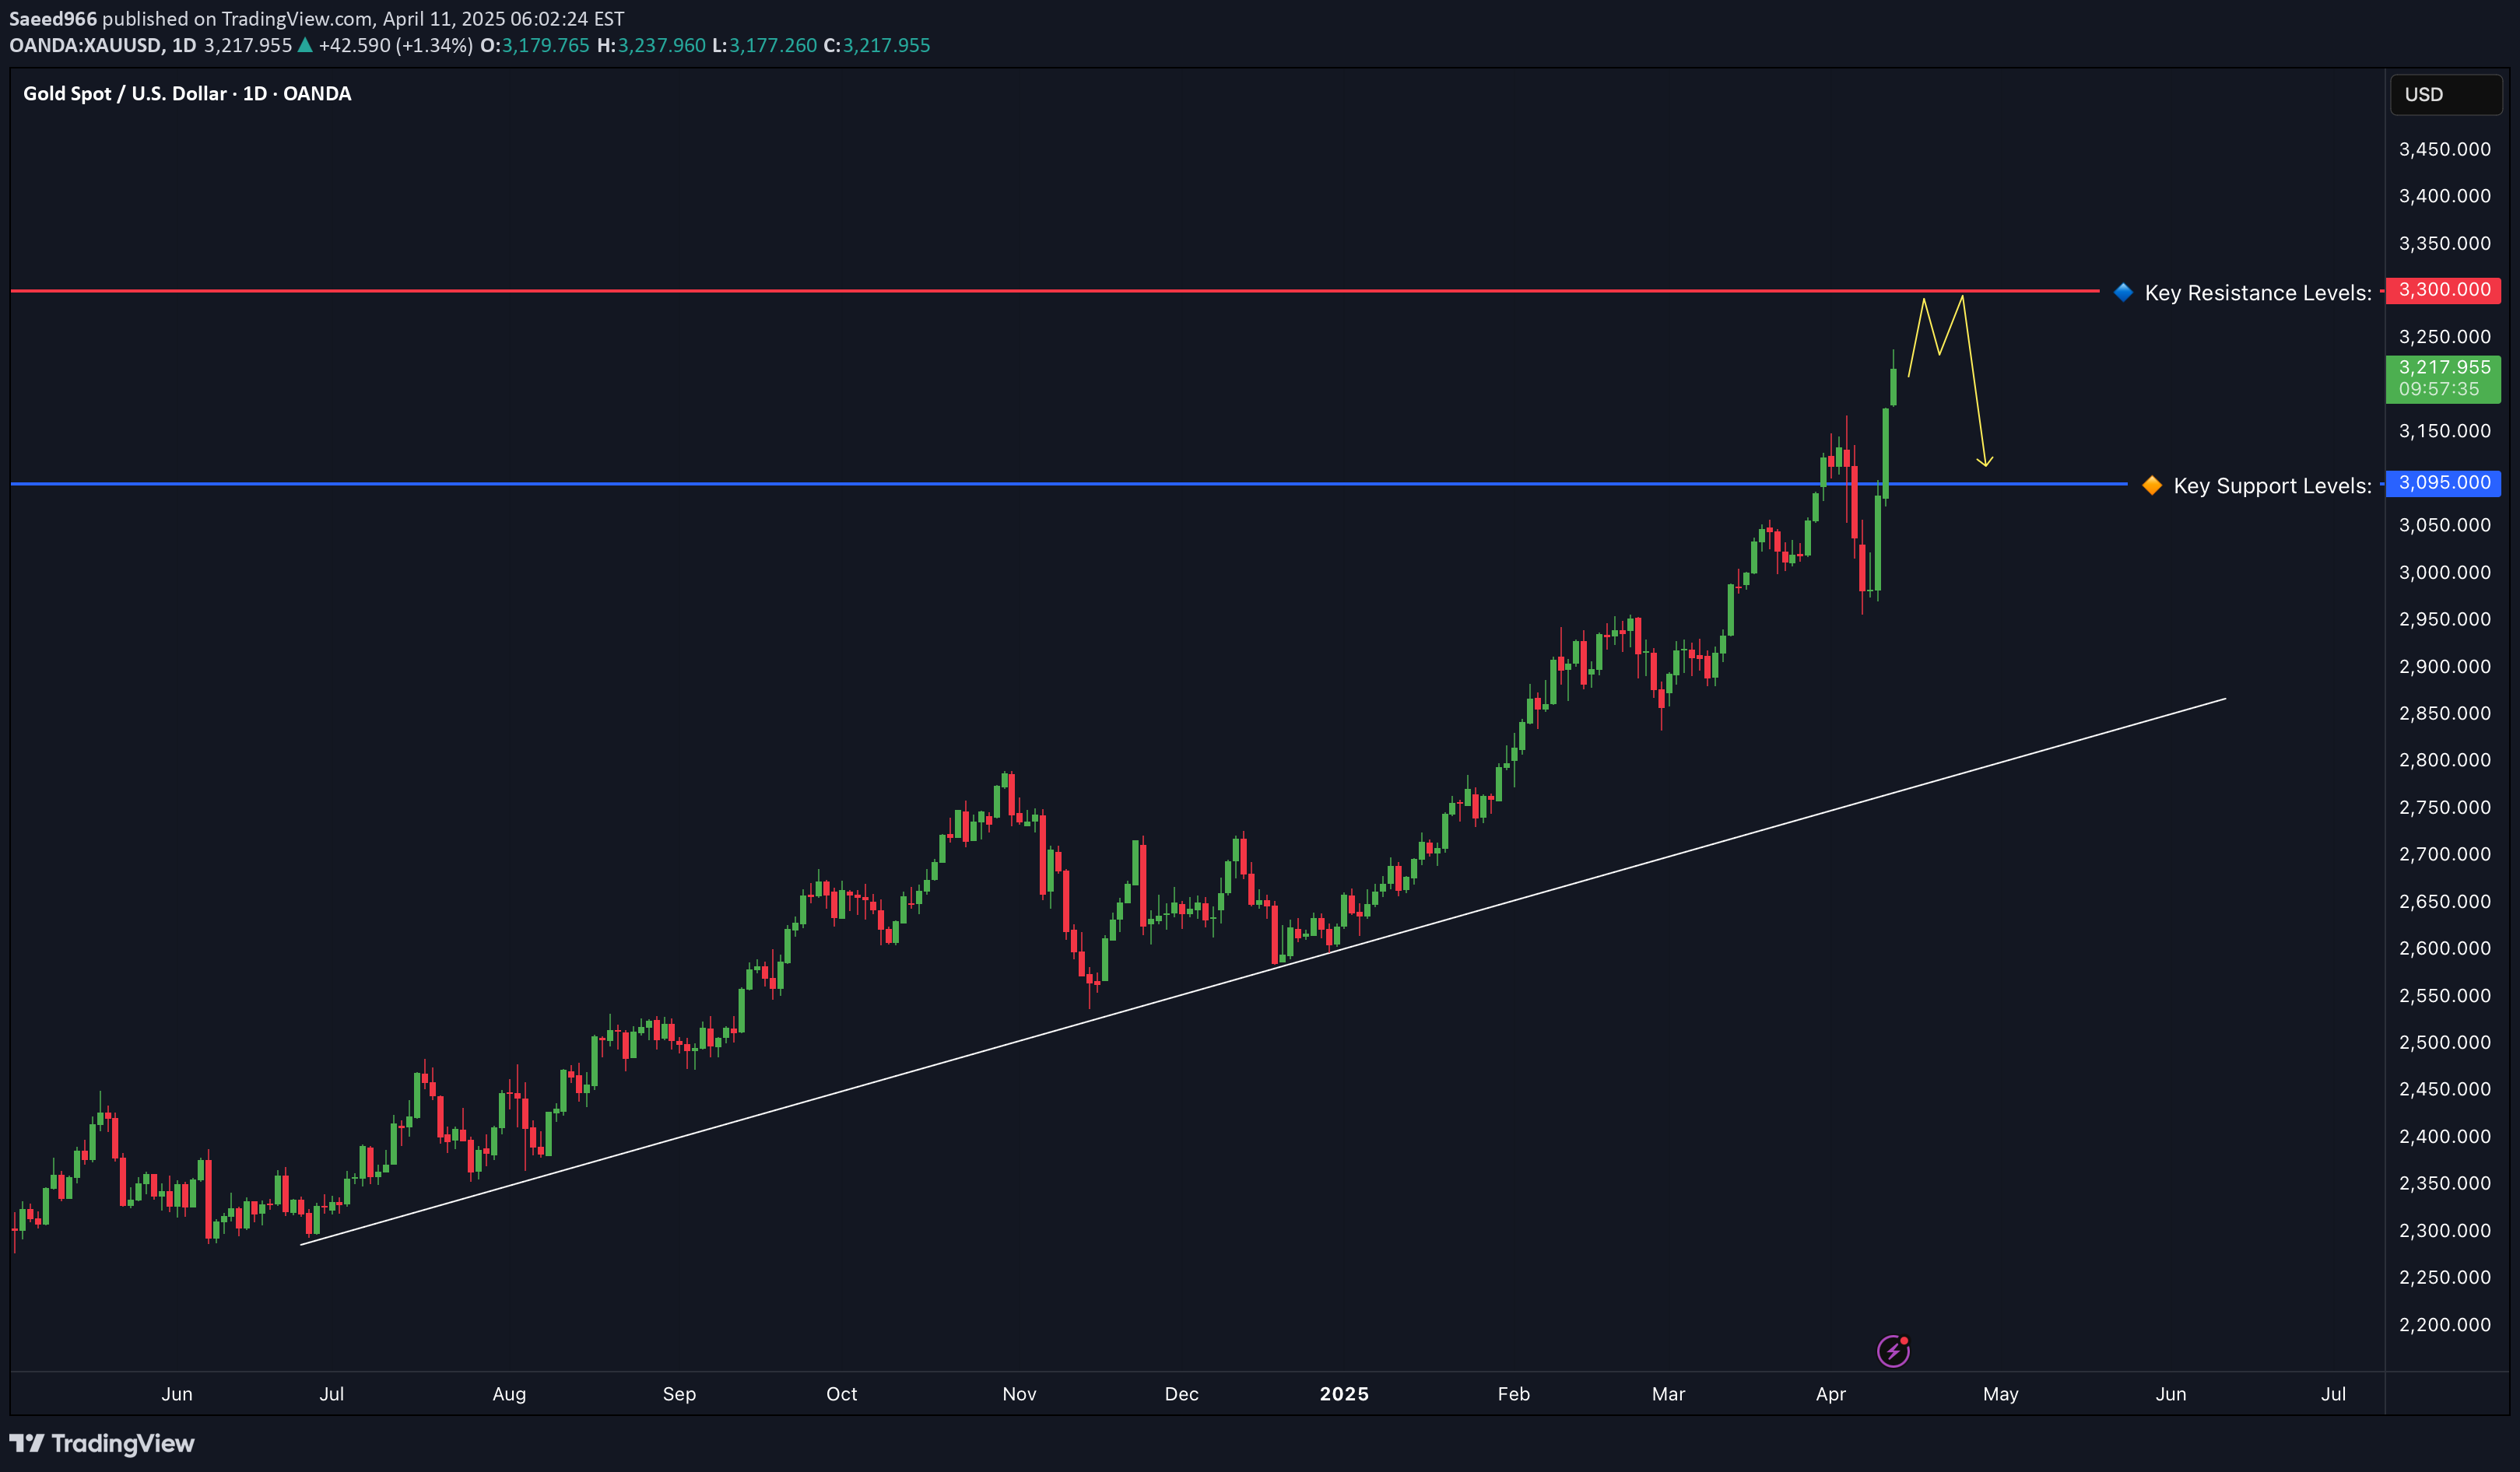
📊 XAU/USD Daily Technical Outlook – April 10, 2025 Gold has recently seen a strong rally, reaching an all-time high of $3167 per ounce. However, it encountered significant resistance at the upper boundary of its ascending channel, leading to a sharp pullback after the release of strong U.S. employment data, which boosted the dollar and exerted selling pressure on gold. Currently, gold is trading around $3050, with key support levels at $2956, $2860, and $2790, which could act as potential bounce points if the decline continues. 📈 Current Market Structure: After reaching the all-time high, the price has corrected lower. As it approaches the support levels mentioned above, the market may see fresh buying opportunities if these levels hold strong. 🔹 Key Resistance Levels: $3100: Immediate resistance. A break above this level could signal a resumption of the uptrend. $3167: All-time high. A breakout above this level would open the door for further gains. 🔸 Key Support Levels: $2956: First support. The price may bounce at this level if it holds. $2860: Major support. A failure to hold above this level could lead to further declines. $2790: Strong support. A drop below this level would signal a shift in the market's direction. 📐 Price Action Patterns: As the price approaches key support levels, there could be reversal patterns forming, indicating a potential price bounce. It’s crucial to monitor the price action at these levels to spot potential entry opportunities. 🧭 Potential Scenarios: ✅ Bullish Scenario: If gold manages to hold above $2956 and bounce, the uptrend may resume toward the resistance levels mentioned above. ❌ Bearish Scenario: If gold fails to maintain the key support levels, the correction could continue, with further declines toward lower support levels. 📌 Conclusion: Gold is currently testing crucial support levels. Monitoring how price behaves at these levels will be key to determining the next direction. Traders should keep an eye on any economic developments that may affect market sentiment. 💬 What’s your outlook for Gold? Will it continue its uptrend or experience further corrections? Share your thoughts below.
Saeed966
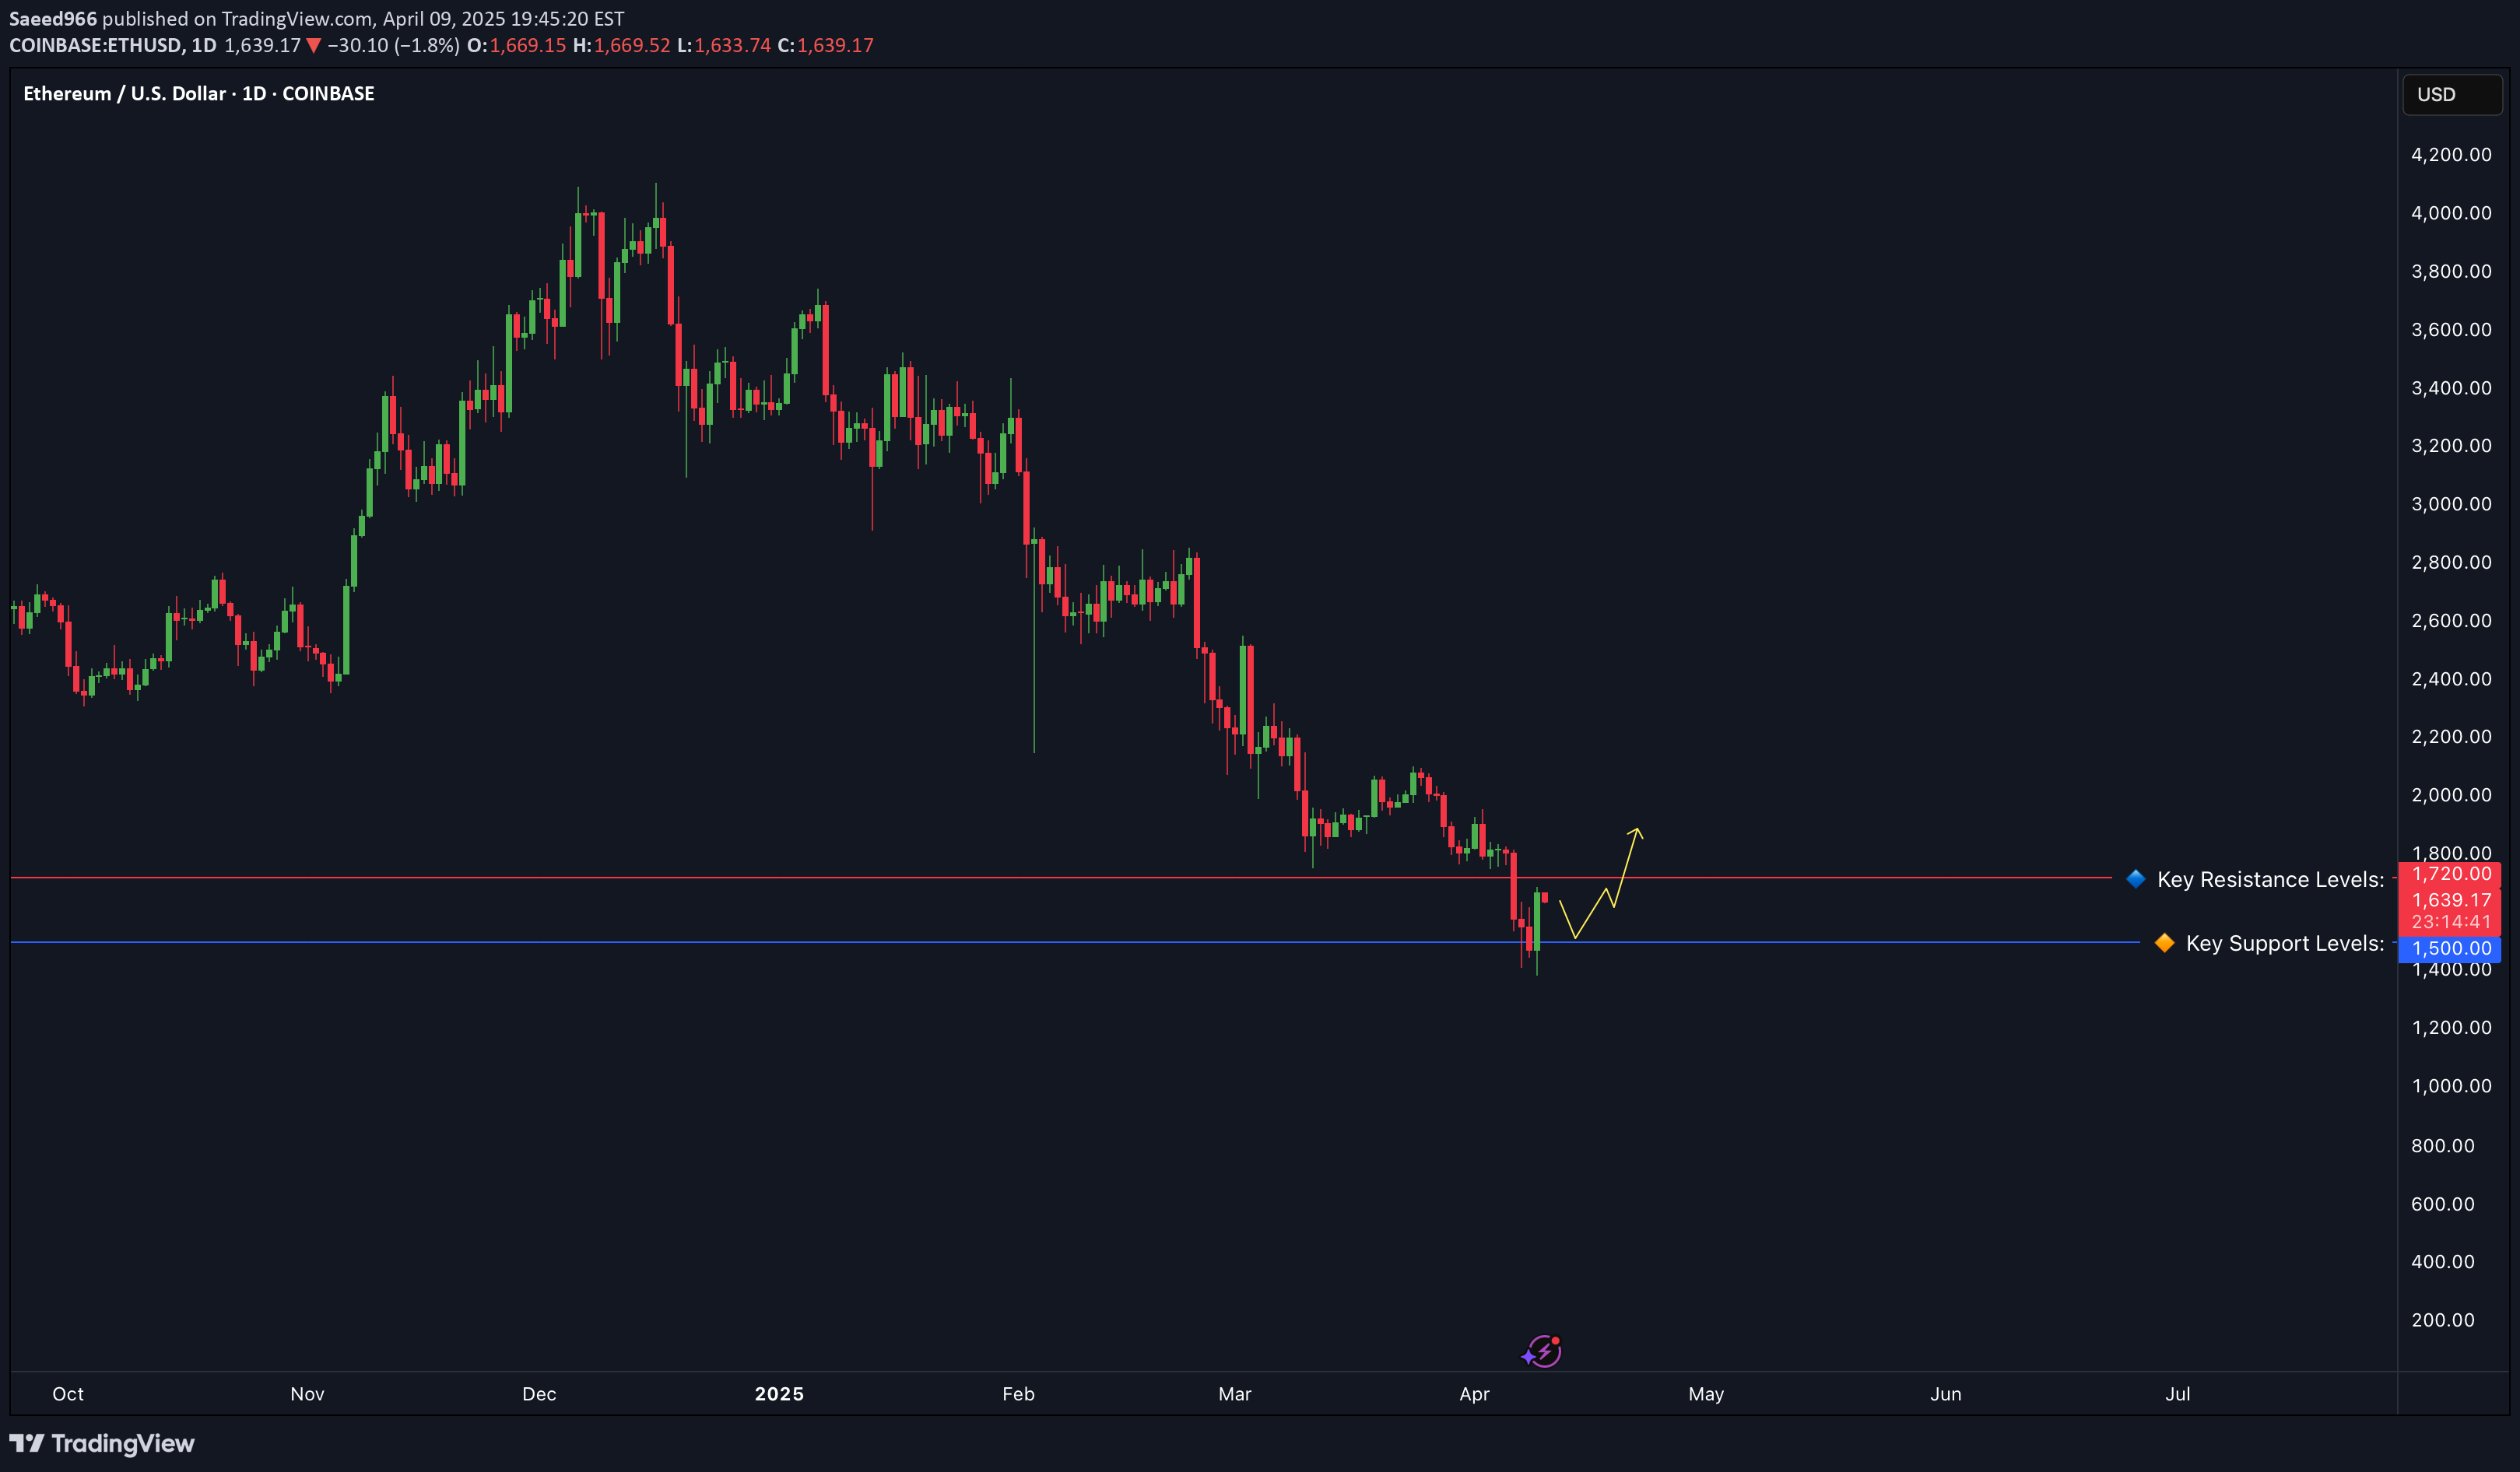
📊 ETH/USD Daily Technical Outlook – April 9, 2025 Ethereum is currently trading around $1,649, facing resistance near the $1,700 level. After a decline from the $1,800 region earlier this month, ETH/USD has been attempting to find support and establish a base. The market is at a critical juncture, with price action suggesting a potential reversal or further downside movement. CoinCodex 📈 Current Market Structure: ETH/USD has been in a downtrend since reaching highs near $1,800 in early April. The pair has formed a series of lower highs and lower lows, indicating bearish momentum. Currently, the price is consolidating just below the $1,700 resistance, suggesting indecision among market participants. 🔹 Key Resistance Levels: $1,700 – $1,720: Immediate resistance zone. A break above this area could signal a potential reversal and open the door for further gains. $1,800: Previous support turned resistance. A move above this level would indicate a shift in market sentiment. 🔸 Key Support Levels: $1,600: Psychological support level. A break below this could lead to increased selling pressure. $1,500: Major support zone. Holding above this level is crucial for bulls to prevent further declines. 📐 Price Action Patterns: Ethereum's recent price action suggests the formation of a descending triangle, a bearish continuation pattern. The horizontal support around $1,600 combined with descending highs indicates that sellers are gaining control. A decisive break below the $1,600 support could lead to a measured move targeting the $1,500 area. 🧭 Potential Scenarios: ✅ Bullish Scenario: If ETH/USD breaks above the $1,700 resistance with strong volume, it could signal a reversal, targeting the $1,800 level. This move would require a shift in market sentiment and increased buying interest. ❌ Bearish Scenario: A break below the $1,600 support could lead to further declines, with the next target around $1,500. This scenario would confirm the descending triangle pattern and suggest continued bearish momentum. 📌 Conclusion: Ethereum is at a pivotal point, trading just below key resistance at $1,700. The formation of a descending triangle suggests a bearish bias, but a break above resistance could invalidate this pattern. Traders should monitor these key levels closely and watch for a decisive move to determine the next directional bias. 💬 Do you think Ethereum will break above $1,700, or is further downside ahead? Share your thoughts below 👇
Saeed966
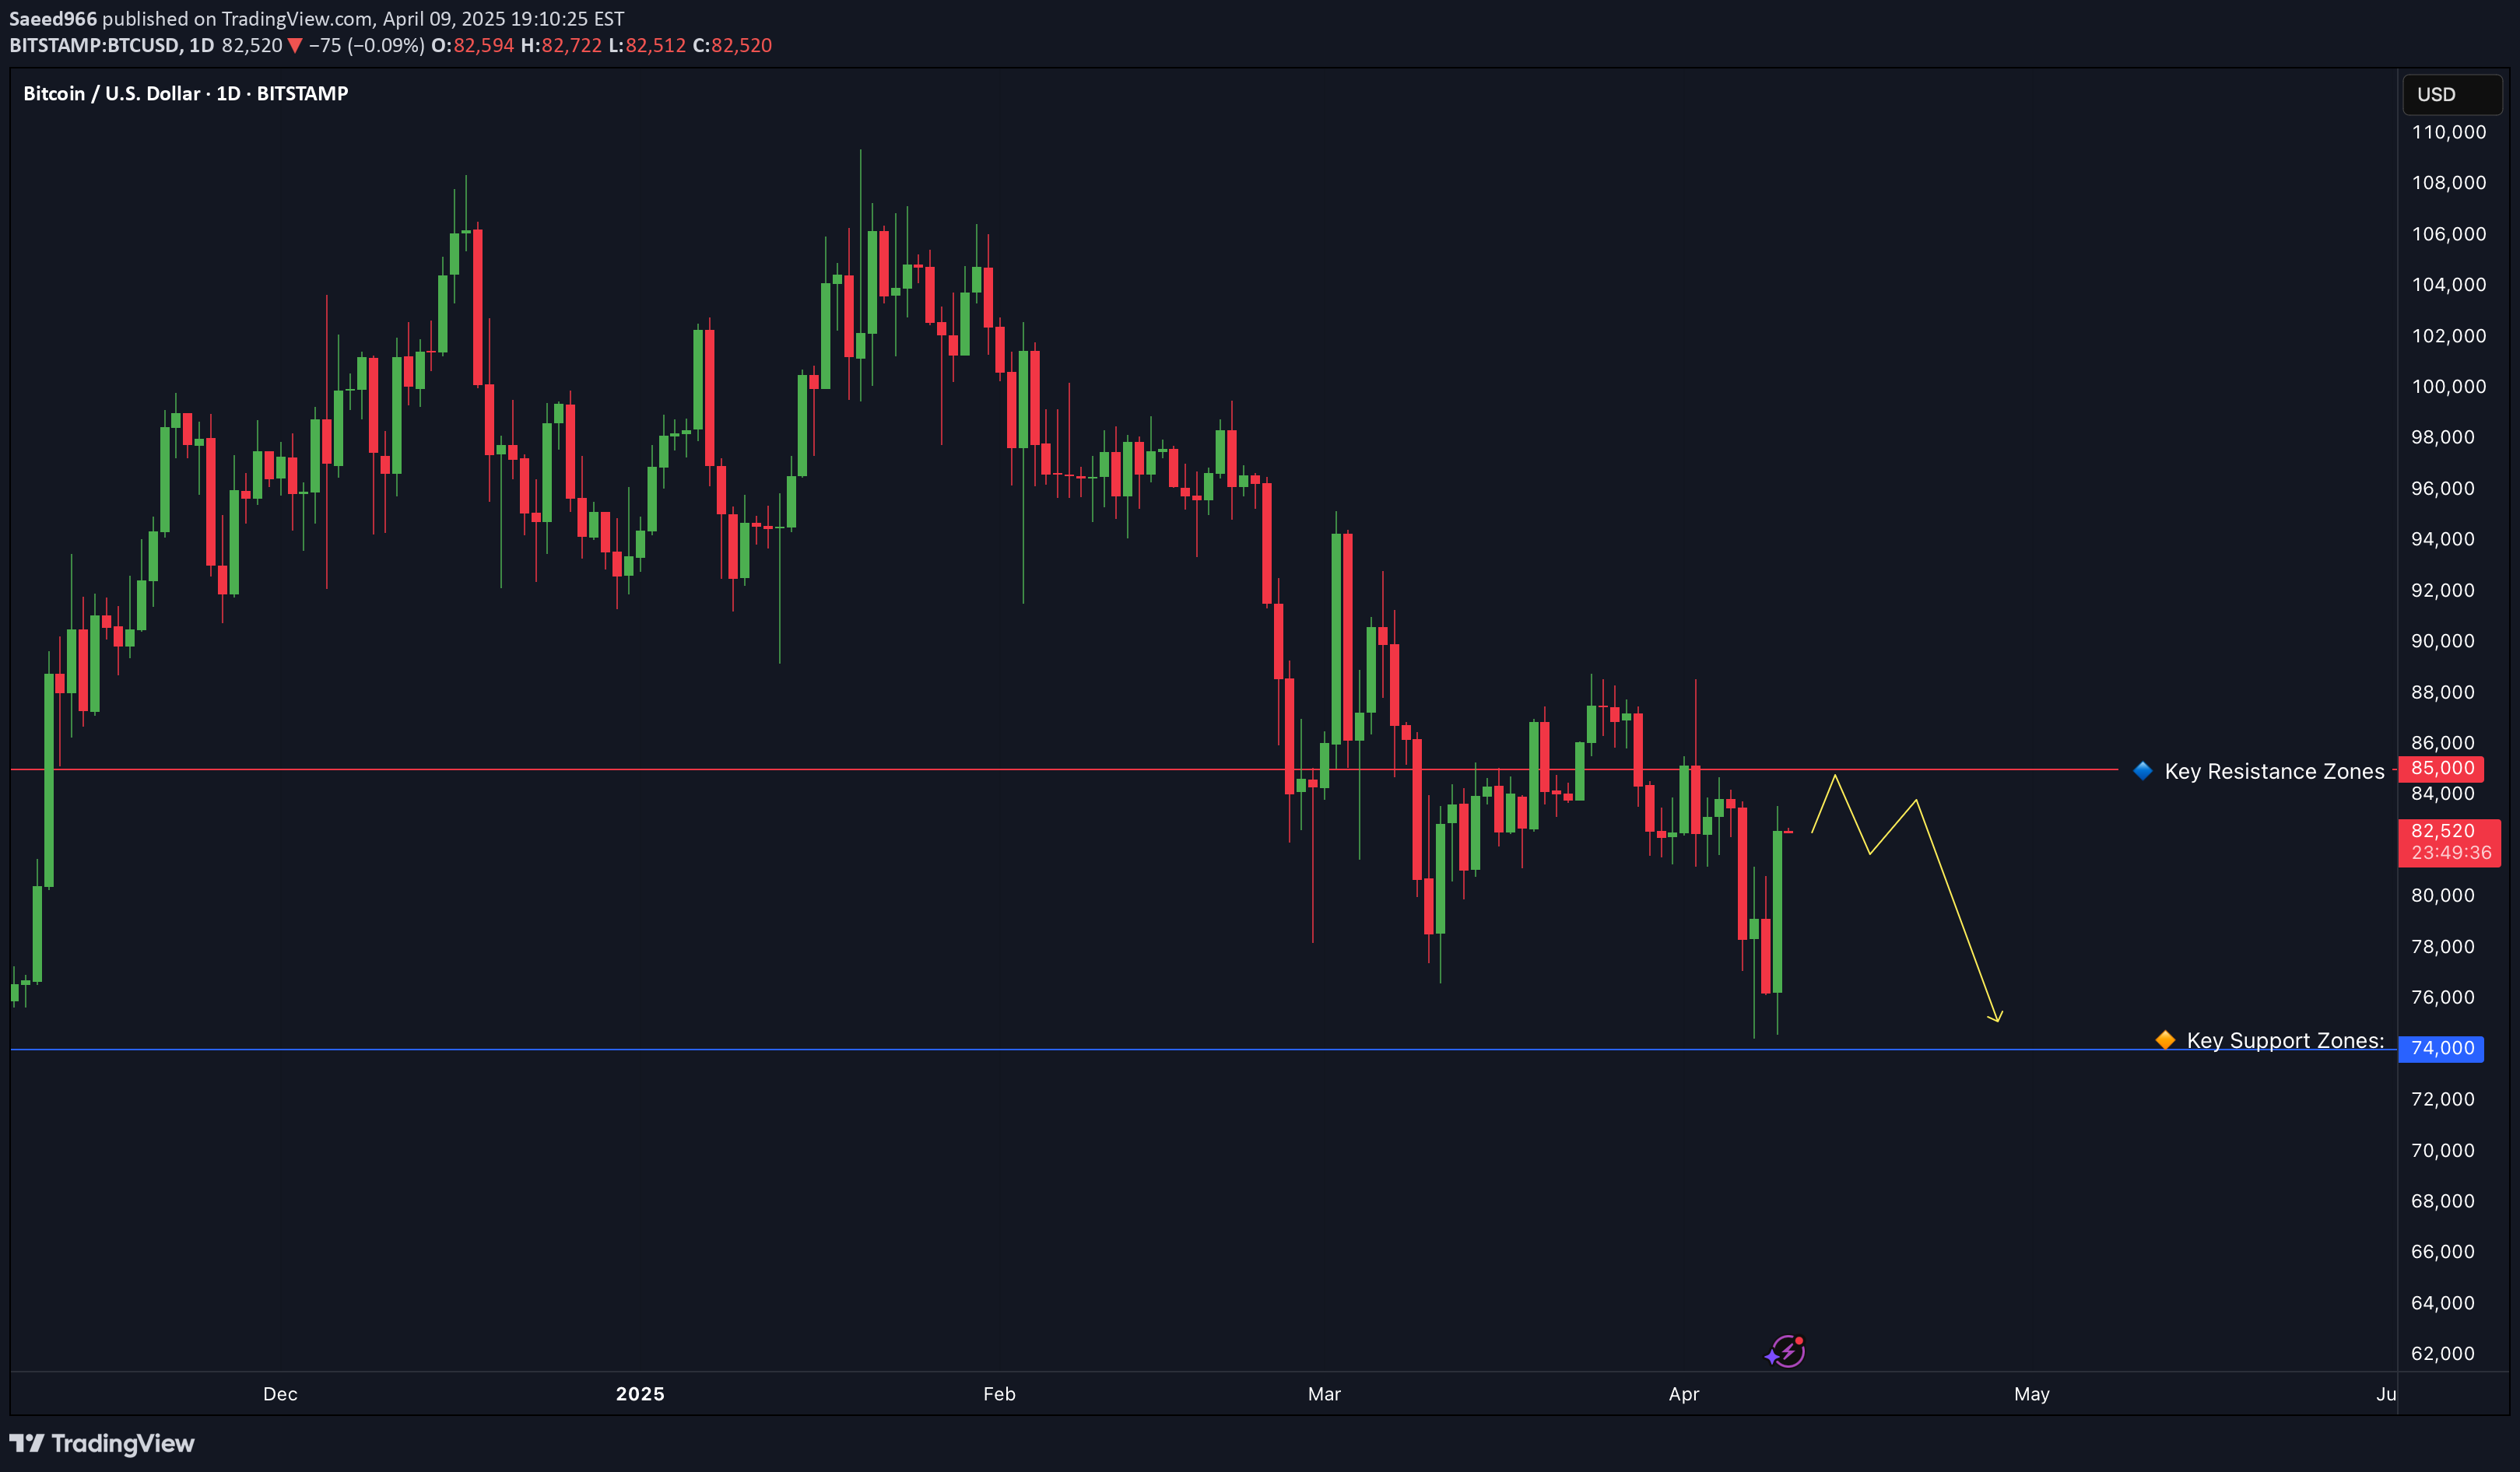
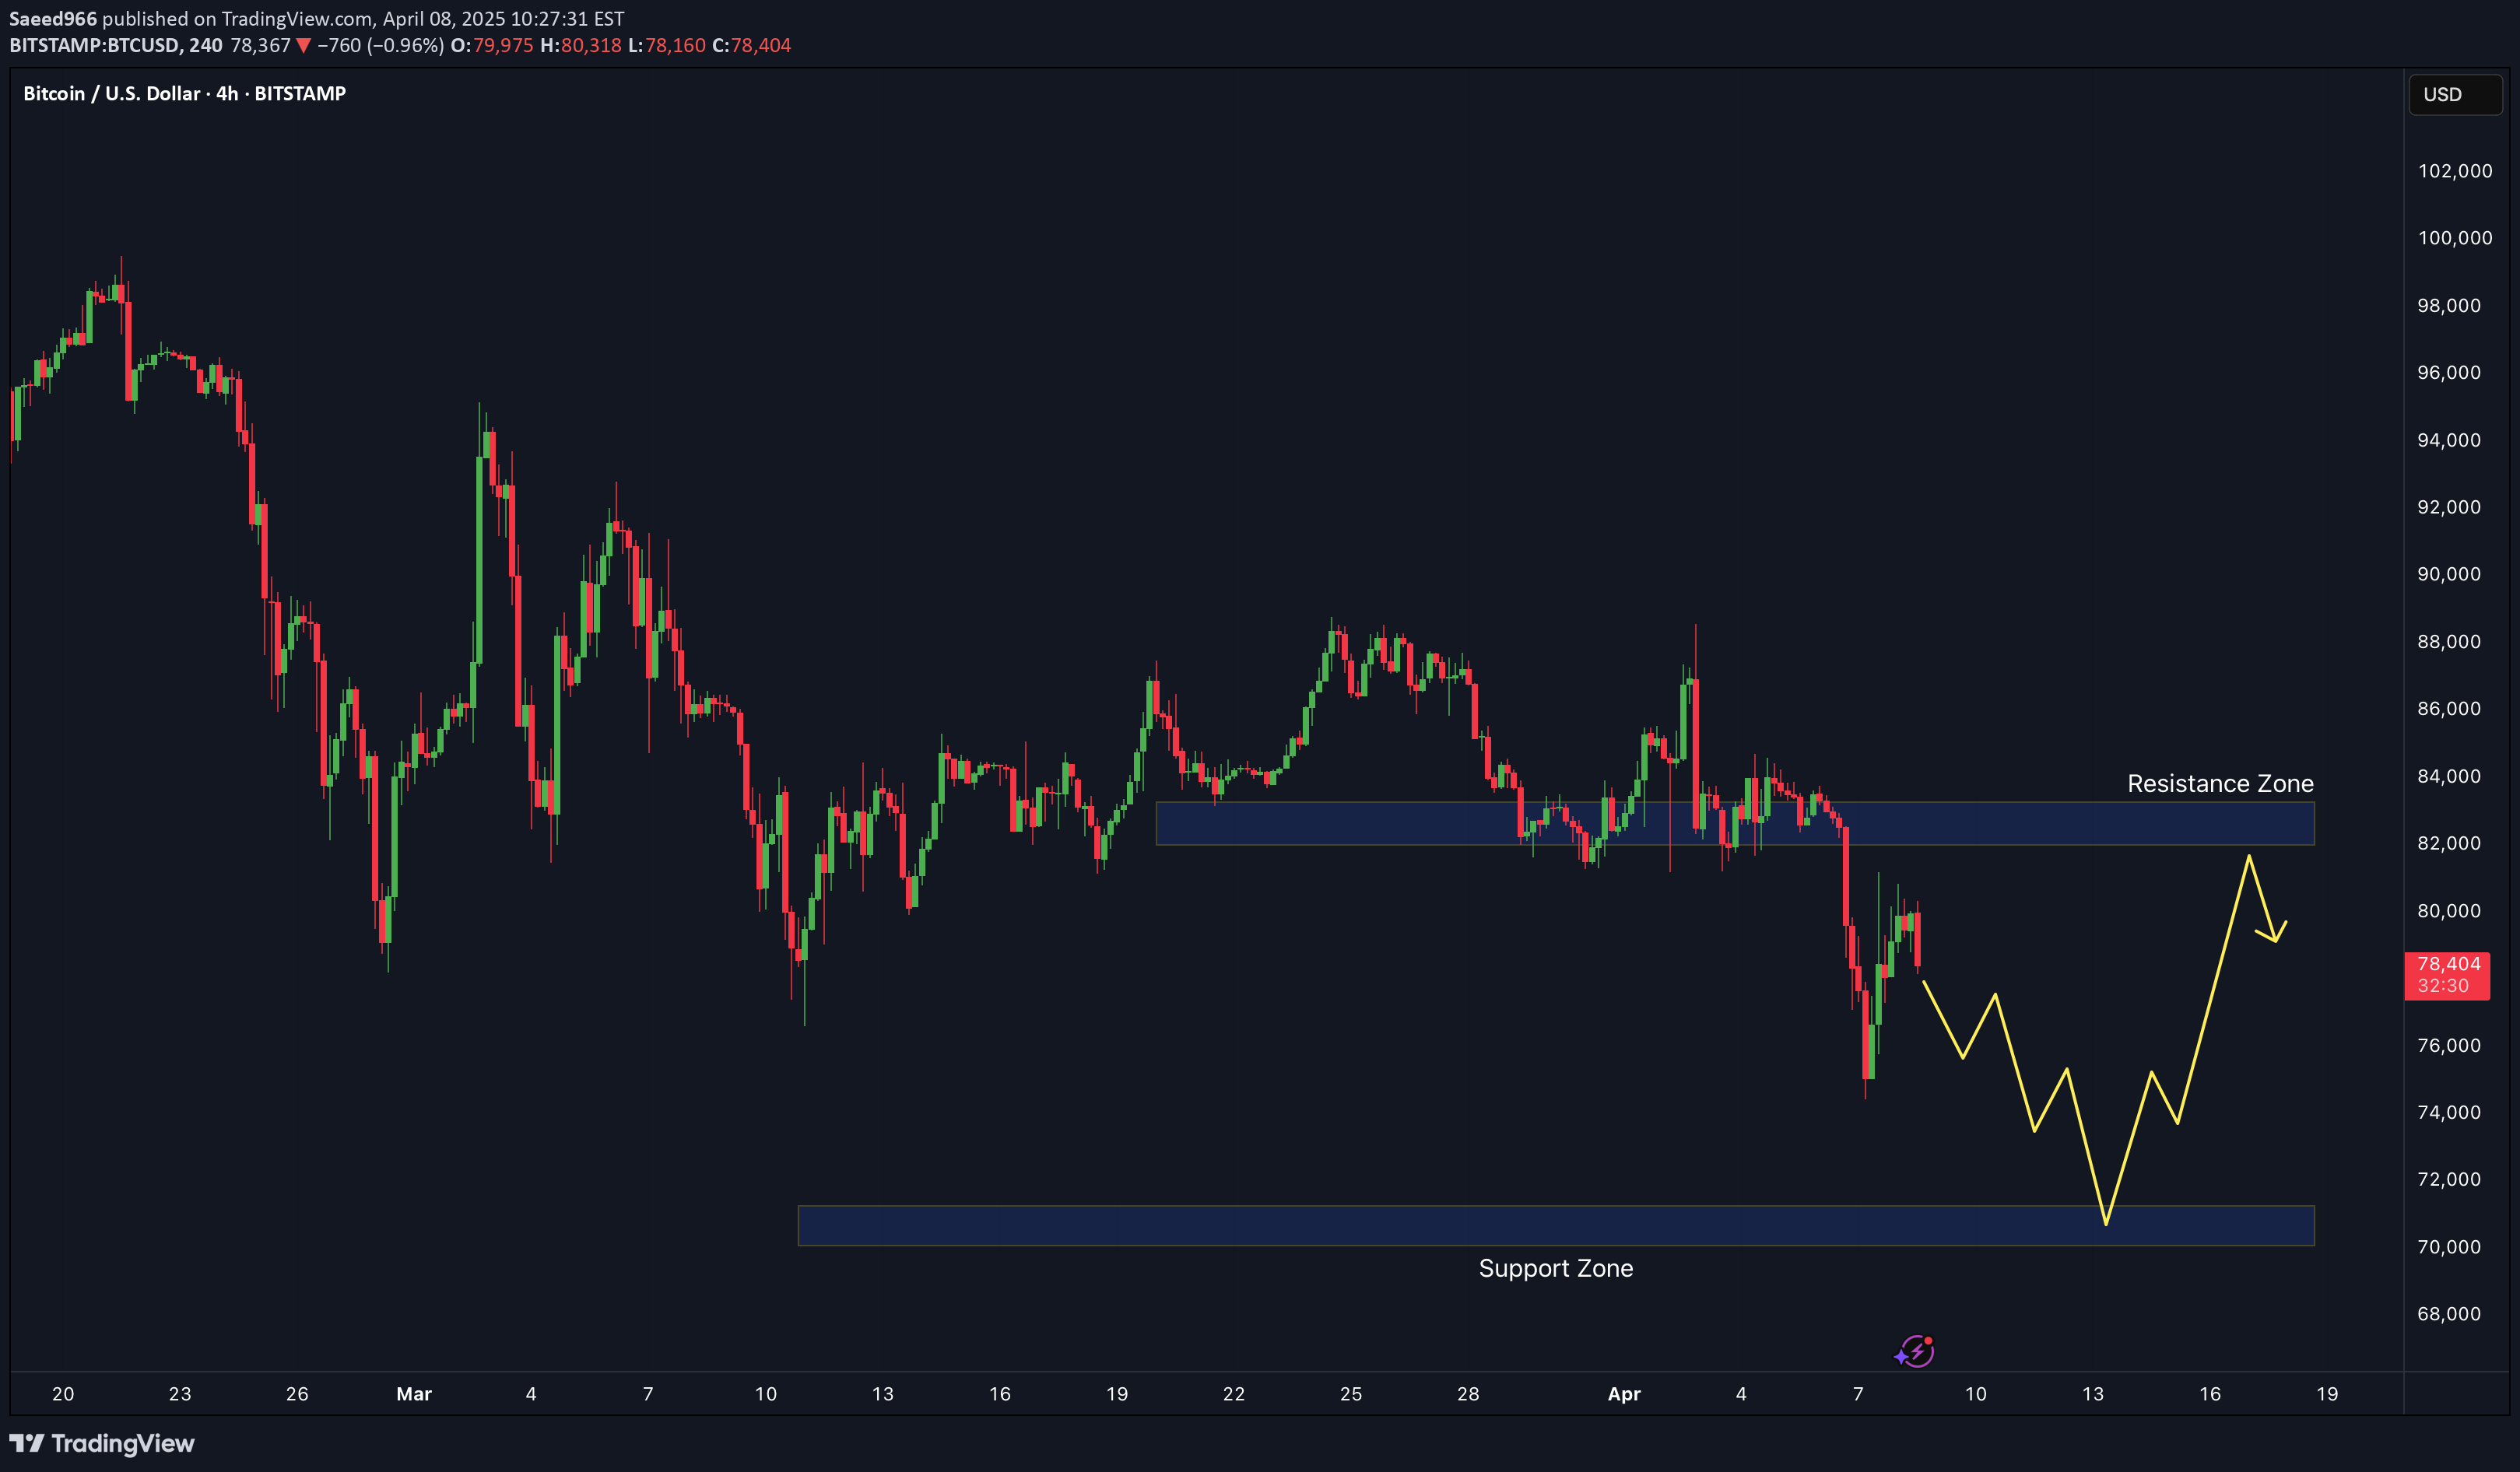
BTC/USD Daily Technical Outlook – April 9, 2025 Bitcoin is currently consolidating just below the psychological $85,000 level after a historic bull run that pushed price to fresh all-time highs. The market is cooling off — not crashing — with price action forming a high-tight flag, often a continuation signal after a vertical move. However, with momentum slowing and volatility compressing, traders must prepare for a major breakout or breakdown in the coming days. 📈 Trend Structure: BTC/USD remains in a strong bullish trend. Since the breakout above $69,000 (previous ATH from 2021), the rally has been aggressive and directional — barely giving bears a chance to breathe. Price has formed a series of higher highs and higher lows, respecting a steep ascending trendline since early February. But now, the pair is coiling near the highs, forming a tight range between $80,000 and $83,500. 🔹 Key Resistance Zones: $83,500 – $85,000: Immediate resistance; this area has capped price multiple times in recent sessions. A daily close above this zone could trigger the next leg higher. $88,000: Near-term bullish target based on measured move from recent consolidation. $90,000 – $92,000: A psychological milestone — and a possible magnet for price if bulls break out cleanly. 🔸 Key Support Zones: $80,000: Round number support — the floor of the current consolidation. $76,500: Previous breakout zone and minor demand area. $72,000 – $74,000: Major support and ideal re-test level if BTC corrects — where many sidelined bulls are likely waiting to buy in. 📐 Technical Pattern: Bitcoin is forming a high-tight flag — a bullish continuation pattern typically found after strong vertical rallies. The range is tightening, volume is dropping, and volatility is compressing — classic signs that a volatility expansion is coming soon. A breakout above $83,500–85,000 would confirm the flag and likely ignite a sharp move to 88K or higher. On the flip side, a breakdown below $80K could send price to retest $76.5K or even $74K — which would still be healthy within the broader trend. 🧭 Scenarios to Watch: ✅ Bullish Scenario: A breakout and daily close above $85,000 would confirm the continuation pattern, targeting $88,000 first, then $90,000+. Volume and candle structure will be key to confirming the move. ❌ Bearish Scenario: If price fails to break out and instead drops below $80,000, a correction could unfold toward $76,500 or even $74,000 — presenting a potential re-entry opportunity for long-term bulls. 📌 Conclusion: Bitcoin is trading near all-time highs in a classic consolidation phase. Price action favors the bulls, but the breakout hasn’t confirmed — yet. Whether BTC breaks above $85K or drops below $80K will likely define the next major swing. As always, let the candles tell the story — and don’t chase, wait for confirmation. 💬 Are we about to see Bitcoin above $90K? Or is this distribution in disguise? Drop your thoughts 👇
Saeed966
📊 XAU/USD Daily Technical Analysis – April 2025 Gold has surged to fresh all-time highs, with price currently trading above $2,320 after an explosive rally in recent weeks. The momentum has been relentless, but price action is now approaching a potential inflection zone, where either a continuation or a sharp correction could emerge. 📈 Trend Overview: The trend on the daily chart is strongly bullish. Since the breakout above the previous all-time high near $2,075 in early March, gold has been in a near-vertical climb, forming successive higher highs with shallow pullbacks. However, with price now significantly extended from recent bases, and psychological levels being tested, bulls may face their first real challenge in weeks. 🔹 Key Resistance Zones: $2,325 – $2,345: Immediate resistance zone based on recent price clustering. A decisive break above this could fuel further upside toward… $2,400: Psychological milestone and potential magnet for bullish momentum if the rally continues. 🔸 Key Support Zones: $2,280: Minor support from the most recent consolidation zone — the first level to watch if gold pulls back. $2,240: A more solid support based on previous breakout structure. $2,180 – $2,200: Major structural demand zone — this is where buyers are most likely to step back in if a deeper correction occurs. 📐 Technical Structures to Watch: Gold is forming what appears to be a rising wedge on the daily chart — a pattern that often emerges during strong trends but can signal momentum loss or potential reversal when the wedge narrows. Additionally, recent price action shows signs of stalling candles (small-bodied candles with long wicks), suggesting hesitation or possible profit-taking at current levels. While there’s no confirmation yet of a reversal, these are early warning signs traders should monitor closely. 🧭 Possible Scenarios: ✅ Bullish Continuation: If gold breaks and holds above $2,345, the next logical upside target would be $2,400, followed by potential extensions toward $2,450 on high momentum or geopolitical catalysts. ❌ Bearish Pullback: Failure to break higher — especially with reversal candles — could trigger a retracement toward $2,280 or deeper to $2,240. A breakdown below $2,200 would indicate a more serious correction and likely shift sentiment short-term. 📌 Conclusion: Gold is in a powerful uptrend, trading at never-before-seen levels. But price is now testing a key zone where momentum could either continue explosively or stall into a correction. Watch for breakout confirmation above $2,345 — or signs of exhaustion below $2,280. Either way, a major move is coming. 💬 Is this the start of Gold 2.0? Or is a correction brewing? Let’s talk below 👇
Saeed966
📝 🚀 BTC/USD – 4H Price Action Masterclass | Breakout Brewing Between $71.2K & $72K! Bitcoin is currently consolidating in a high-tension zone on the 4-hour chart, forming a classic range-bound structure between two key levels: 🔹 Support at $71,200 – a previous resistance now acting as short-term demand 🔹 Resistance at $72,000 – a strong psychological barrier that price has failed to close above This tightening range is setting the stage for a high-impact move, and the market is showing signs of compression. No indicators, no noise — just clean structure and price action clarity. 🔍 Detailed Technical Breakdown: 📌 $71,200 – Flip Zone: Recently flipped from resistance to support after a breakout. Price is now retesting this level with precision, suggesting potential accumulation — but failure here may trigger strong selling pressure. 📌 $72,000 – Critical Resistance: This level has held price down for multiple sessions. If bulls manage to close above it on strong volume, we could see a push towards 73K +, where liquidity clusters await. ⚔️ Battle of the Zones – What to Expect Next? Bullish Scenario: A breakout above $72,000 on strong bullish candles could ignite a move toward the next resistance at $73,500–$74,000. Bearish Scenario: If $71,200 breaks down, expect a sharp drop toward $70,400, possibly extending to the $69K handle. This setup offers a textbook example of how support/resistance zones act as battlegrounds for short-term market control. 🔥 Why This Chart Matters (No Indicators Used): Clean price action = clean decision-making. Ideal for breakout traders & range scalpers. High probability setup with defined risk levels. Easy to read & replicate — especially for beginners learning PA. 💬 What’s YOUR take? Are we about to see a bullish explosion, or is this a trap before a deeper drop? 👇 Drop your analysis in the comments – let’s build a real traders’ conversation below! 📈 If you found this chart helpful, don’t forget to like & follow for more clean setups.
Saeed966
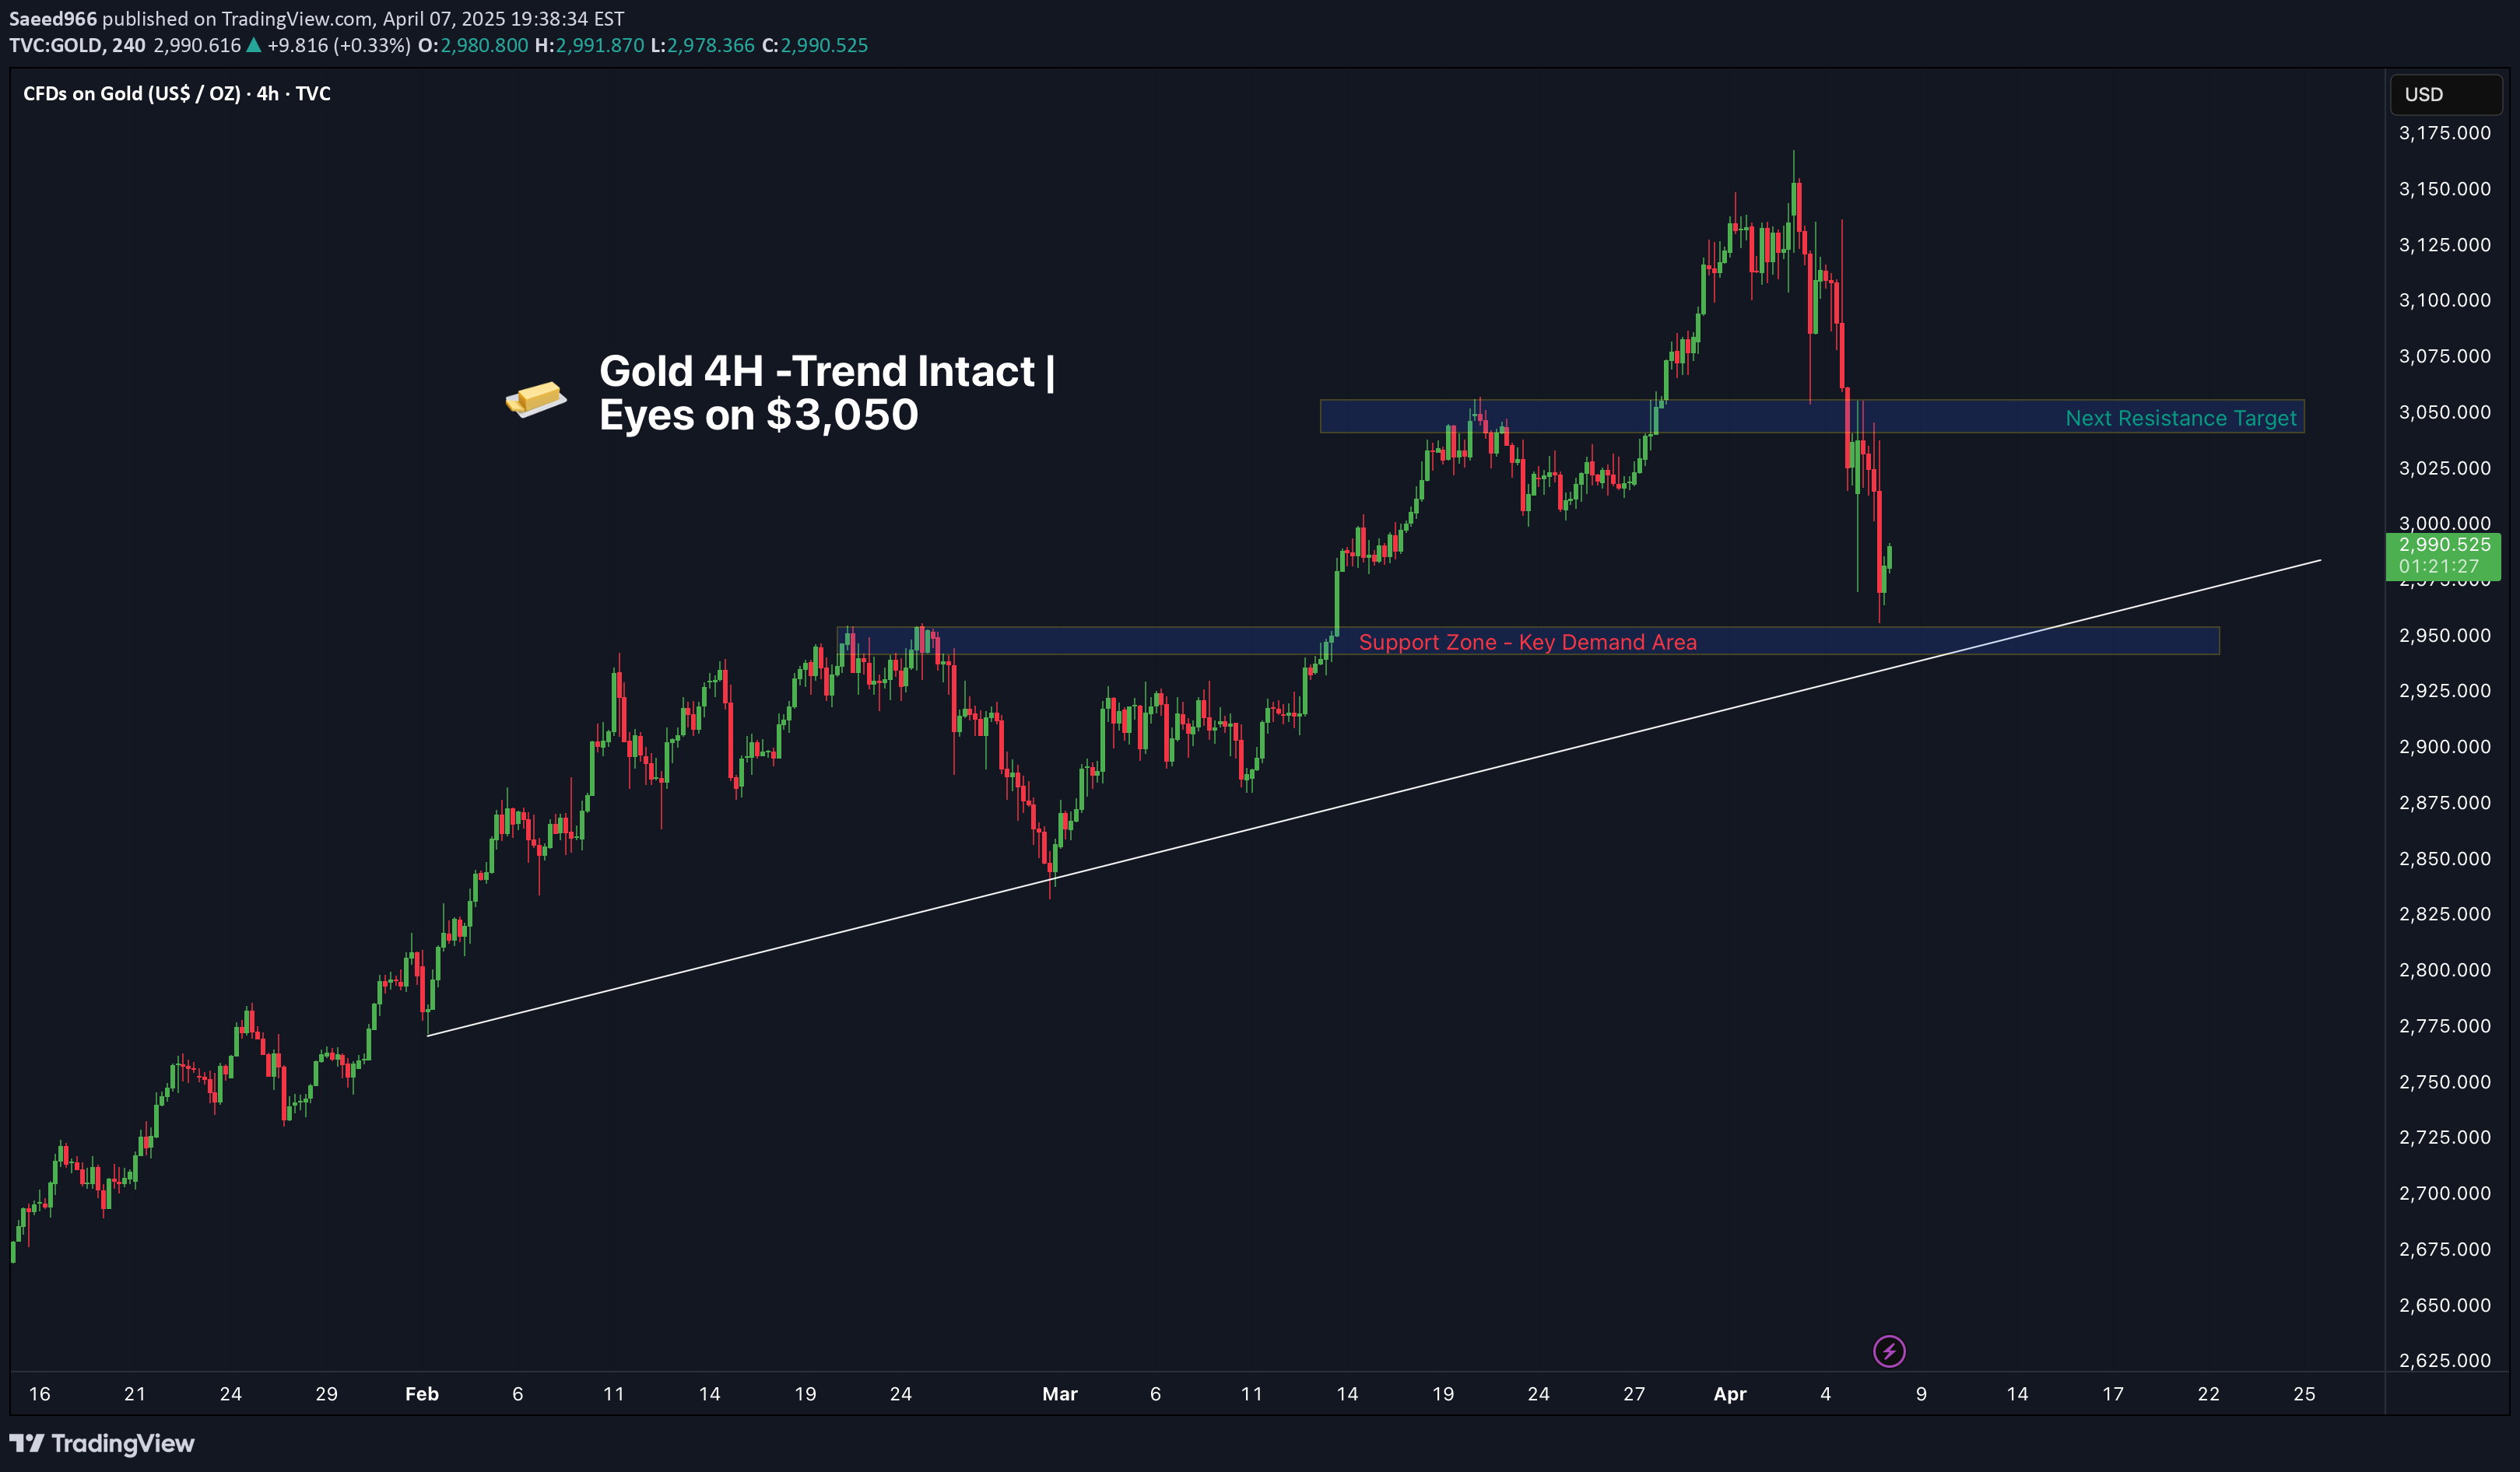
**Gold (XAU/USD) | 4H Chart | Bullish Bias** Gold continues to shine as it builds a solid bullish structure on the 4H timeframe. After a healthy pullback, price has bounced back strongly, holding above key support zones and aiming higher. **What's happening now?** - Price is forming *higher highs and higher lows*, respecting the bullish trendline. - Strong demand kicked in around the *$2,950* zone — a key level to watch for potential pullbacks. - The next resistance lies near *$3,050*, a psychological and technical level that could act as the next target for buyers. **Technical Confluence:** - *Fibonacci retracement* aligns with recent pullbacks around $2,950 – offering strong support. - *RSI* is hovering above 50, confirming ongoing bullish momentum. - Price remains above the *50-period EMA*, supporting the uptrend. --- **Bullish Scenario:** If gold holds above $2,950 and breaks above $3,010 with volume, we could see a push toward *$3,050–$3,070* in the short term. **Invalidation:** A confirmed break below *$2,940* could weaken the bullish outlook and shift momentum. --- **Educational Insight:** In trending markets, pullbacks to key zones like Fibonacci levels or prior support often offer higher-probability trades. Instead of chasing breakouts, look for *retests* with confirmation. --- What’s your take on gold right now? Are we headed toward new highs or due for a pause?
Saeed966
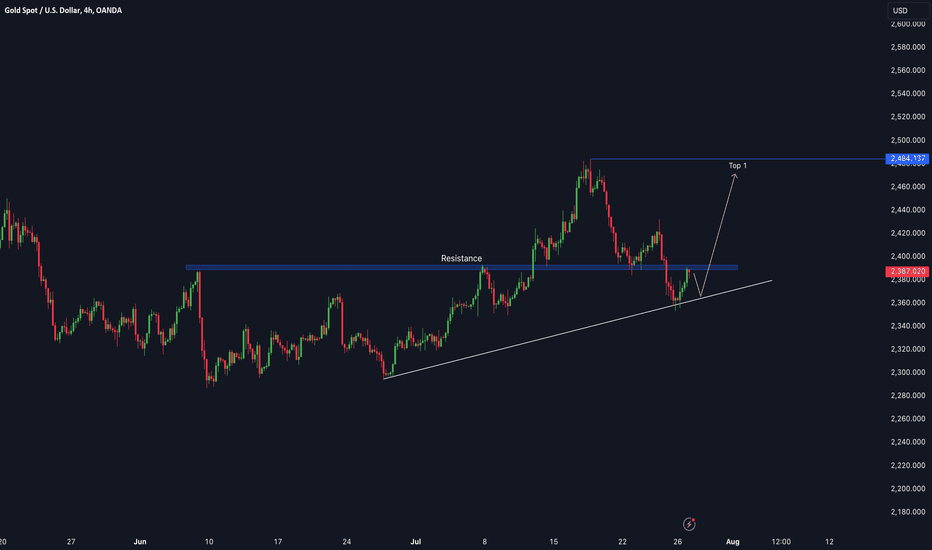
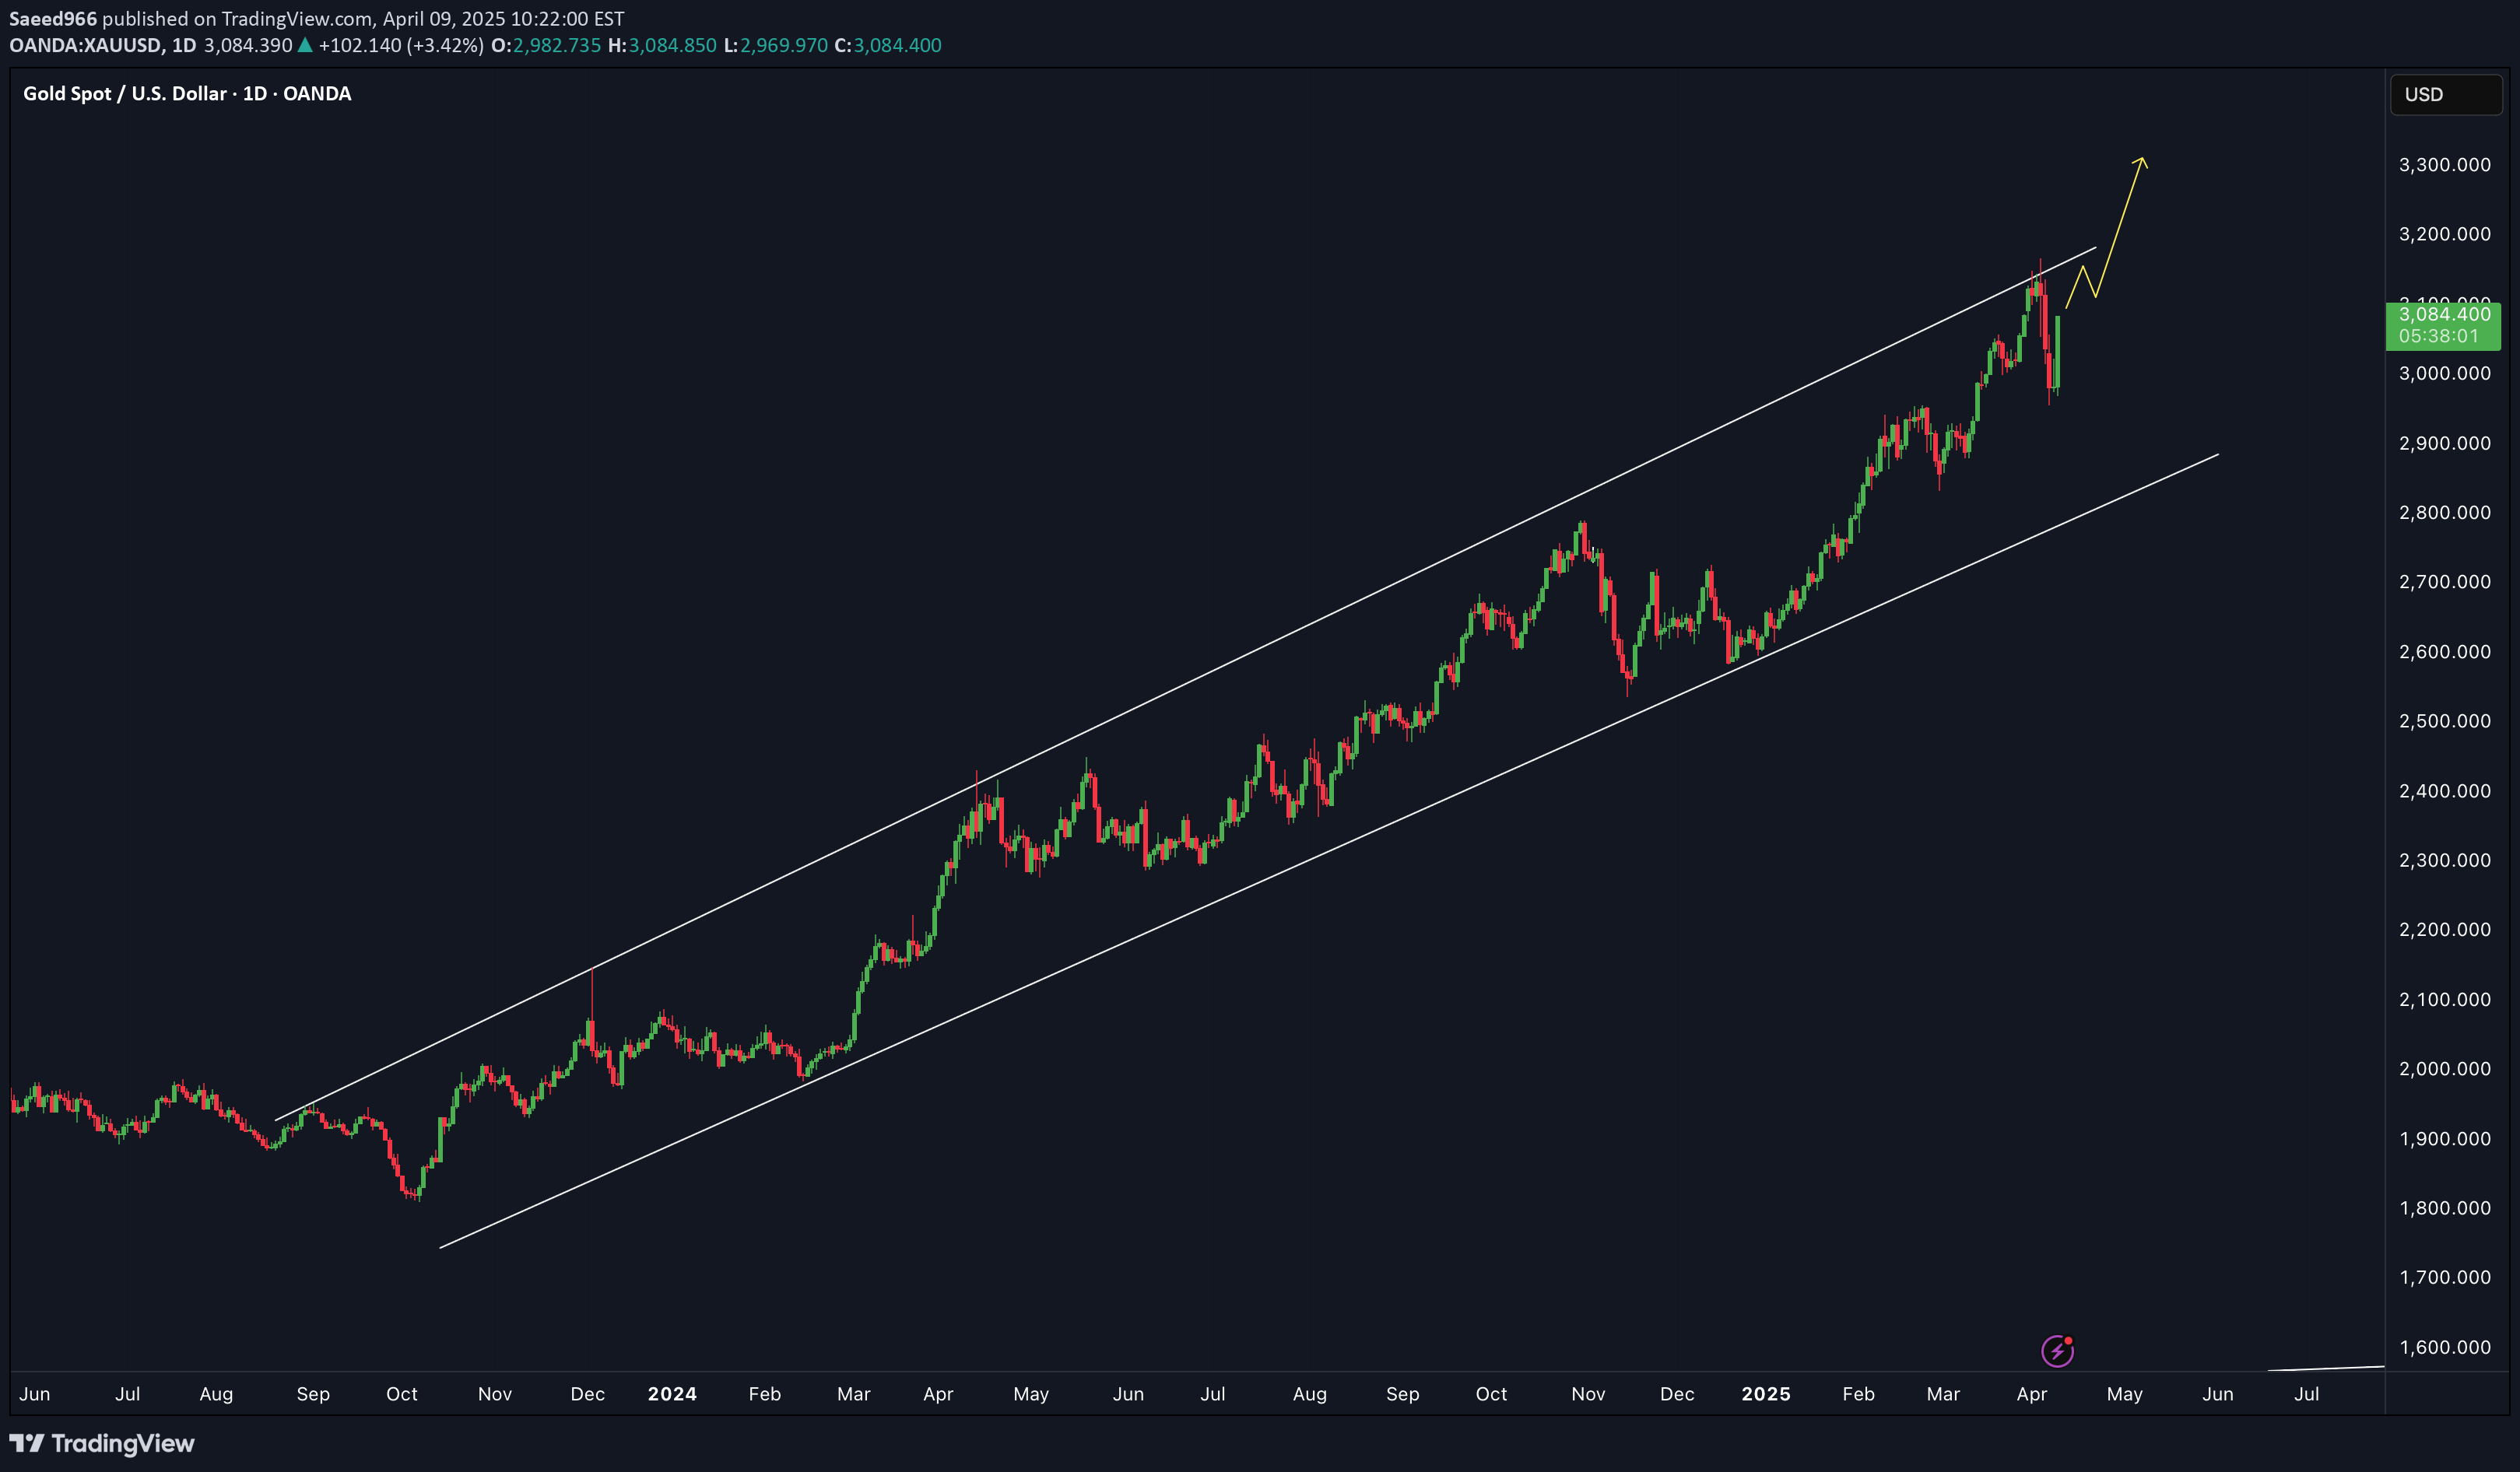
If it does not break the rising trend line, there will be a rise according to the scenario.
Saeed966
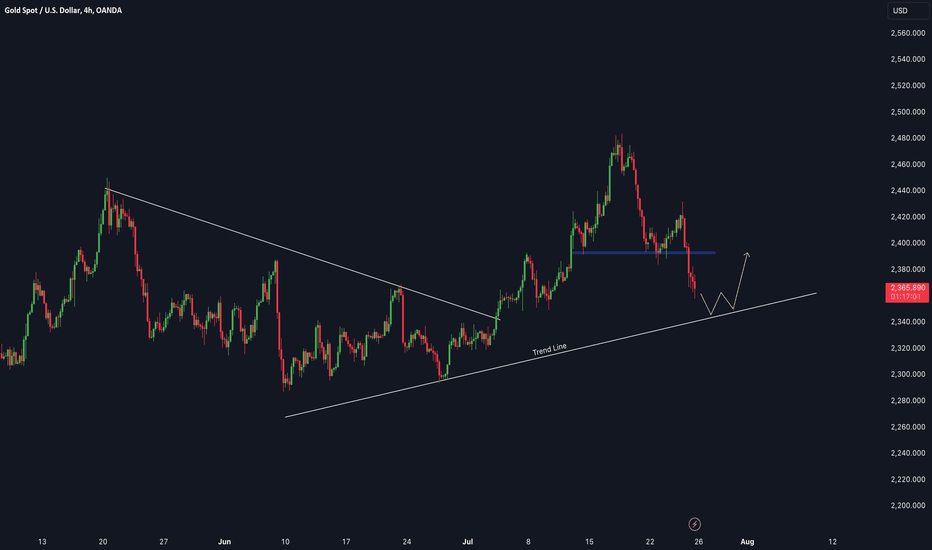
We also notice that there is a significant decline in the movement of gold, so we also see that it will return to the trend line and then it will rise.
Disclaimer
Any content and materials included in Sahmeto's website and official communication channels are a compilation of personal opinions and analyses and are not binding. They do not constitute any recommendation for buying, selling, entering or exiting the stock market and cryptocurrency market. Also, all news and analyses included in the website and channels are merely republished information from official and unofficial domestic and foreign sources, and it is obvious that users of the said content are responsible for following up and ensuring the authenticity and accuracy of the materials. Therefore, while disclaiming responsibility, it is declared that the responsibility for any decision-making, action, and potential profit and loss in the capital market and cryptocurrency market lies with the trader.