Technical analysis by Saeed966 about Symbol BTC: Sell recommendation (4/10/2025)
Saeed966
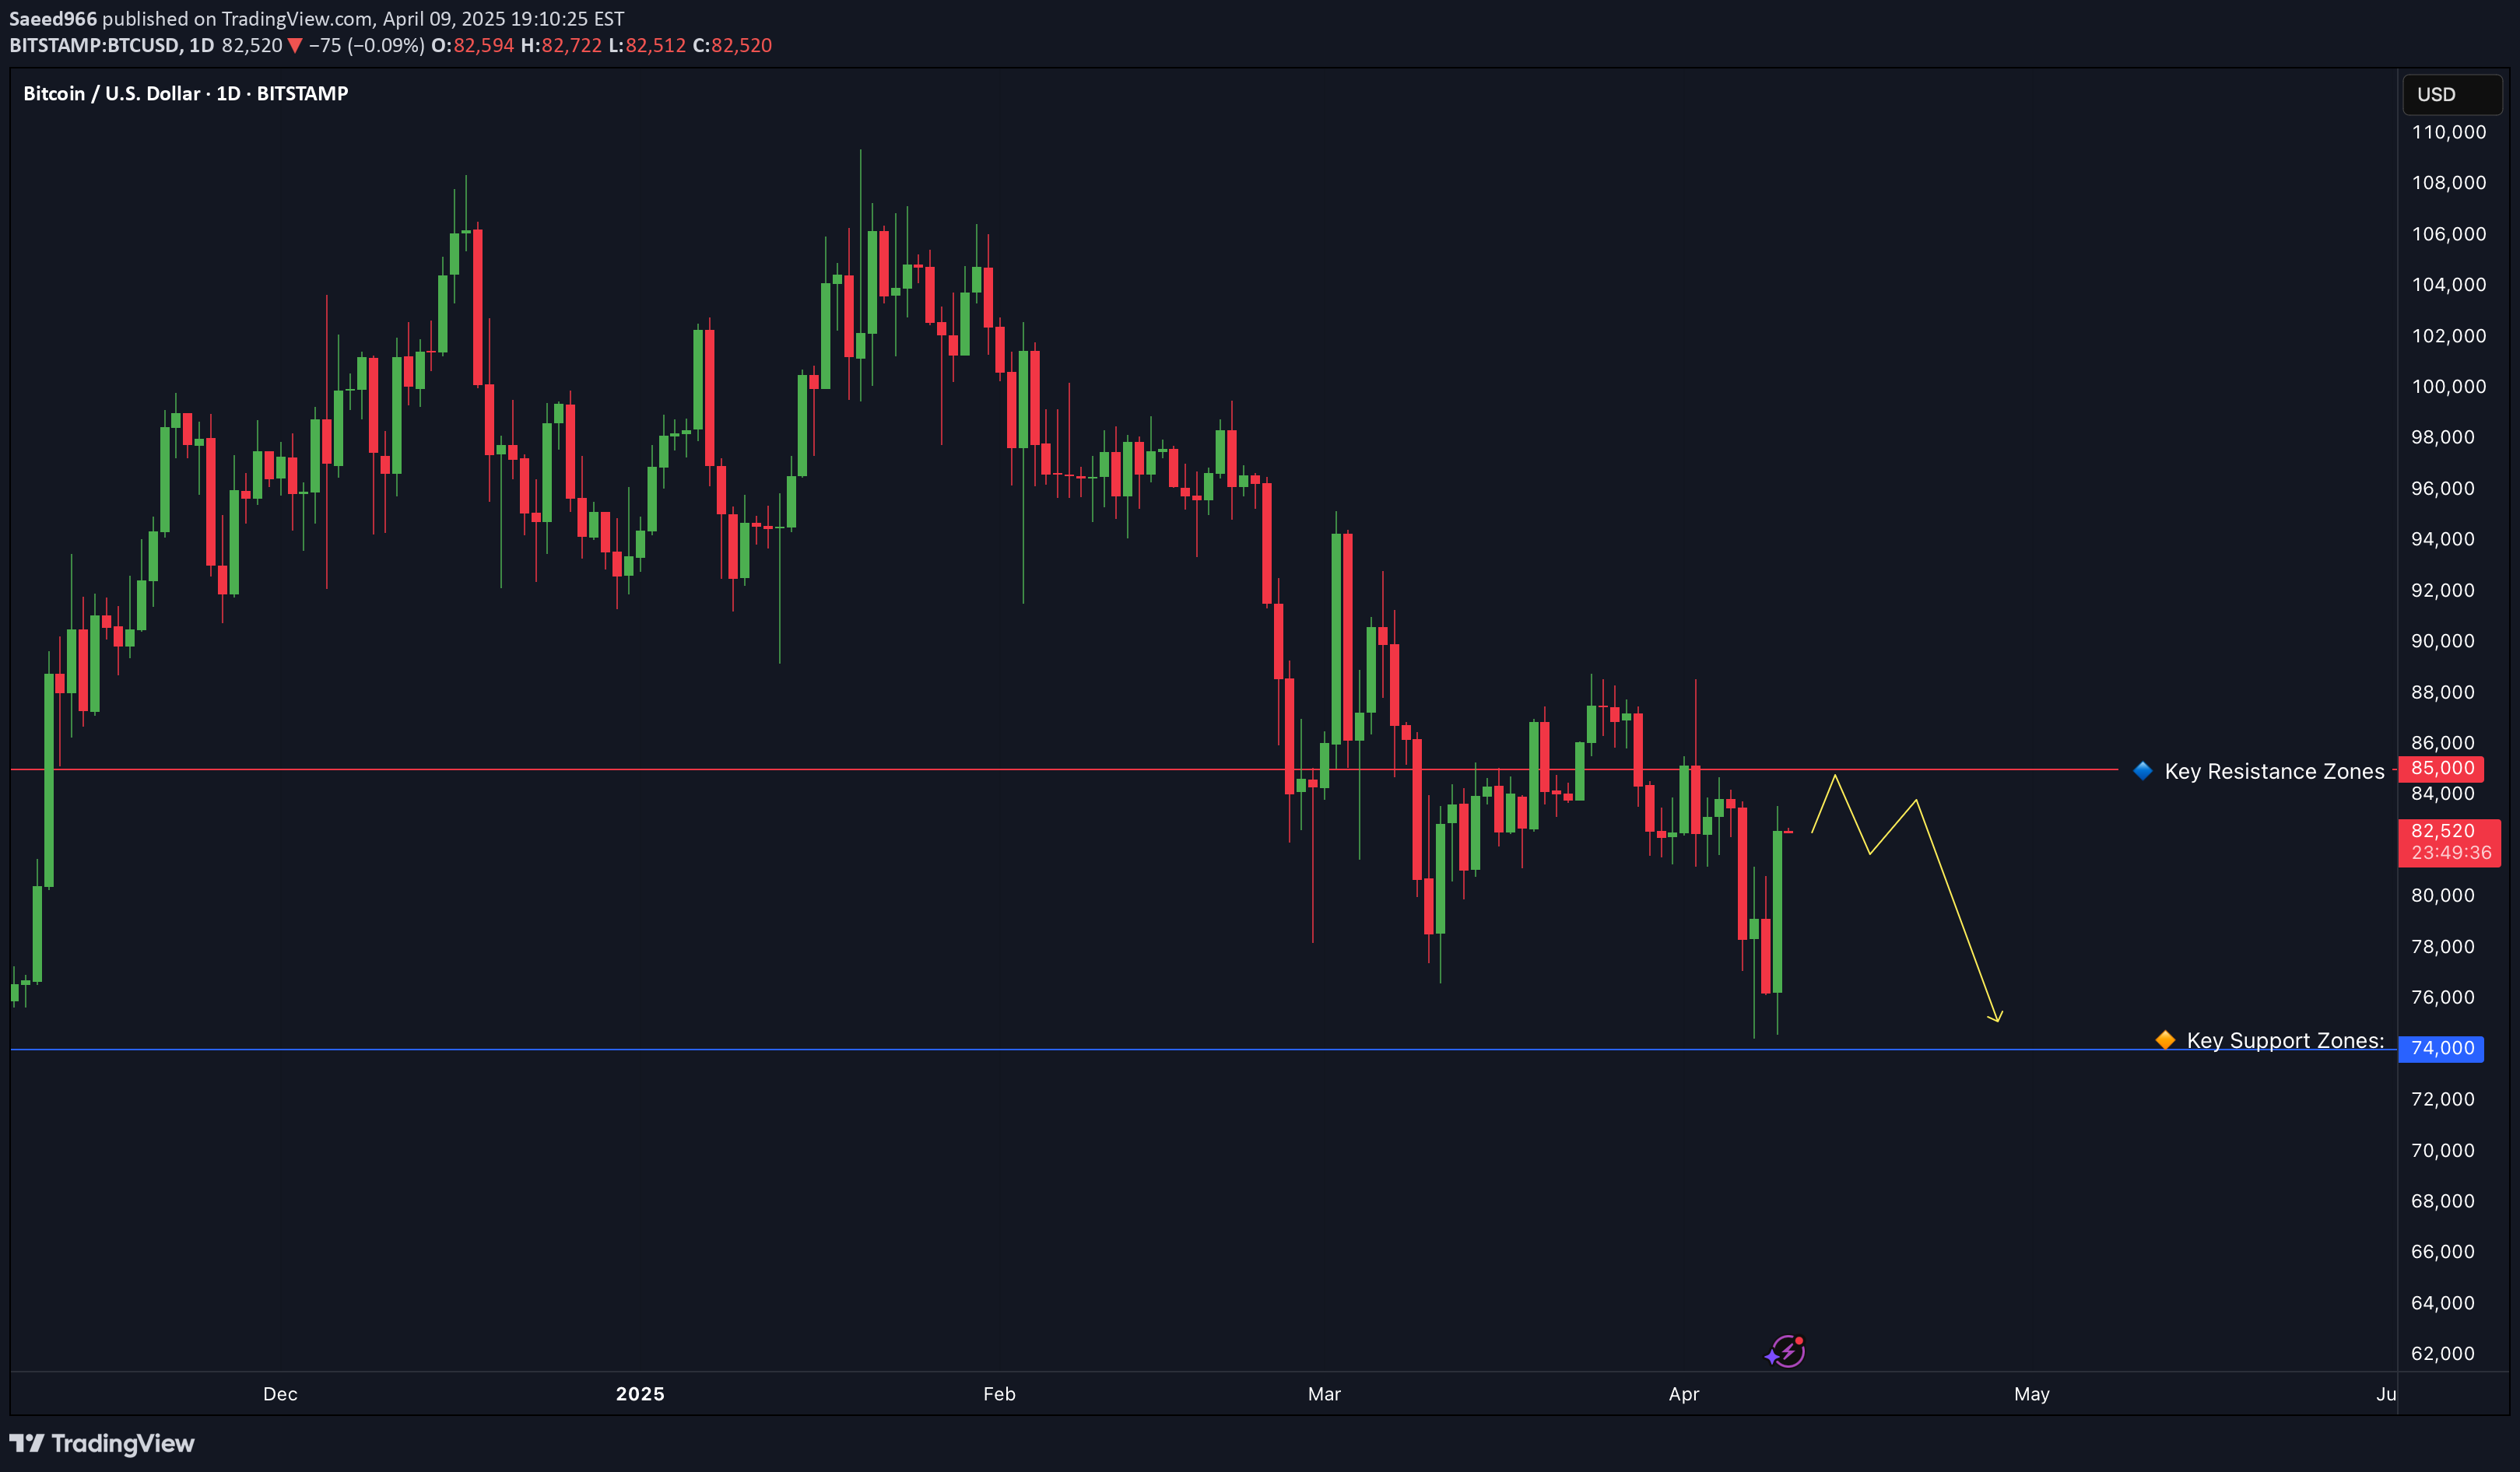
BTC/USD Daily Technical Outlook – April 9, 2025 Bitcoin is currently consolidating just below the psychological $85,000 level after a historic bull run that pushed price to fresh all-time highs. The market is cooling off — not crashing — with price action forming a high-tight flag, often a continuation signal after a vertical move. However, with momentum slowing and volatility compressing, traders must prepare for a major breakout or breakdown in the coming days. 📈 Trend Structure: BTC/USD remains in a strong bullish trend. Since the breakout above $69,000 (previous ATH from 2021), the rally has been aggressive and directional — barely giving bears a chance to breathe. Price has formed a series of higher highs and higher lows, respecting a steep ascending trendline since early February. But now, the pair is coiling near the highs, forming a tight range between $80,000 and $83,500. 🔹 Key Resistance Zones: $83,500 – $85,000: Immediate resistance; this area has capped price multiple times in recent sessions. A daily close above this zone could trigger the next leg higher. $88,000: Near-term bullish target based on measured move from recent consolidation. $90,000 – $92,000: A psychological milestone — and a possible magnet for price if bulls break out cleanly. 🔸 Key Support Zones: $80,000: Round number support — the floor of the current consolidation. $76,500: Previous breakout zone and minor demand area. $72,000 – $74,000: Major support and ideal re-test level if BTC corrects — where many sidelined bulls are likely waiting to buy in. 📐 Technical Pattern: Bitcoin is forming a high-tight flag — a bullish continuation pattern typically found after strong vertical rallies. The range is tightening, volume is dropping, and volatility is compressing — classic signs that a volatility expansion is coming soon. A breakout above $83,500–85,000 would confirm the flag and likely ignite a sharp move to 88K or higher. On the flip side, a breakdown below $80K could send price to retest $76.5K or even $74K — which would still be healthy within the broader trend. 🧭 Scenarios to Watch: ✅ Bullish Scenario: A breakout and daily close above $85,000 would confirm the continuation pattern, targeting $88,000 first, then $90,000+. Volume and candle structure will be key to confirming the move. ❌ Bearish Scenario: If price fails to break out and instead drops below $80,000, a correction could unfold toward $76,500 or even $74,000 — presenting a potential re-entry opportunity for long-term bulls. 📌 Conclusion: Bitcoin is trading near all-time highs in a classic consolidation phase. Price action favors the bulls, but the breakout hasn’t confirmed — yet. Whether BTC breaks above $85K or drops below $80K will likely define the next major swing. As always, let the candles tell the story — and don’t chase, wait for confirmation. 💬 Are we about to see Bitcoin above $90K? Or is this distribution in disguise? Drop your thoughts 👇
