Technical analysis by Saeed966 about Symbol ETH: Sell recommendation (4/10/2025)

Saeed966
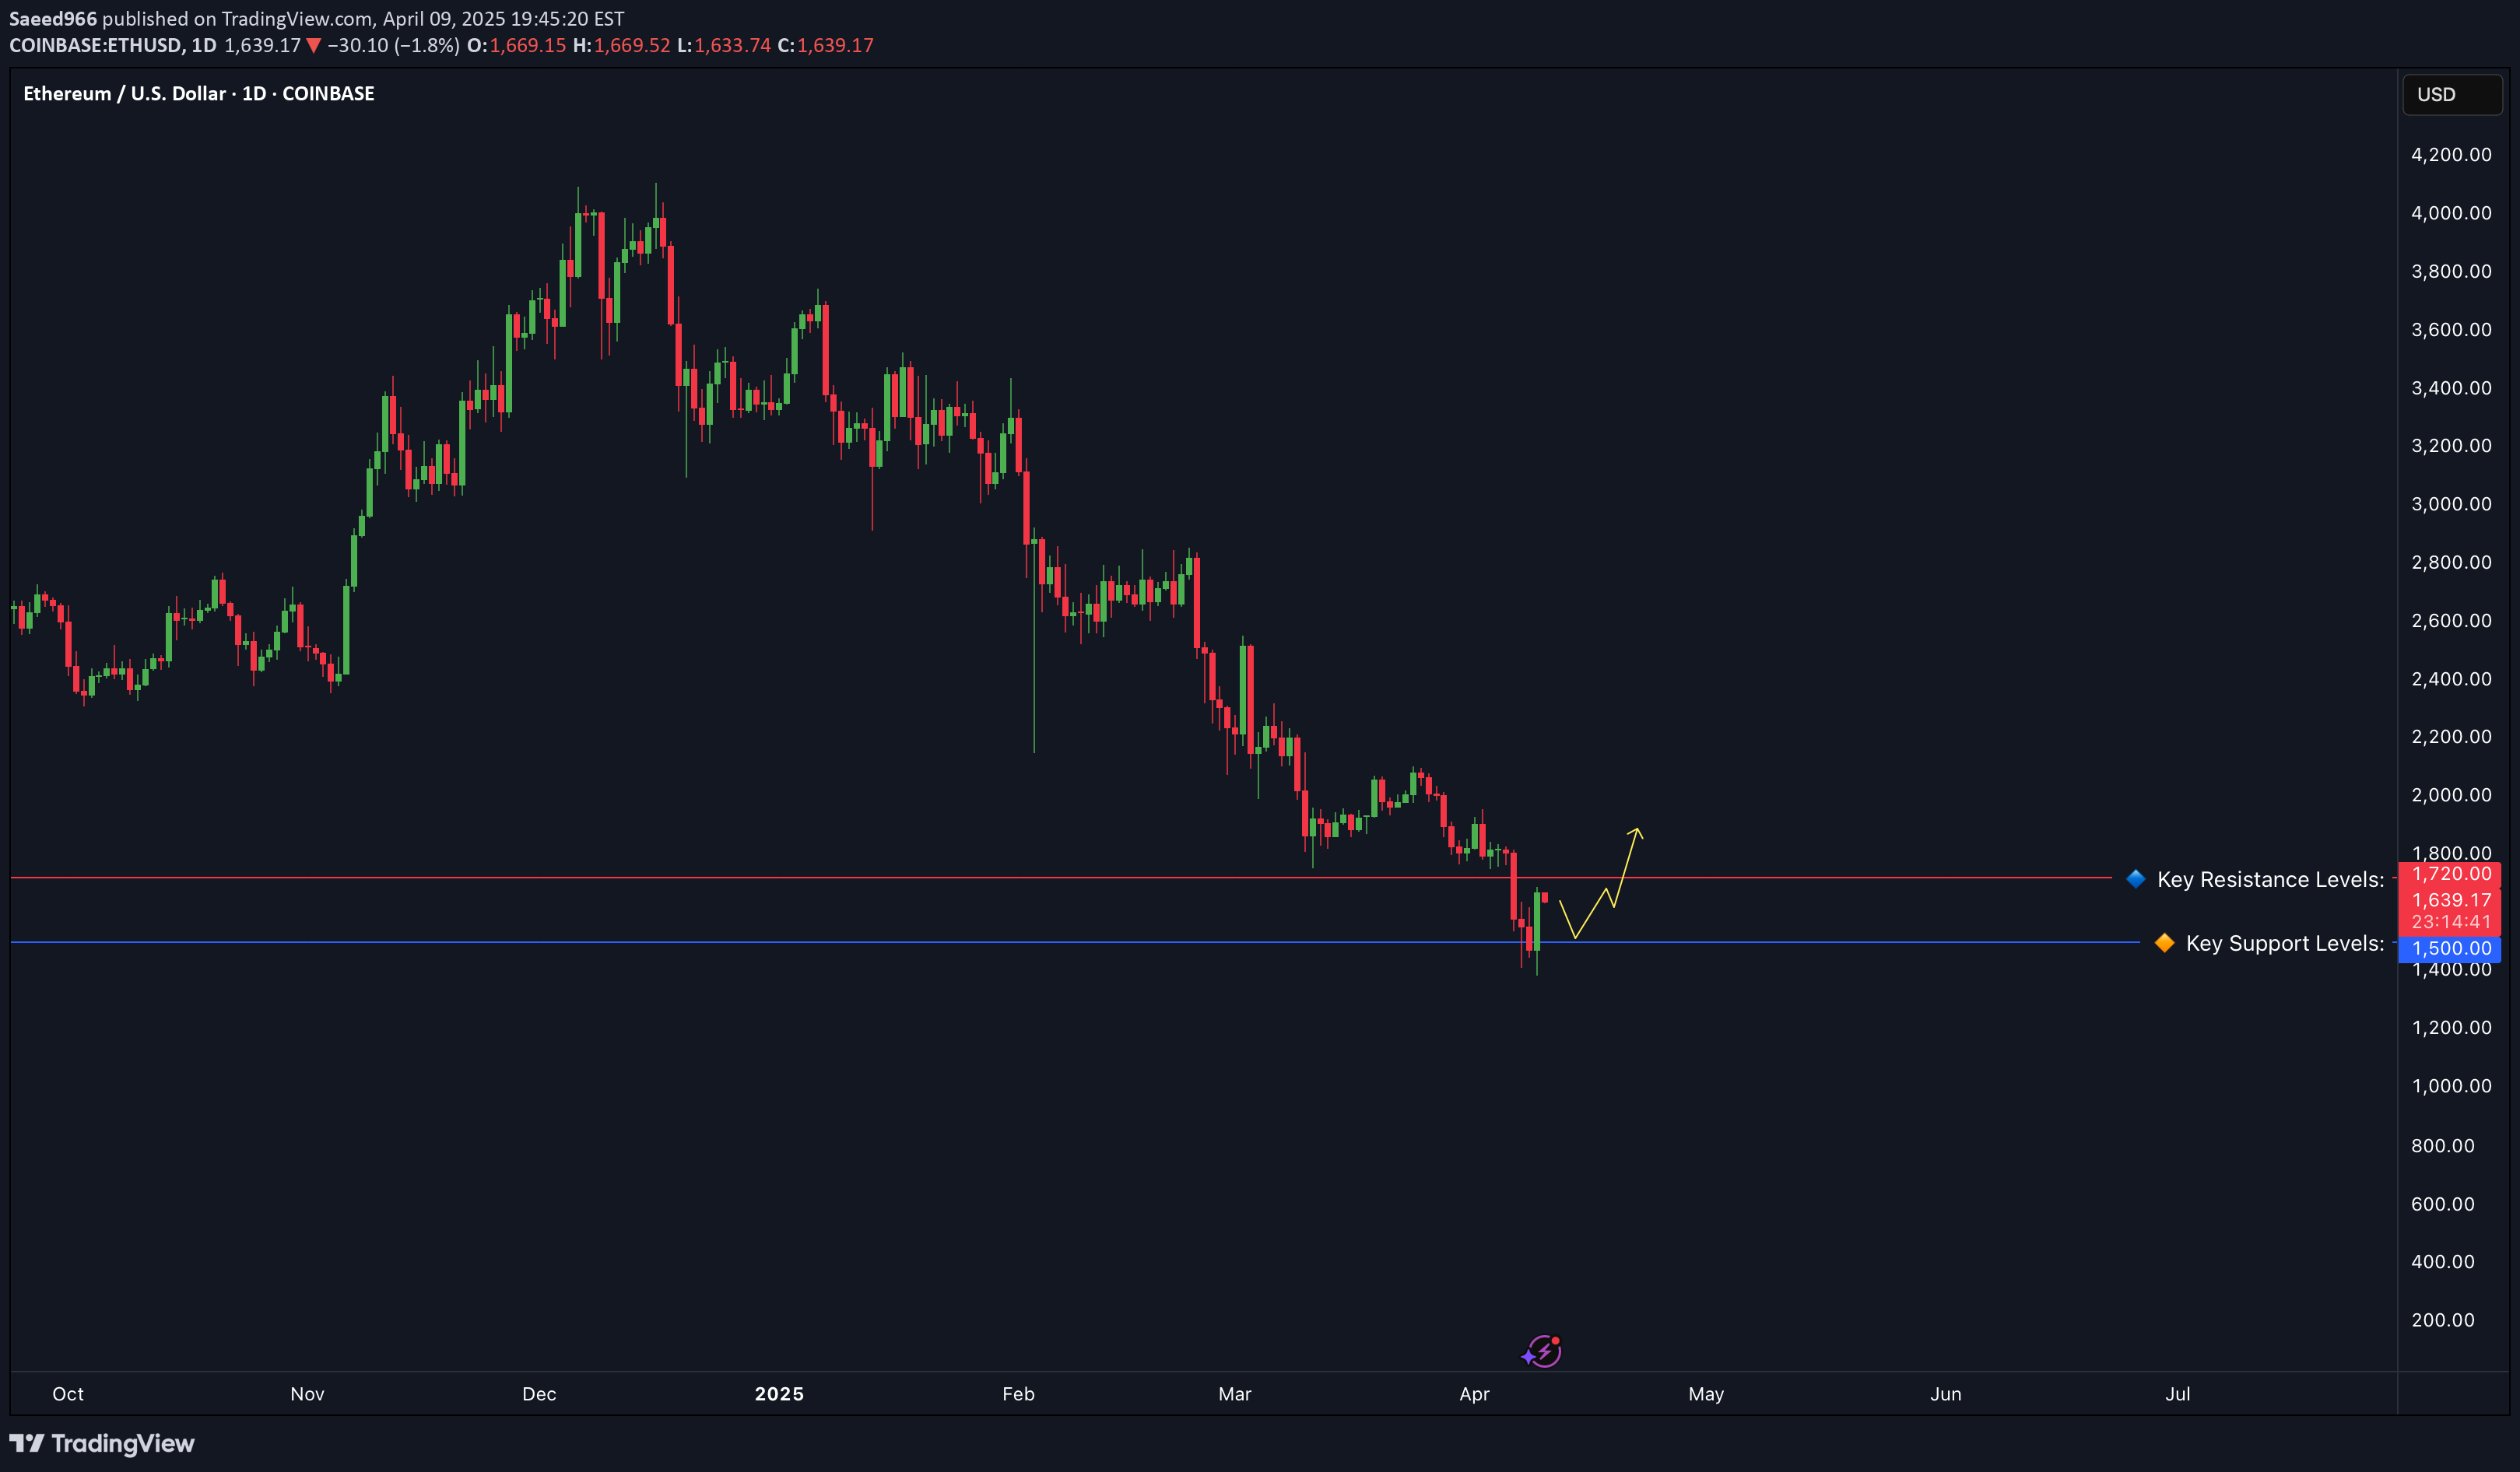
📊 ETH/USD Daily Technical Outlook – April 9, 2025 Ethereum is currently trading around $1,649, facing resistance near the $1,700 level. After a decline from the $1,800 region earlier this month, ETH/USD has been attempting to find support and establish a base. The market is at a critical juncture, with price action suggesting a potential reversal or further downside movement. CoinCodex 📈 Current Market Structure: ETH/USD has been in a downtrend since reaching highs near $1,800 in early April. The pair has formed a series of lower highs and lower lows, indicating bearish momentum. Currently, the price is consolidating just below the $1,700 resistance, suggesting indecision among market participants. 🔹 Key Resistance Levels: $1,700 – $1,720: Immediate resistance zone. A break above this area could signal a potential reversal and open the door for further gains. $1,800: Previous support turned resistance. A move above this level would indicate a shift in market sentiment. 🔸 Key Support Levels: $1,600: Psychological support level. A break below this could lead to increased selling pressure. $1,500: Major support zone. Holding above this level is crucial for bulls to prevent further declines. 📐 Price Action Patterns: Ethereum's recent price action suggests the formation of a descending triangle, a bearish continuation pattern. The horizontal support around $1,600 combined with descending highs indicates that sellers are gaining control. A decisive break below the $1,600 support could lead to a measured move targeting the $1,500 area. 🧭 Potential Scenarios: ✅ Bullish Scenario: If ETH/USD breaks above the $1,700 resistance with strong volume, it could signal a reversal, targeting the $1,800 level. This move would require a shift in market sentiment and increased buying interest. ❌ Bearish Scenario: A break below the $1,600 support could lead to further declines, with the next target around $1,500. This scenario would confirm the descending triangle pattern and suggest continued bearish momentum. 📌 Conclusion: Ethereum is at a pivotal point, trading just below key resistance at $1,700. The formation of a descending triangle suggests a bearish bias, but a break above resistance could invalidate this pattern. Traders should monitor these key levels closely and watch for a decisive move to determine the next directional bias. 💬 Do you think Ethereum will break above $1,700, or is further downside ahead? Share your thoughts below 👇
