
SaMa101
@t_SaMa101

What symbols does the trader recommend buying?
Purchase History
پیام های تریدر
Filter
SaMa101
خريطة طريق البتكوين خلال الأيام القادمة BTC

Btcusd Daily analysis (Daily) The general trend: Currently rising (price above all averages). But he started showing short -term weaknesses. Technical indicators: MACD: The beginning of a negative intersection (the highway below the signal line + the negative hurdram). This is a preliminary indication of the weakening of the rising momentum, but it needs to be confirmed by breaking a strong support or continuing to decline. Animated averages: EMA 20 = 116200 (very close to price). The price is still higher than the four averages ... the general trend is still ascending. EMA 20 will be the first moving support very important, and breaking it down may change the short view. RSI: At 59 .. is still in the positive area (higher than 50). But its descent from the top means that the rising momentum began to weaken. ADX: ADX = 29.7 .. a clear and strong trend. Di+ = 26.1 higher than Di-= 12 .. The upward trend is still dominant. OBV: Negative (-342,000) .. indicates a mild or weak sale pressure. Daily Issue: 115,000 .. Very important support (the ceiling of the previous channel). EMA 20 = 116,200 .. nearby wheeled support. 109,500 .. Fibonacci support (200). Daily resistance: 131,000 .. Fibonacci resistance (200 - 1.618 window). Weekly analysis The general trend: Strong and continuous rising. The price is above all averages by a big difference, and this gives long -term support to the price. Technical indicators: MACD: It is still positive and rising, and the urban drama ... a strong weekly trend. Mediterranean: All averages are very comfortable at the price .. No fear is currently on the long direction. RSI: At 69.7 .. close to purchasing saturation, but is still in the positive area. It indicates that the price may need a truce (temporary correction) before going up again. ADX: ADX = 27.7 .. a clear trend. Di+ = 27.6 opposite Di- = 11.5 .. The upward trend is still the dominant. OBV: Distinctively (16.5 million) .. Entering liquidity and continuing to buy. Weekly invitation: 115,000 .. Main support (the same daily channel). 100,900 .. Strong Fibonacci support (window 42). Weekly resistance: 153,500 .. strong resistance Fibonacci 2.618. Re -test 115,000 levels of 115,000, and if the price holds there it may be a good purchase chance. In the event that 115,000 EMA 20 is broken, the price may go to test 109,500. Prayers Action: The presence of candles with upper tails indicates a price rejection above 118k -120K. There has not yet been a strong hippocker, but if it appeared, it would be a confirmation of a clear weakness. If the price is fixed above 115K and a reflexive candle appears, such as: Pin Bar or hammer. Or an emerging English candle. This will give a new entry opportunity and the target 131,000 Here the danger begins: Model and wrap point No. 5 are activated The goal of the model is 72K. It means approximately 40% Notes and warning: The model is 100% uncertain for point 5 actually formed + Price action appears to confirm the reflection. Entry is sold before pointing 5 is dangerous, especially since the general trend is still rising. If the upper limit of point 5 is penetrated and the momentum continues, the model will fail, and the movement will turn into a wider emerging channel or an additional wave extension. But if this model is confirming with a reflection-action Pracen, it may open the door for a technical landing towards a 1-4 line, which corresponds to the support areas around 70,000-72,000. But in the event of a clear penetration of the point 5 ascends and the continuation of momentum, the model is considered a luminous and indicates the acceleration of a new wave.
SaMa101
نظرتي السلبية للبتكوين .. لماذا؟
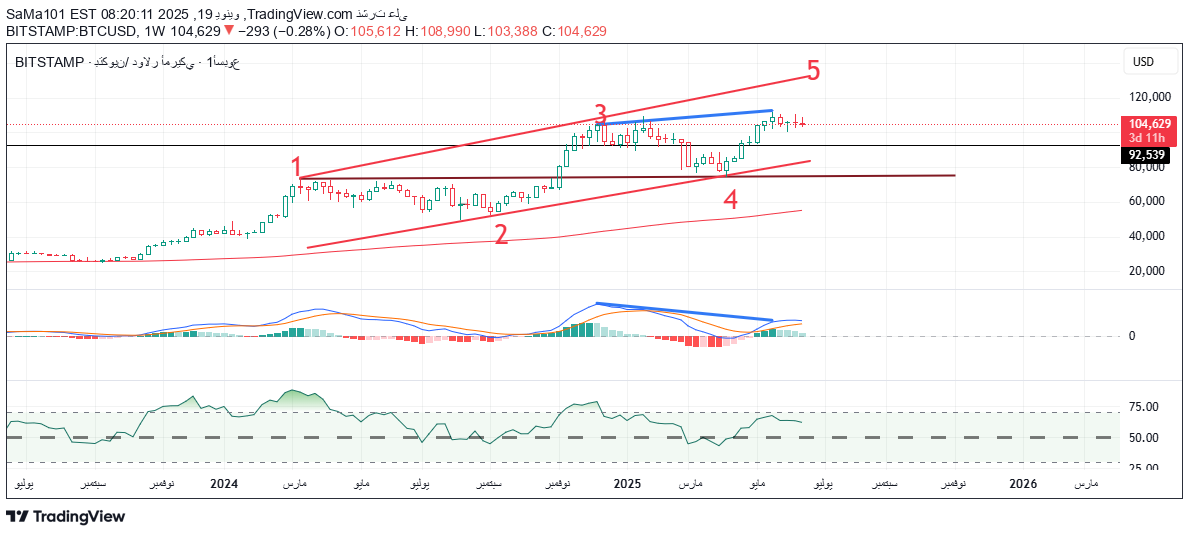
BTCUSD 1- On its way to form a form and a negative roll whose goal is 72K and this model is intended as it reached the number 5 in drawing 2- Two dual dual summits are also 72k3- decreasing the rising momentum in the MACD index in view of Histogram4- The beginning of a negative intersection between the signal line and the MACD line and this means reflection of direction 5- Davgetance negative- decreasing the momentum Rising in RSI index
SaMa101
تحديث مهم البتكوين
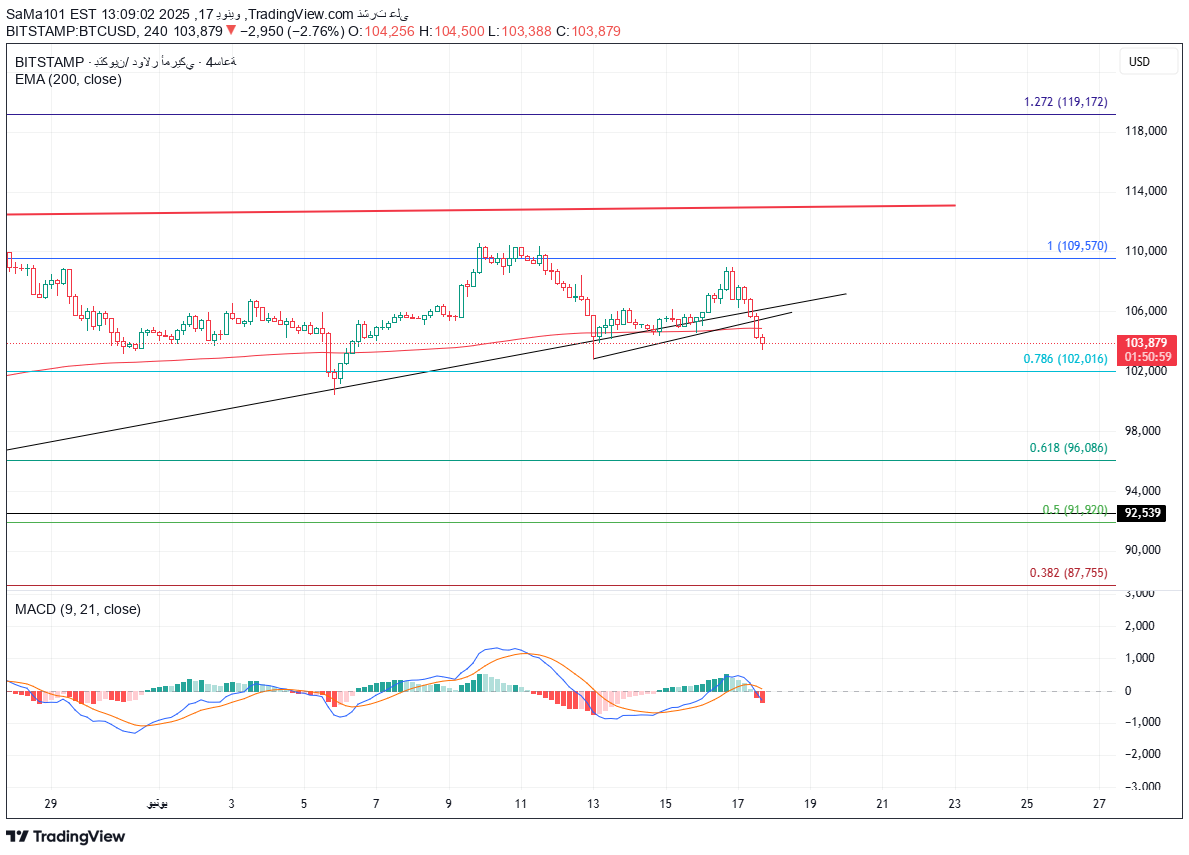
BTCUSD Bitcoin clearly descended for the period, and because of his sins with the event of bitcoin analysis gives a clearer look to the current situation and the next expectations. Summary: Current Price: 103936.19 dollars change within 24 hours: -2.68%general direction: neutral tends to rolling up indicators: RSI (relative strength index): 46.80 what is in the area Decide its orientation for the time. Dollar EMA 50: 102933.88 dollars EMA 100: 98631.55 dollars current price under EMA 10 and 20, but it is above EMA 50 and 100, and this is clear that there is a contradiction between directions, no is 100% descending or rising net. Paulinger transactions: upper limit: 109869.94 Middle Line: 105776.00 The bottom limit: 101682.06 price. Then below the midfield, and this gives a negative significance. The fluctuation index (ATR): ATR = 3078.40 and this means that the market has a clear volatility, and the movement is strong. = 103125.39 (near support) Voo 38.2% = 104815.07 (first resistance) VoPo 50.0% = 106180.70 Febo 61.8% = 107546.33 Vobo 78.6% = 109490.62 is the closest support currently at 103125.39 and the nearest resistance at 104815.07 forecasts come (by data): direction: direction: direction: direction: direction: direction General: Rising in the short and medium term for the expected change of change: +5.58% during the coming days, the fluctuation level: average to high (ATR high) possible scenario: based on the technical situation and indicators, we can see strong fluctuations in the coming days. It is a possibility that the negative pressure continues, but after that it may become a rising bounce of the nearby resistors (especially 104815). And if expectations are like What is, the bitcoin can go back and break the resistances with time. General recommendations: for short traders: be careful, the market is volatile. Watch the resistance levels for sale, support for purchase. For long investors: the current descent may be an opportunity to enter or enhance your centers, but do not forget to manage your risk to your account.
SaMa101
حركة البتكوين
BTCUSD Overview: Bitcoin price moves in a strong upward trend, backed by several positive technical indicators, where the price is currently centered above the main moving averages and midfield from the Bolinger Band Index. However, some warning signals appear on momentum indicators, which requires dealing with the market with caution and activating risk management strategies. Technical analysis summary of the general trend: Raid strong price: 107,019.20 dollars support and resistance levels closest: 106,181 dollars (Fibonacci 50%) The closest resistance: 107,546 dollars (Fibonacci 61.8%) direction and momentum indicators: RSI: 52.85 (neutral) MACD: 754.95 (positive value, but with a negative intersection Under the signal line) Stochastic %K / %D: %K: 65.71 %D: 55.68 (average momentum with a possible signal for correction) The price is traded above all moving averages and this is a positive indicator Bolinger Band: the price above the midfield (positive) upper limit: 110,081.94 dollars the bottom: 101,877.24 dollars the fluctuation index (ATR) ATR: 2,781.18 dollars (average fluctuation) Size: Volume: 149,638,214.4 (indicates remarkable interest in the market, and the continuation of the current trend supports) possible scenarios (The upper limit of Polynes Band). 🔽 Detabent scenario: If the signal signals continue from MACD, the price may go to subsidies 106,181 dollars, with the possibility of Test for Bolinger as secondary support. Recommendations: Purchase: Possible, but with caution, with the status of an appropriate loss of loss. Selling: for the short -term speculators, partial profit can be considered to reduce risks. Control: It is necessary to follow the price movements near the levels of support and resistance, with a focus on momentum indicators to confirm the next direction.
SaMa101
ِAVAX اتجاه أفاكس قصير المدى
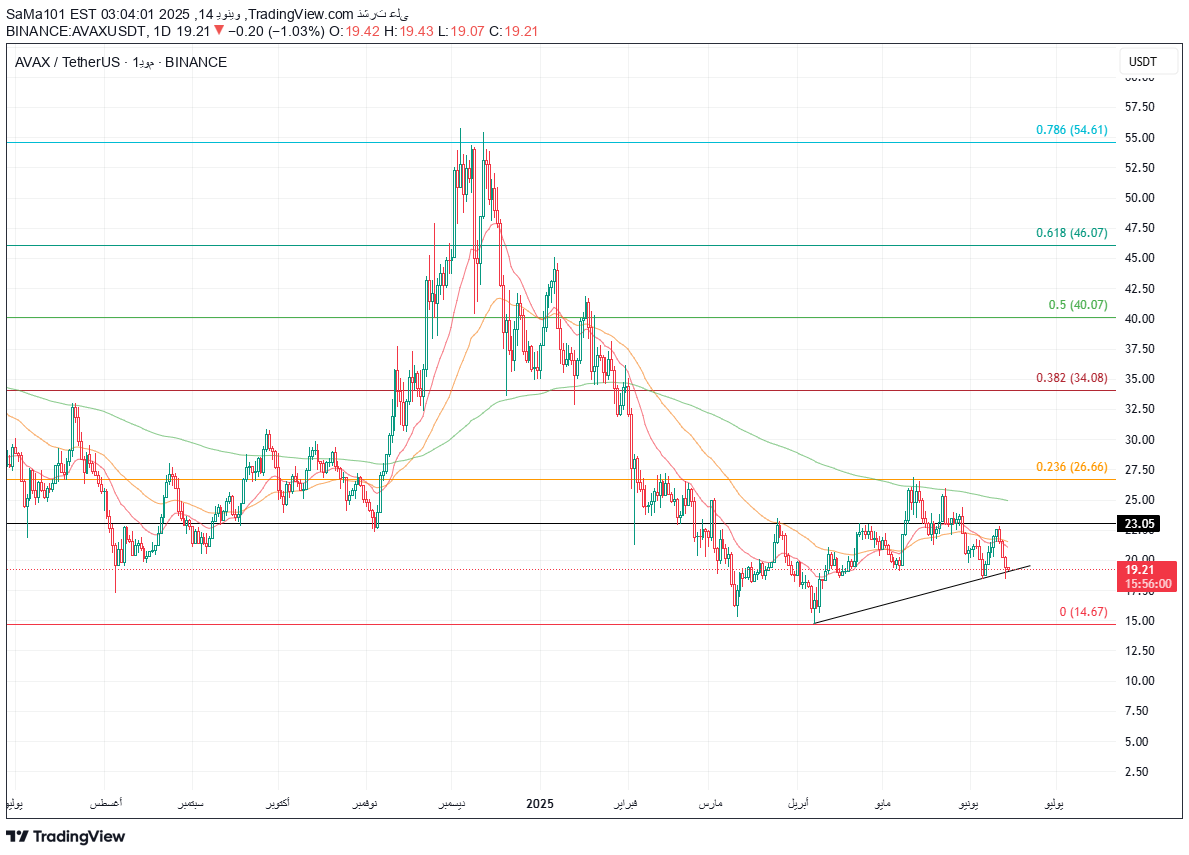
Avaxusdt Avaksalcalad the current price of $ 19.22 🔴 In front of it is critical support for about $ 19 and it crosses a critical line of breaking it means: 15-16 $ 🟢 Positive: touching the bottom of a rising trend line and I wanted targets: penetration of $ 23 Yadia $ 27-30, but if he breaks $ 19, $ 15-16, however, at this price, see Davir positive for more than one indicator.
SaMa101
سولانا SOL
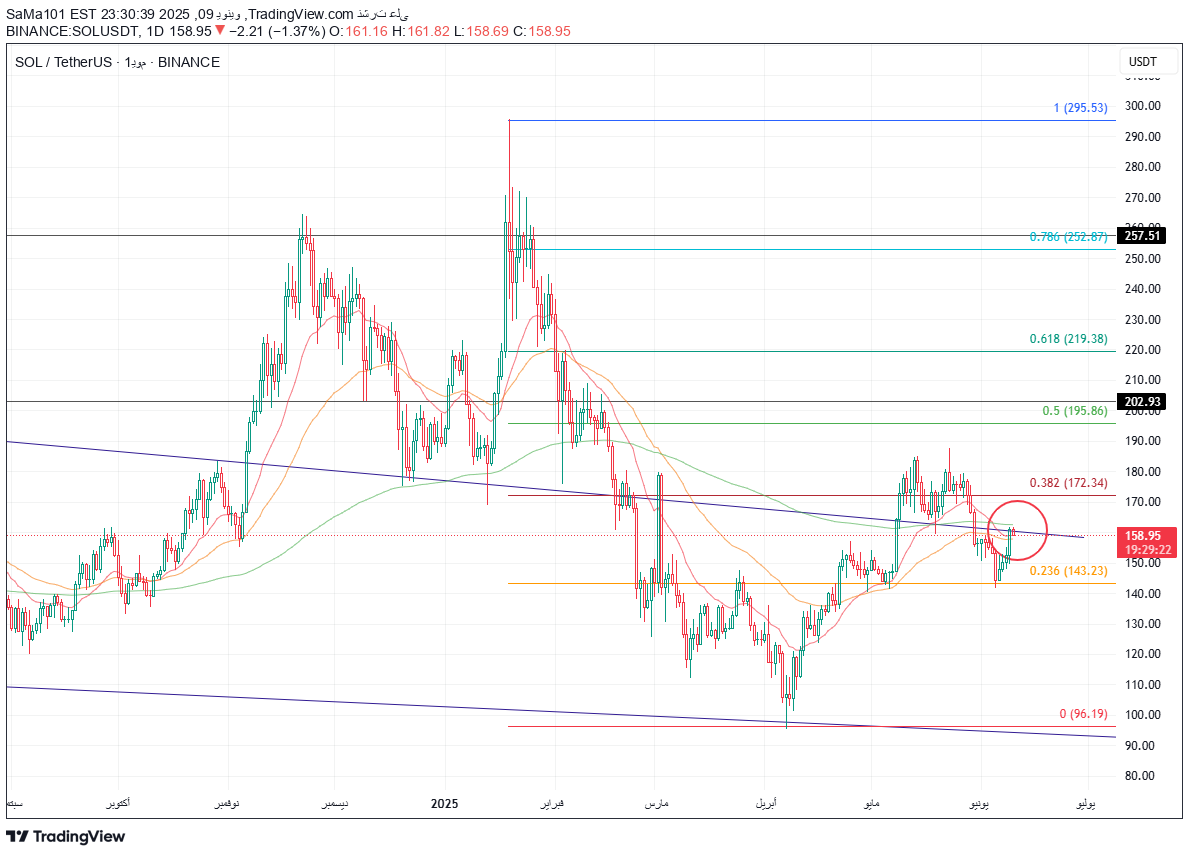
Solusdt Solanna Price: $ 159.17 (+1.86% last 24 hours). General direction: rising, but there are signs of sale that require caution. Technical indicators: moving averages (EMA): the price above the averages (10, 20, 50, 100), and this enhances the rising trend. RSI (RSI): currently at 49.72, means the market is not in a purchase area Excessive and excessive sale. Purchase. fluctuations: Bolins Bands: The price is under the middle line, and this can indicate a negative direction in the short term. The real -term average index (ATR): its value is 8.00, it means high fluctuation in the market, large trading opportunities but the risks are higher. Fools: Stochastic Oscillator: Values %K and %D Ne neutral, meaning there are no strong indications of purchase or Selling. Summary and expected scenarios: If the price goes up: If the price maintains the support level at 159 dollars, the resistance may be tested at $ 165, ولو exceeding it is possible Malik. Selling: I can think about it if it is confirmed that the support level is confirmed 159 dollars. A final advice: SOL has a strong upward trend, but we must monitor the signals of the Maccing and the main support levels. Risk management is very important in light of the current fluctuations.
SaMa101
البتكوين ( يومي + 4H) ليوم 10/6/2025
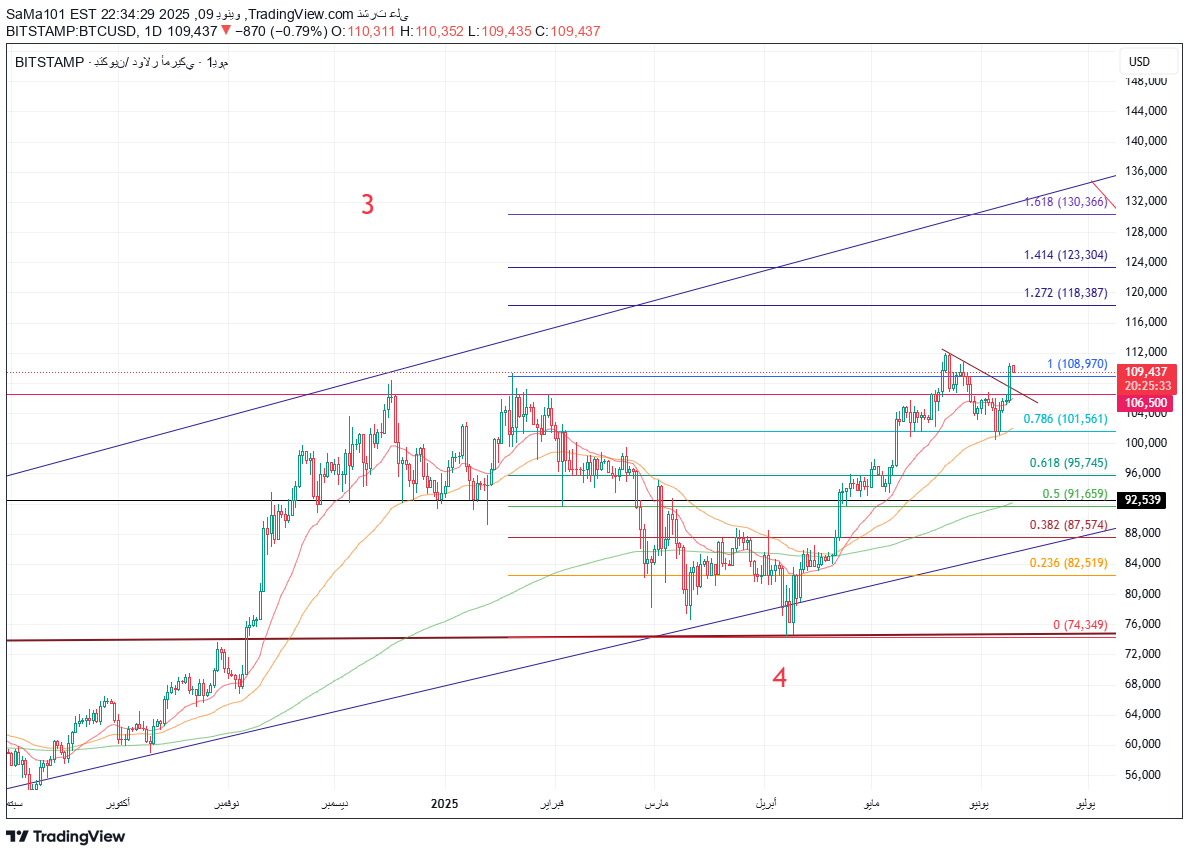
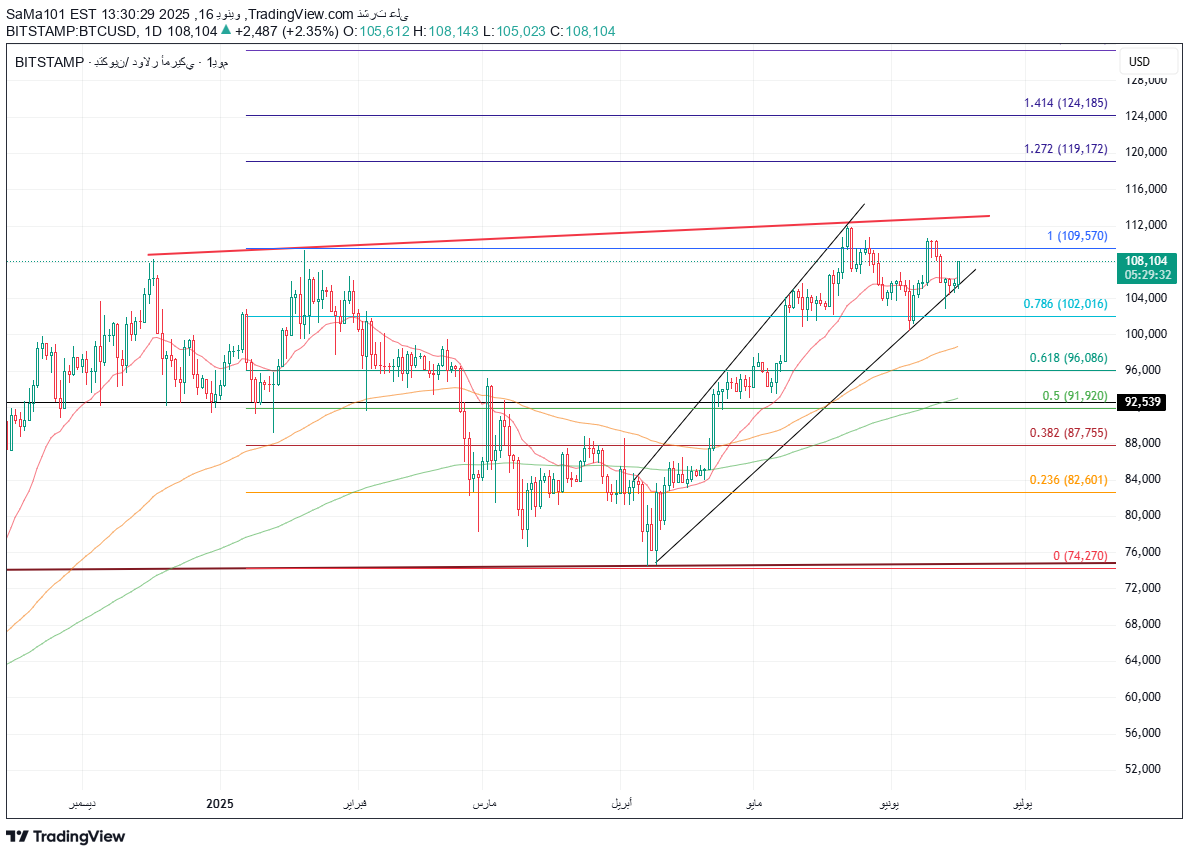
BTCUSD Time Frame: 4 hours ✅ An important descending trend has been broken, with confirmation of the hack over 108,970 (Fibonacci 1.0) ✅ The price is trading over all averages (50, 100, 200) = positive 📈 the momentum is rising and the market tries to build a new support base above 109k.🔥 → It was respected as support. 1.0 = 108,970 → The price is now fluctuating around it. Fibonacci goals: 1.272 = 118,3871.414 = 123,3041.618 = 130,366 Mediterranean: EMA50 (red) and EMA100 (orange) and EMA200 (green) all below the price → The general direction is still Positive. The averages are hesitant, so that they are on the top. Rising Channel: The price is moving inside a clear, emerging channel (violet lines) since the wave 4. We are now near the middle of the channel, in which the field of ascension is open to the ceiling of the channel.
SaMa101
هل البتكوين يعمل False Breakout؟؟؟
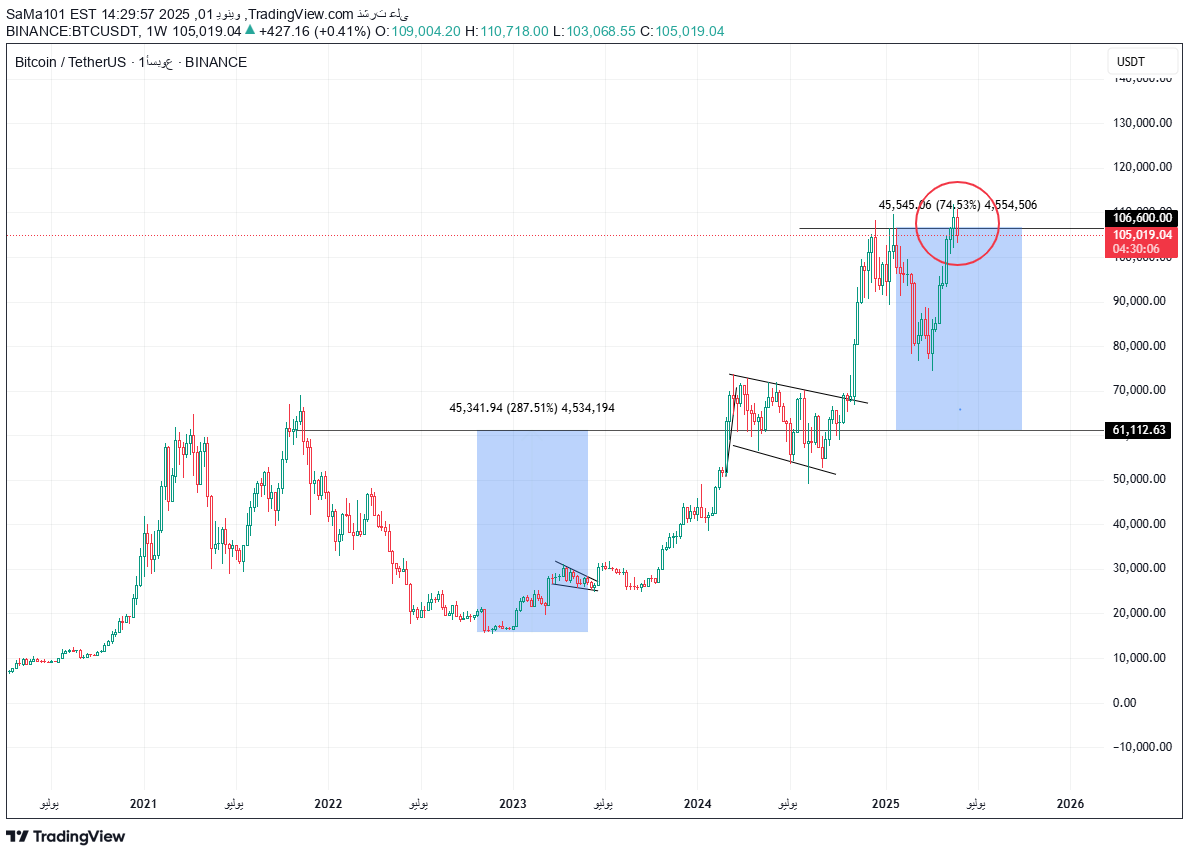
BTCUSD This is an old day, days of the price of the #Bitcoin 61K, and thank God, nothing is true for the same expectation of my blue rectangle..the this talk !! The important talk is the circle in the red color that I drew before it was a little. This was False Breakout.
SaMa101
سلبية LTC

Ltcusdt witnesses the price LTC in the daily and weekly interval a decline, as it fell under all the moving averages in only one candle, which is a clear indication of the power of the current negative momentum. The price broke an important support at $ 88.5 during today's candle, which enhances the possibility of continuing to drop in the near term. In addition, the price broke the Fibonacci level 0.382, and is currently heading towards a level 0.236 at 81 dollars, with temporary support at $ 83.5 that may provide some temporary stability. In terms of technical aspects, MCD and HMA indicators into one strategy give us a clear exit signal: MACD shows a negative intersection, indicating the transformation of the market momentum to the descending direction. Building.
SaMa101

Disclaimer
Any content and materials included in Sahmeto's website and official communication channels are a compilation of personal opinions and analyses and are not binding. They do not constitute any recommendation for buying, selling, entering or exiting the stock market and cryptocurrency market. Also, all news and analyses included in the website and channels are merely republished information from official and unofficial domestic and foreign sources, and it is obvious that users of the said content are responsible for following up and ensuring the authenticity and accuracy of the materials. Therefore, while disclaiming responsibility, it is declared that the responsibility for any decision-making, action, and potential profit and loss in the capital market and cryptocurrency market lies with the trader.