Technical analysis by SaMa101 about Symbol BTC: Buy recommendation (6/16/2025)

SaMa101
حركة البتكوين
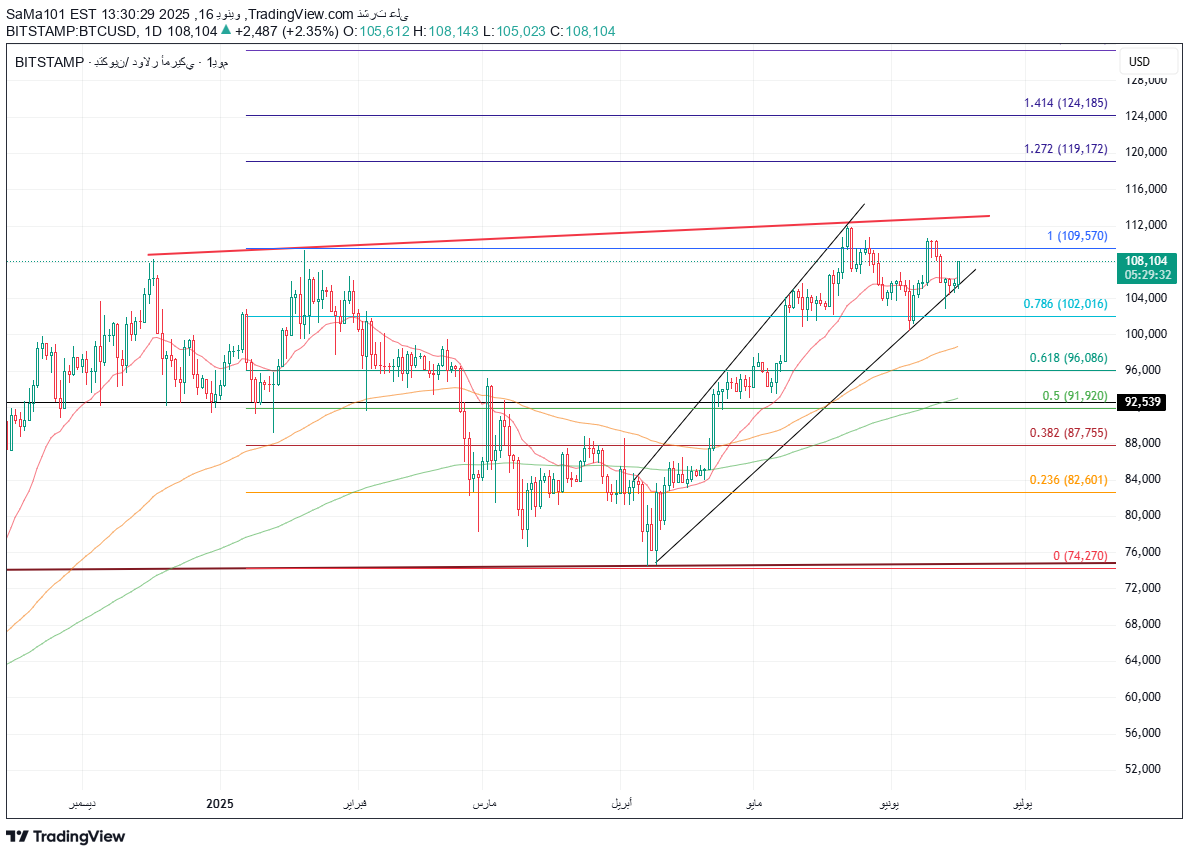
BTCUSD Overview: Bitcoin price moves in a strong upward trend, backed by several positive technical indicators, where the price is currently centered above the main moving averages and midfield from the Bolinger Band Index. However, some warning signals appear on momentum indicators, which requires dealing with the market with caution and activating risk management strategies. Technical analysis summary of the general trend: Raid strong price: 107,019.20 dollars support and resistance levels closest: 106,181 dollars (Fibonacci 50%) The closest resistance: 107,546 dollars (Fibonacci 61.8%) direction and momentum indicators: RSI: 52.85 (neutral) MACD: 754.95 (positive value, but with a negative intersection Under the signal line) Stochastic %K / %D: %K: 65.71 %D: 55.68 (average momentum with a possible signal for correction) The price is traded above all moving averages and this is a positive indicator Bolinger Band: the price above the midfield (positive) upper limit: 110,081.94 dollars the bottom: 101,877.24 dollars the fluctuation index (ATR) ATR: 2,781.18 dollars (average fluctuation) Size: Volume: 149,638,214.4 (indicates remarkable interest in the market, and the continuation of the current trend supports) possible scenarios (The upper limit of Polynes Band). 🔽 Detabent scenario: If the signal signals continue from MACD, the price may go to subsidies 106,181 dollars, with the possibility of Test for Bolinger as secondary support. Recommendations: Purchase: Possible, but with caution, with the status of an appropriate loss of loss. Selling: for the short -term speculators, partial profit can be considered to reduce risks. Control: It is necessary to follow the price movements near the levels of support and resistance, with a focus on momentum indicators to confirm the next direction.