
RolinLong
@t_RolinLong

What symbols does the trader recommend buying?
Purchase History
پیام های تریدر
Filter
RolinLong
ETHUSDT 1S Grafikte Üçgen Kırılımı ve Düşüş Sinyali
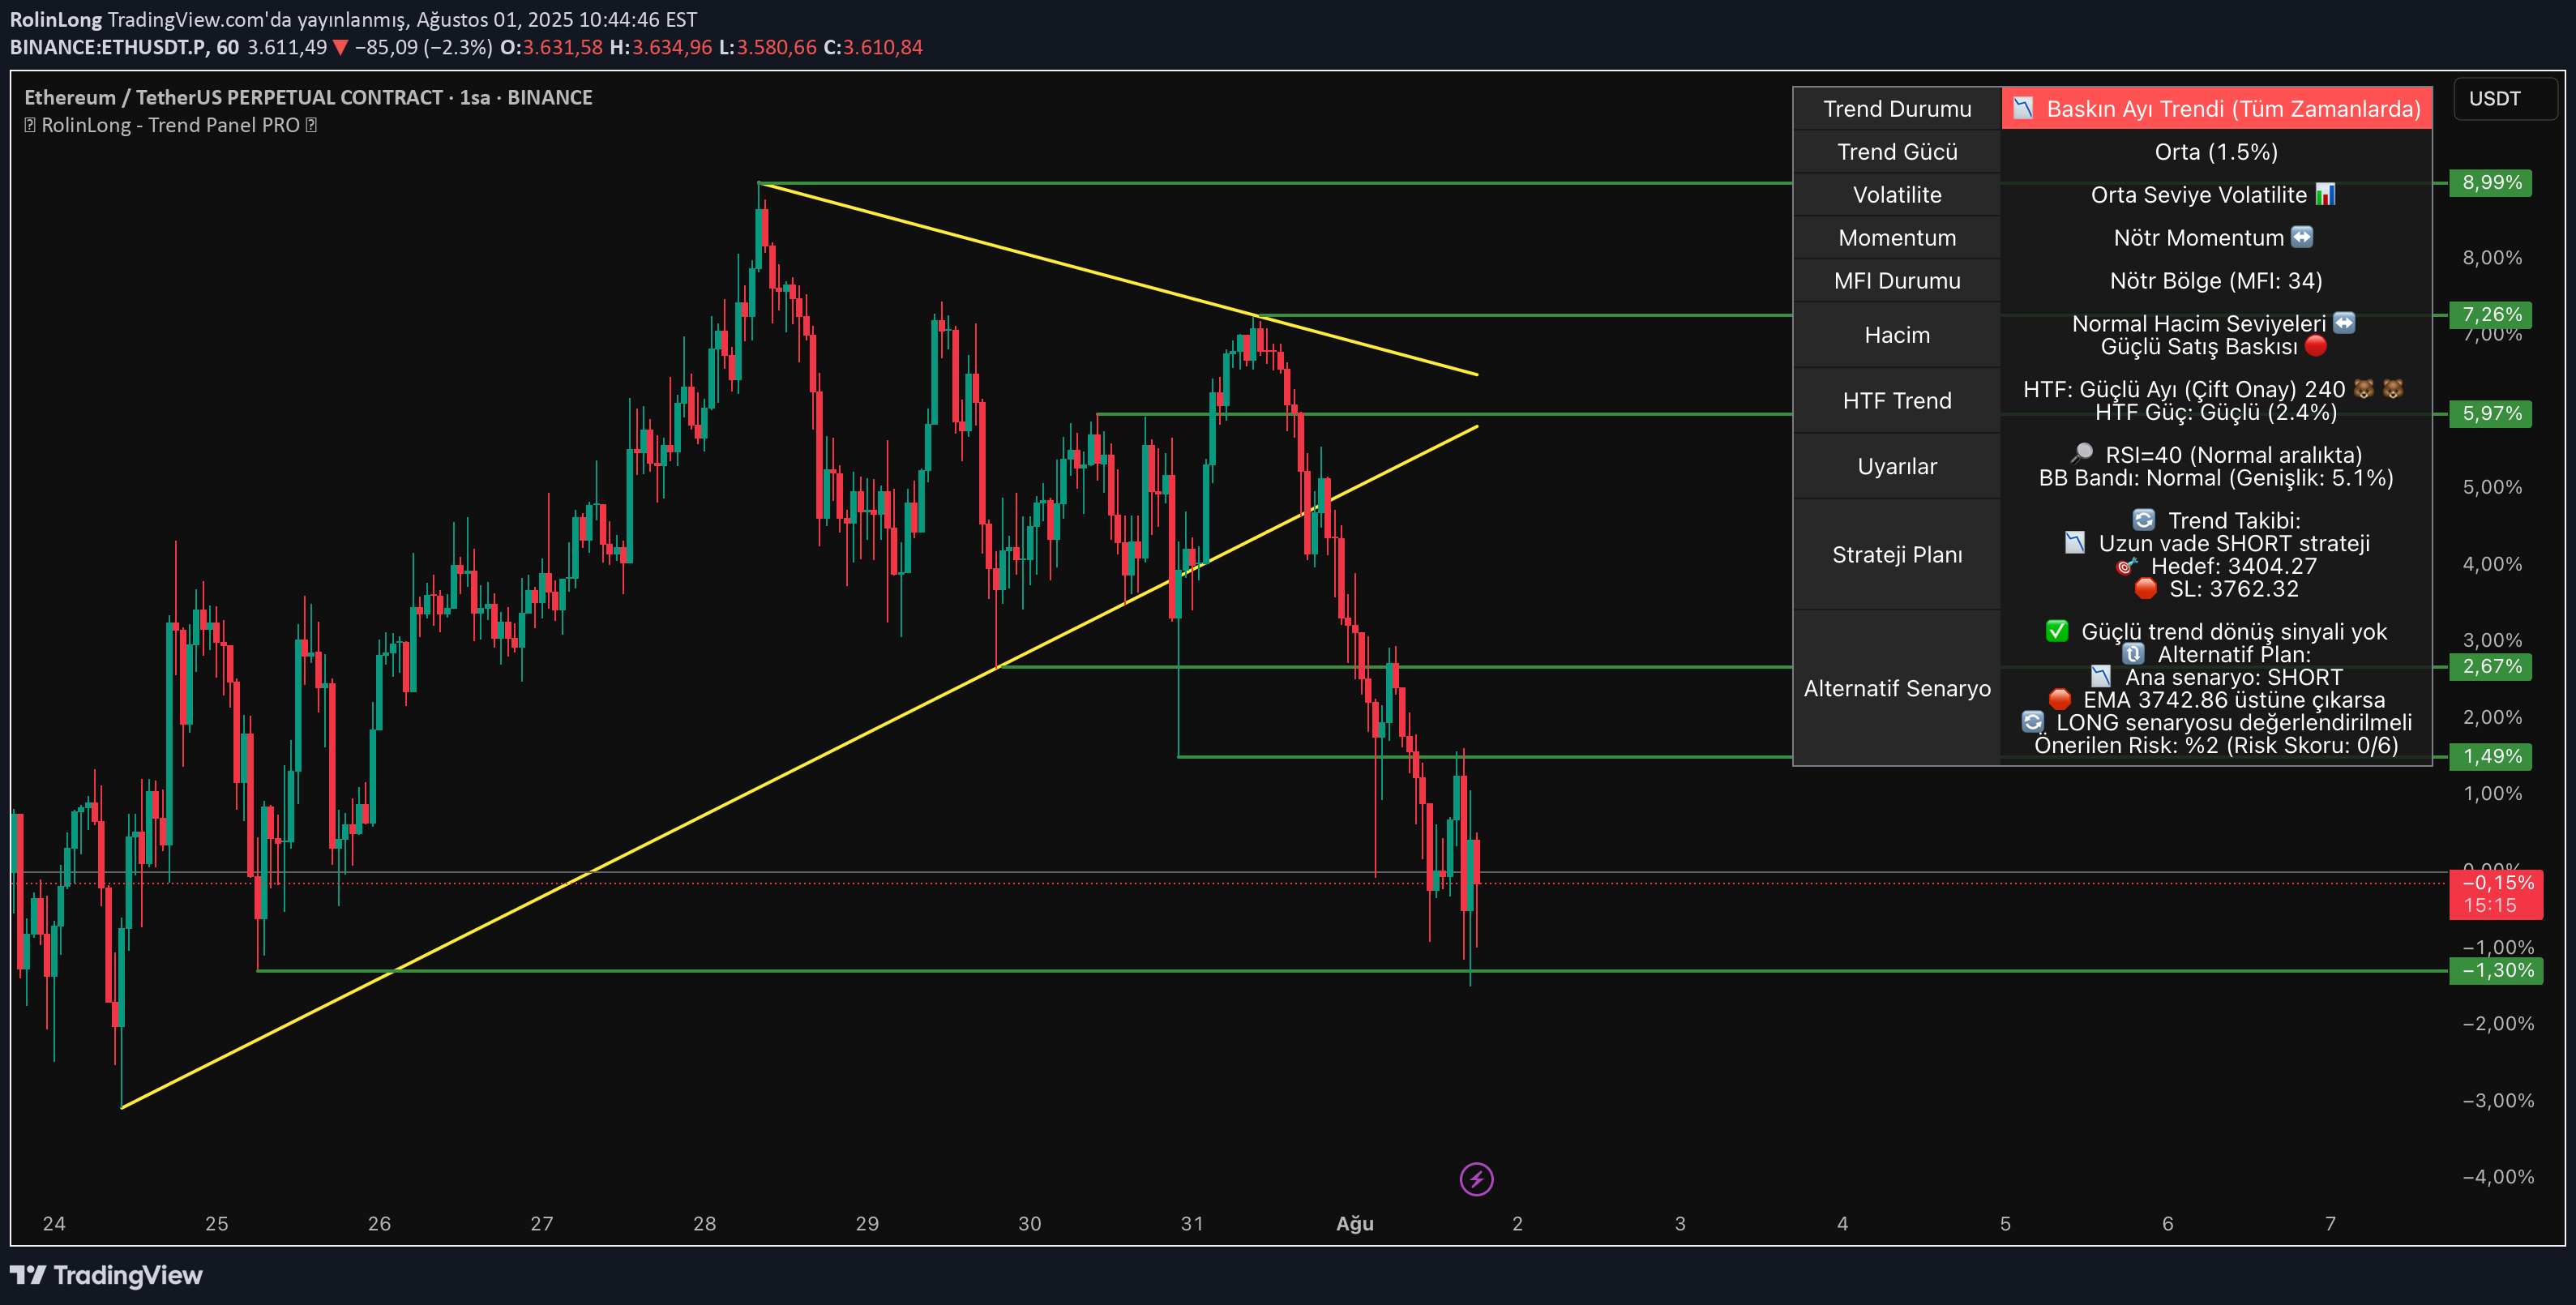
Graphic Information 📊: Parity: ETH / USDT PERPETUAL CONTRACT (Ethereum / Tetherus) Time Zone: 1 Hour Graph (1S) Instant Price: $ 3,608.27 Indicator and oscillator analysis 📈: RSI (35.84): Normal - close to the excessive sale limit. There is a possibility of return. Macd: Bearish (main line: -41.31 / signal: -40.55) -Momentum negative. ADX (45.6): The trend is strong. (This gives approval for the fall trend) CCI (-104.47): Excessive sale-reaction rise in the near term may come. Chande MO (-22.66): Negative momentum. EMA/WMA CROSS: All combinations Bearish → The downward trend continues. Taurus -Lay Power: -74.27 → Bears Judge. Volume Changes: 10 Bar: +101.30% 20 Bar: +22.19% 30 Bar: +294.82% Despite the increase in volume, the price decreases → This indicates that sales pressure is strong. Support and resistance levels 🧱: Resistances: R1: 3878 R2: 3832.61 R3: 3940.81 Supports: S 1: 3670 S 2: 3712.24 S 3: 3570.13 Trend line support was broken: rising channel broken in case of → bear market Formation Analysis 🔎: Symmetrical triangular formation frustration: Price, after the jam -oriented triangle alt Breaking the band has started a harsh decline. Bearish Continuation Pattern (Bear Continue Formation): This structure is compatible with the appearance -like appearance “Descending Triangle” specified in Goodcrypto documents. The overall appearance is down, even though the excessive sale zone is approached, although possible reaction rise. Process suggestions 💡: Short -term Short process 🔴: Entry Point: $ 3,608 (instant price) Target Price: $ 3,570.13 (S3 level) Stop-Loss: $ 3,712.24 (above S2) Success Rate: 74 %(Trend Breeding, Bearish EMA/WMA Structure) Short -term long process 🟢: Entry Point: $ 3,570 (around S3 can be expected) Target Price: $ 3,670 (S1 resistance) Stop-Loss: $ 3,520 Success Rate: 42 %(Possible to Purchase of Response, but the main trend is still down) Risk Management and Strategy ⚠️: Although the over -selling zone is approached, long positions should be taken carefully because the trend is downward. EMA/WMA and Momentum indicators support the decline. Stop-Loss levels should be kept dar because volatility may increase. ⚠️ Process Suggestion ⚠️: Short ⚠️ Graphic suggestion ⚠️: It is recommended that you do this parity. Technically, a strong decline formation is available and sales pressure is clearly felt.
RolinLong
Bitcoin 1S Grafikte OBO Formasyonu ve Trend Kırılımı
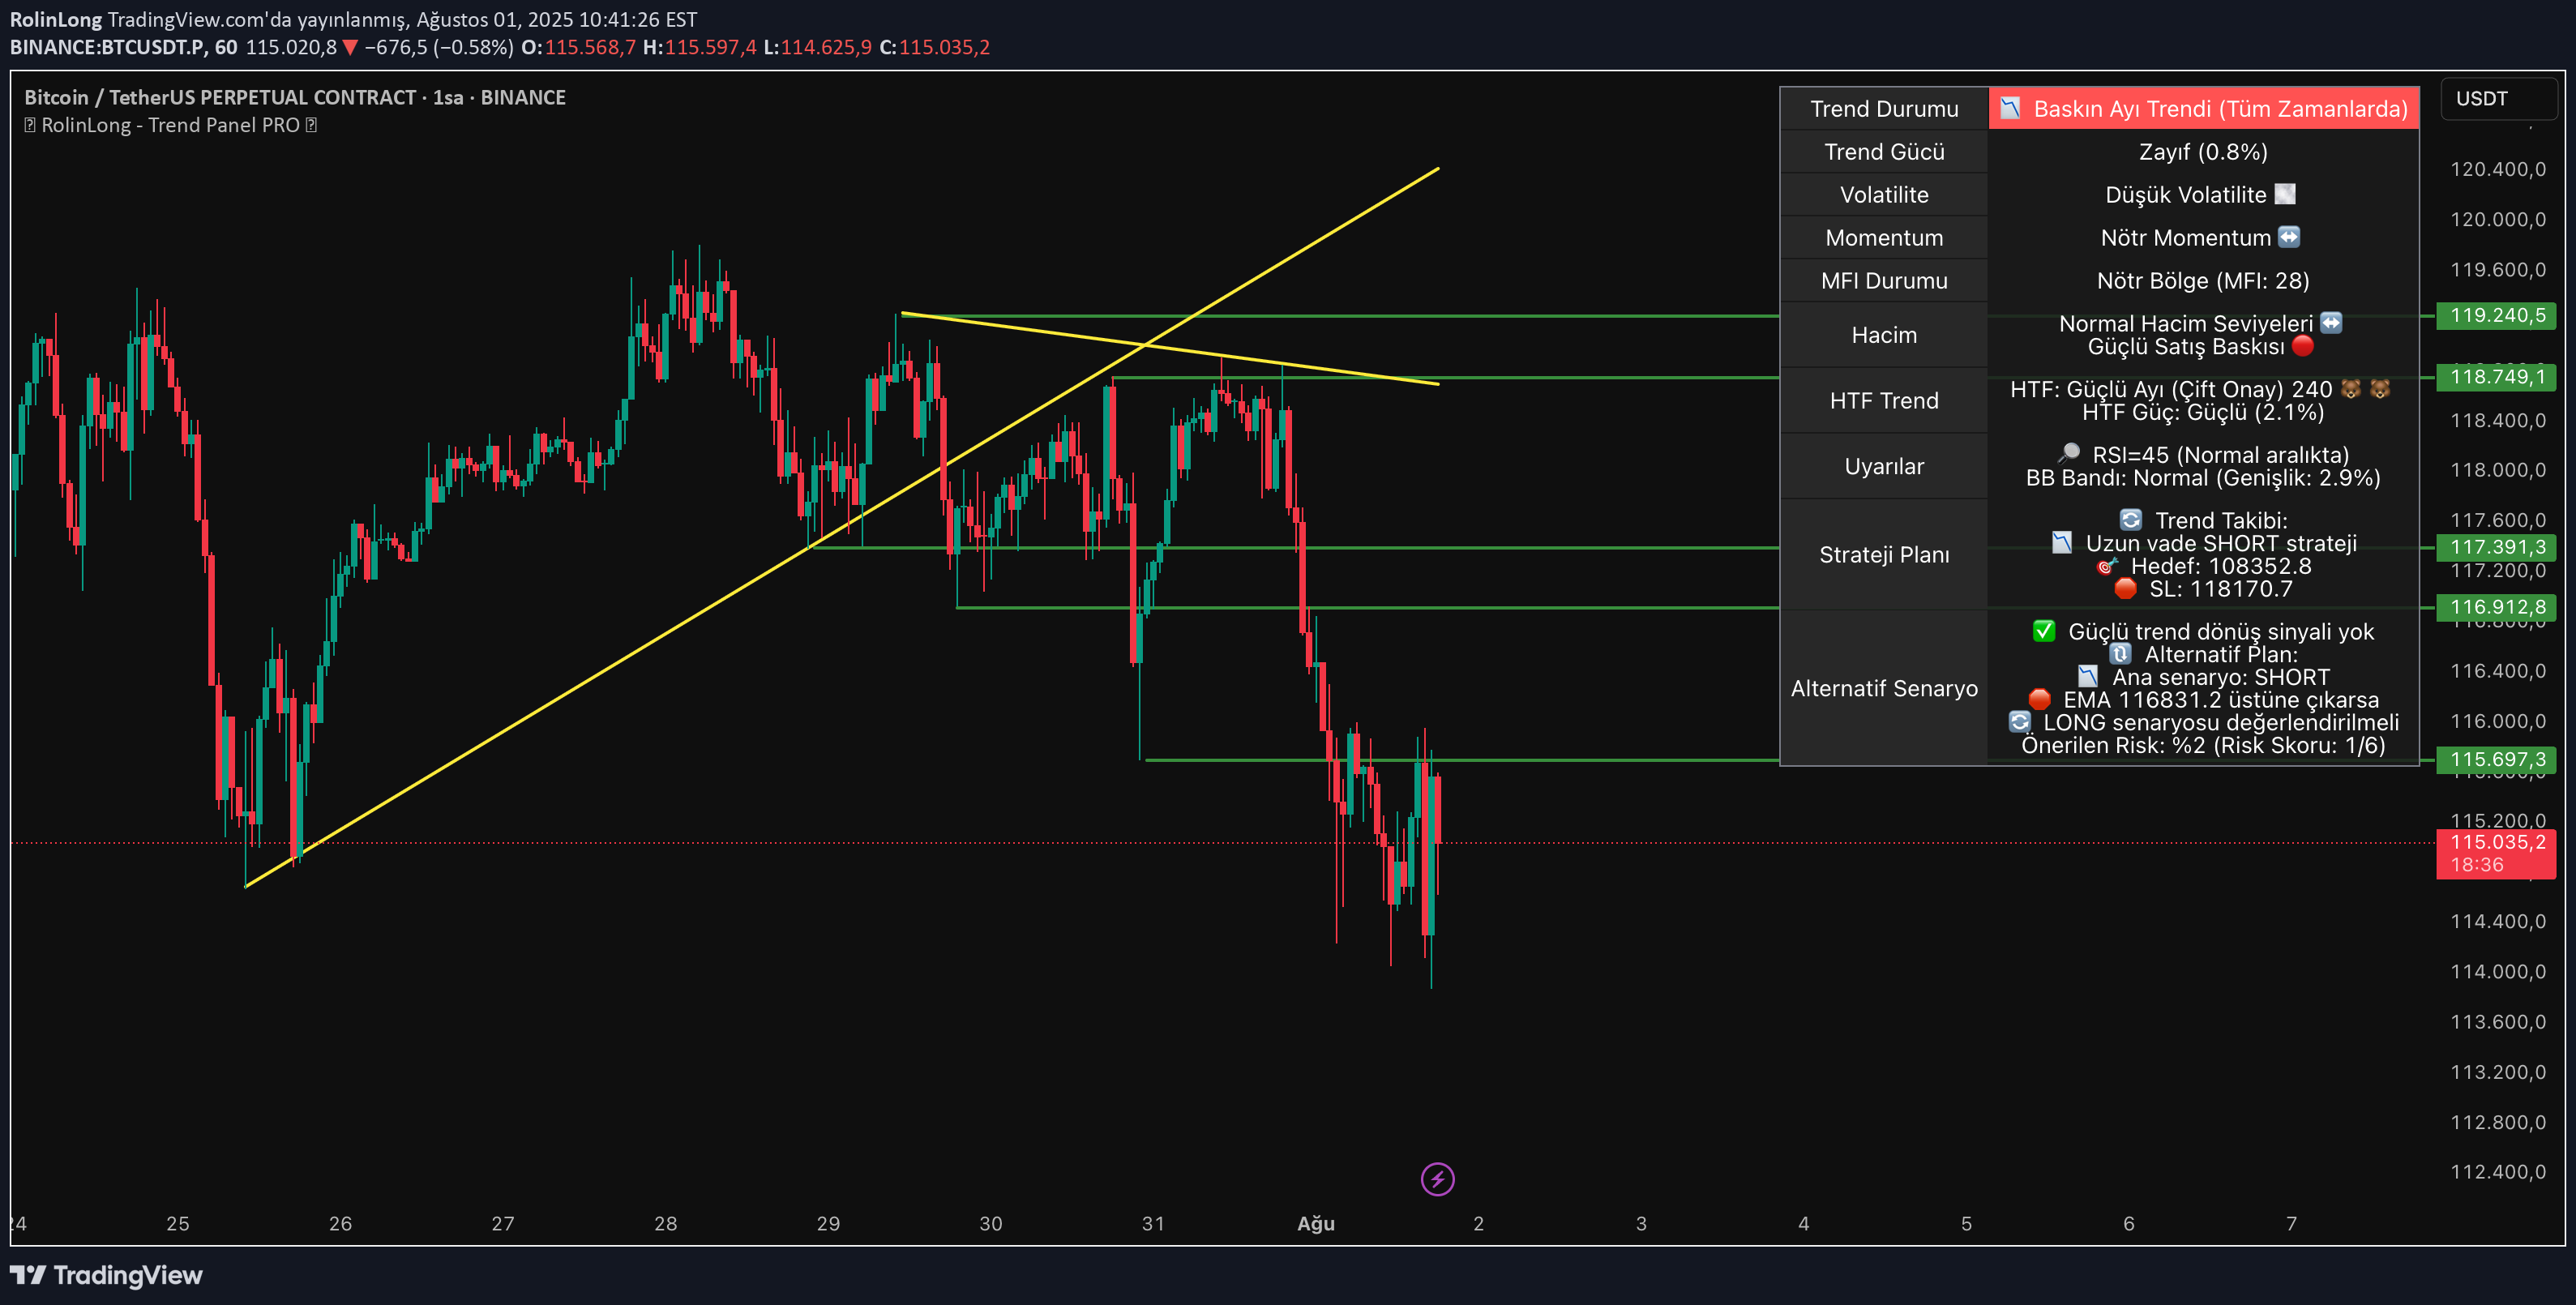
Graphic Information 📊: Parity: BTC / USDT PERPETUAL CONTRACT (Bitcoin / Tetherus) Time Zone: 1 Hour Graph (1S) Instant Price: $ 114,877 Indicator and oscillator analysis 📈: RSI (41.87): Neutral - neither in excessive intake nor in excessive sale. In the region of indecision. MACD: Bullish (main line: -609.74, signal: -669.17) → In the negative region, but the intersection is positive. Possible return signal. ADX (38.11): There is a strong trend. CCI (-51.14): Bearish-Momentum is weak, the price is suppressed down. Chande Momentum Oscillator (-4.37): Low Momentum-does not support the rise. EMA/WMA Status: All EMA and WMA combinations Bearish → Sale pressure still continues in the medium term. Taurus/Bear Power: +308.55 → There is a superiority in favor of buyers. Volume Changes: 10 Bar: 90.87 %increase (positive) 20 Bar: -47.03 %decrease (negative) 30 Bar: 243.5 %increase (positive) This shows that there are rise in the short term, but the general confidence is weak. Support and resistance levels 🧱: Resistances: R1: 118,910 R2: 118,763.5 R3: 119,258.7 Supports: S 1: 115,700 S 2: 116,923 S 3: 117,388 Trend support has been broken: The rising trend that has been running for a long time has been broken. This shows that the general aspect is turning down. Formation Analysis 🔎: Head and Shoulders (Shoulder-Baş-Somuz): The graph has a significant peak structure and trend support is broken. This is considered a decrease formation. Trend Support Break: A clear breakdown took place, pullback took place and moved down again. Bearish Engulfing Candle Structure: Strong decrease in the last candles is evident. Process suggestions 💡: Short -term Short process 🔴: Entry Point: $ 114,877 (instant price) Target Price: $ 115,700 (S1) and then $ 113,500 (previous low) Stop-Loss: $ 118,910 (above R1) Success Rate: 76 %(Trend Support broken, EMA/WMA All Bearish) Short -term long process 🟢: INTRODUCTION: $ 116,923 (If the R2 level is taken back) Target Price: $ 118,763.5 Stop-Loss: $ 114,000 Success Ratio: 41 %(Weighted indicators indicate a decrease, weak Long probability) Risk Management and Strategy ⚠️: The broken trend support and all of the EMA/WMA aspects make it risky in the short term. A strong technical floor has been formed for Short transactions. Although RSI and MACD give neutral or limited recovery signals, formations and EMAs show that sales pressure continues. ⚠️ Process Suggestion ⚠️: Short ⚠️ Graphic suggestion ⚠️: It is recommended that you do this parity. Technical formations and broken trend support creates a powerful floor for Short operations.
RolinLong
Spot Altın (XAUUSD) 1 Saatlik Grafikte Trend Kırılımı Sonrası
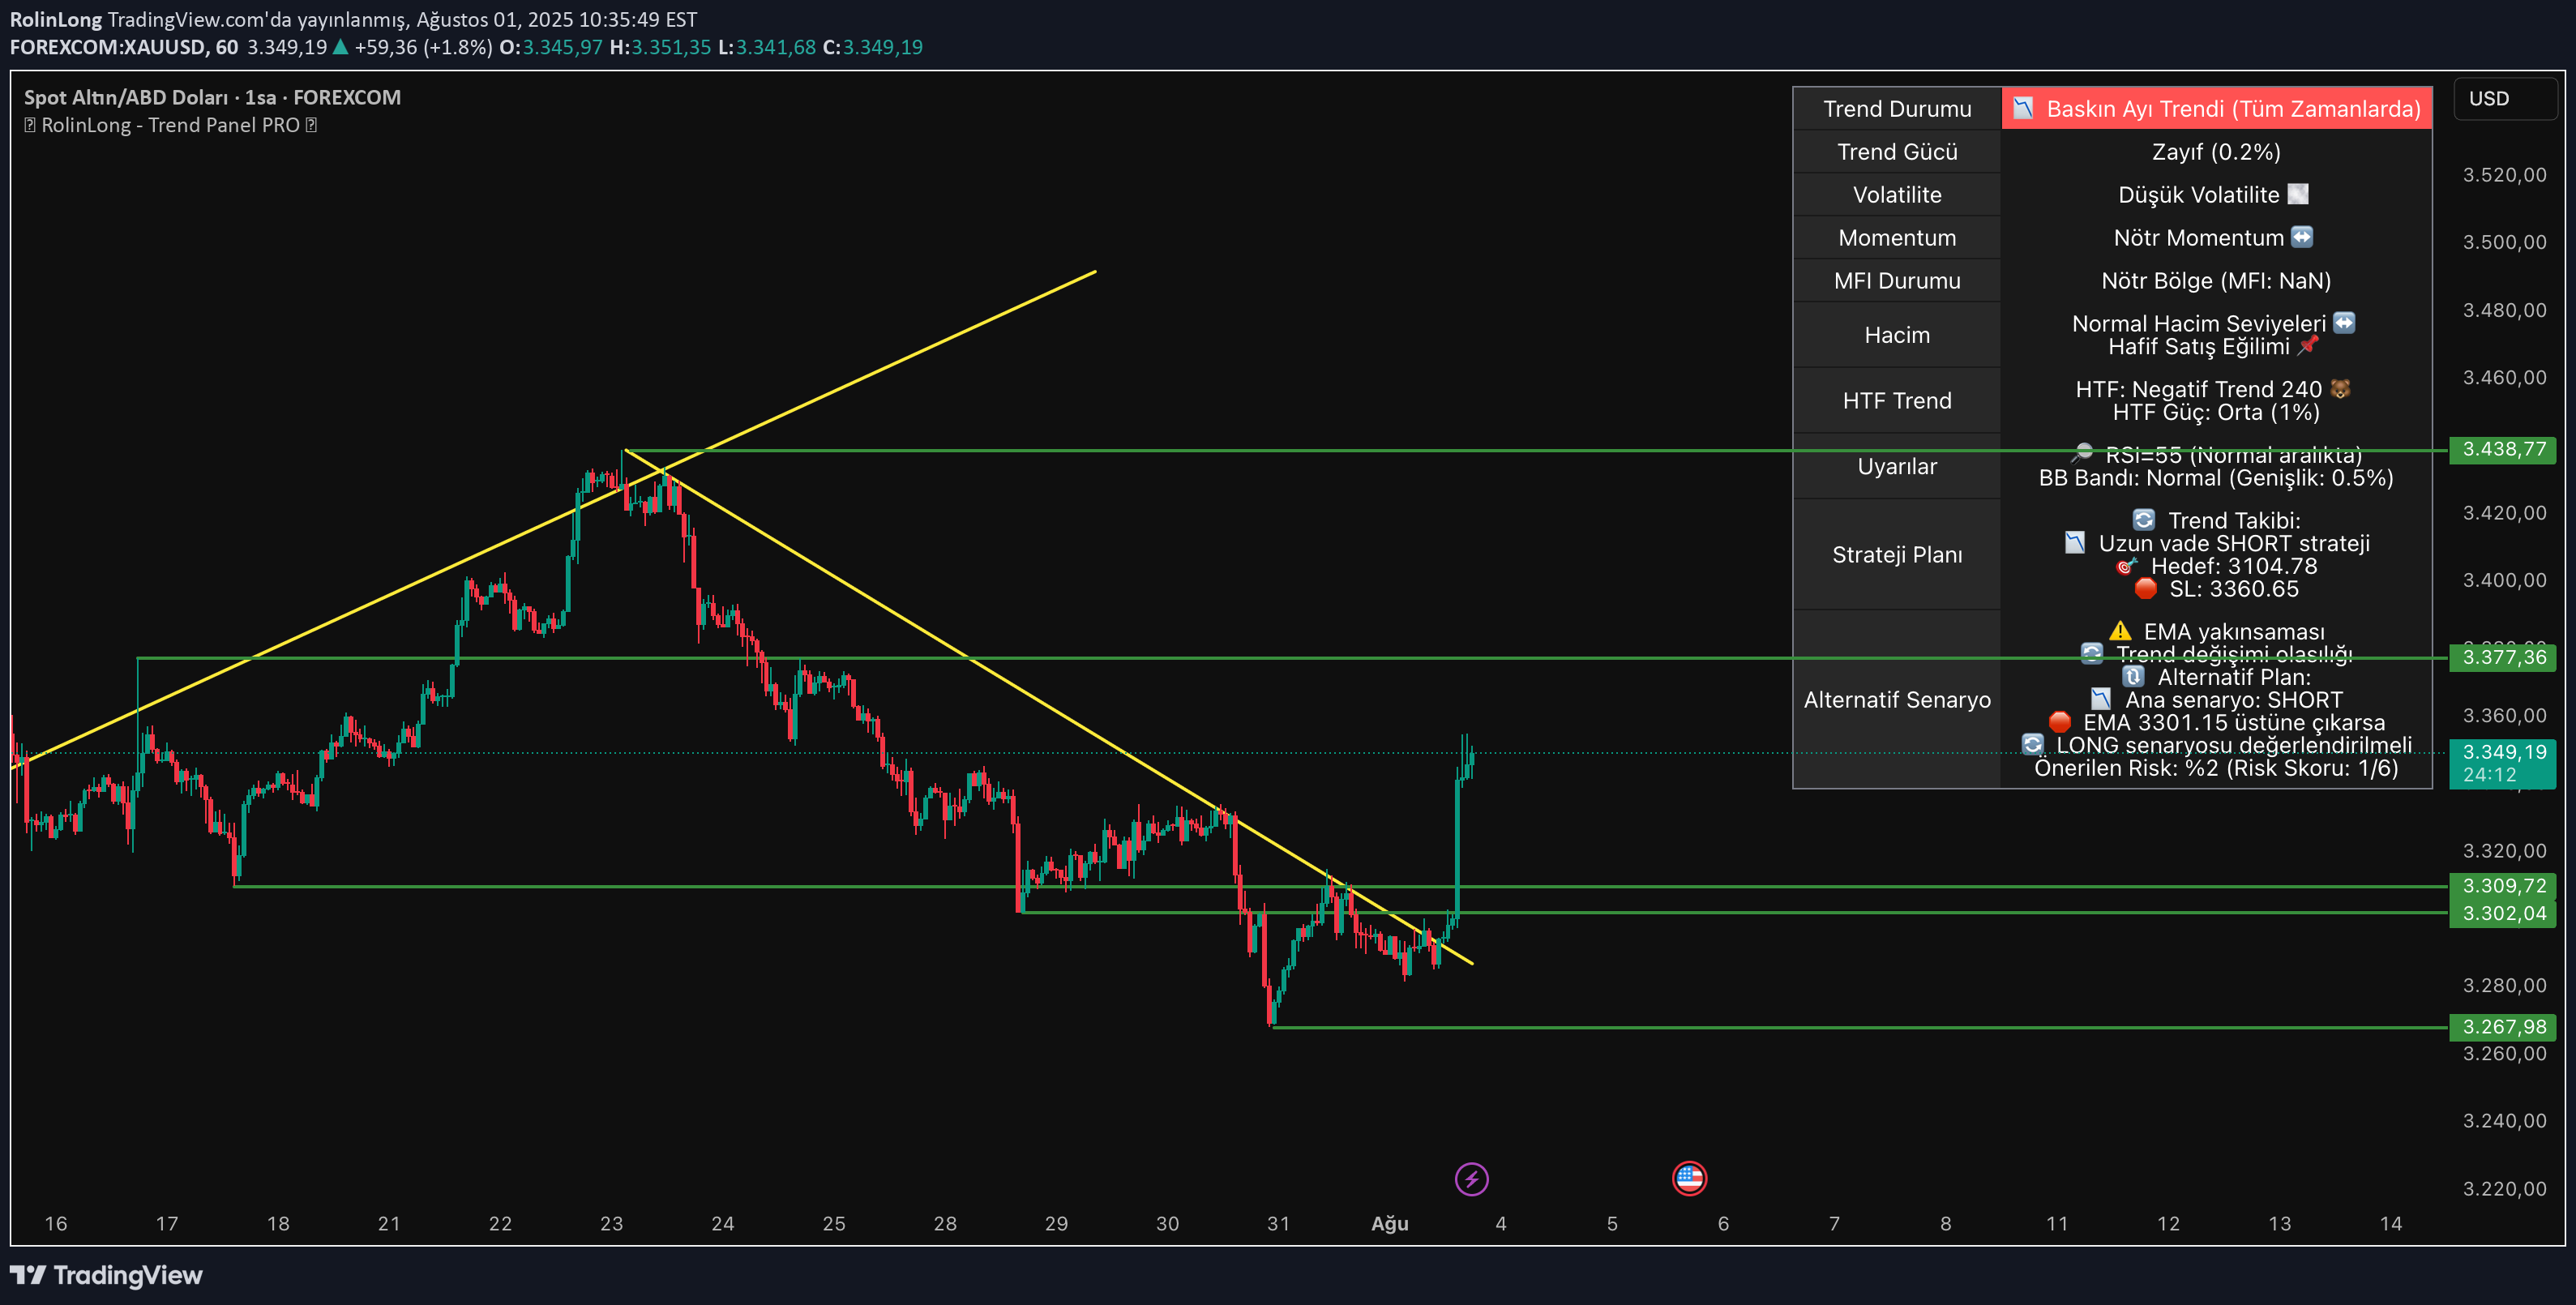
Graphic Information 📊: Parity: Spot Gold / US dollar (Forexcom: Xauusd) Time Zone: 1 Hour Graph (1S) Instant Price: $ 3,350.5 Indicator and oscillator analysis 📈: RSI (Relative Strength Index): Excessive purchase (77.75) → The price may come in the overcrease area, correction may come. MACD: BULlish - main line: 10.91, Signal: 3.8 → Indicates that the rise momentum is strong. ADX: Bearish (30) → The trend direction may be weak, care should be careful. CCI: Bullish (190.31) → In the overput area, but the rise acceleration continues. Chande Momentum Oscillator: Excessive sale (83.88) → There is a possibility of short -term correction after excessive movement. EMA and WMA Cross: 5/22 EMA, 9/15 WMA, 10/20 WMA all supports the rising trend in the medium term. Taurus/Bear Power: 56.71 → The dominance of the bulls is available. Volume Analysis 🔍: 10, 20 and 30 bar volume exchange information is not available (nan%), which makes it difficult to evaluate the current volume power. Current transaction volume: 0 (probably data deficiency) Support and resistance levels 🧱: Resistances: R1: 3334.19 R2: 3438.94 R3: 3377.47 Supports: S 1: 3268.18 S 2: 3301.93 S 3: 3309.99 Trend Top Band: 3286.76 (Important Fracture Zone) Formation Analysis 🔎: Breakout Formation (Trend Line Break): The long -standing trend has been broken and a strong upward movement has been initiated. This can usually be the starting signal of an ascension. The price exceeded the R1 level after the upward breakdown. This breakage can also be considered as the upward frustration of a Falling Wedge formation. This formation is a Bulish signal as indicated in Goodcrypto. In addition, a small diameter “Bulllish Engulfing” candle structure is seen. Process suggestions 💡: Short -term long process 🟢: INTRODUCTION: $ 3,340.00 (R1 Level Reduction After Breaking Reddness) Target Price: $ 3,377.47 (R3 level) Stop-Loss: $ 3,309.99 (S3 level, 0.9 %deviation share) Achievement Rate: 78 %(strong formation breakage and EMA/WMA supported BULLlish structure) Short -term Short process 🔴: Entry Point: $ 3,350.5 (instant price) Target Price: $ 3,301.93 (S2 level) Stop-Loss: $ 3,377.47 (R3 level) Success Ratio: 49 %(RSI and CCI in excessive intake, even though the possibility of correction is a trend bulish) Risk Management and Strategy ⚠️: Long positions should be careful because RSI and CCI values in excessive intake. However, the fact that the movement is supported by EMA/WMA and MACD after trend breakage shows that long operations are more advantageous. Short process is more risky because the general momentum is upward. ⚠️ Process Suggestion ⚠️: Long ⚠️ Graphic suggestion ⚠️: It is recommended that you do this parity. Especially after trend breakage, the increase in momentum continues strongly. Stop-Loss must be used considering RSI and CCI warnings.
RolinLong
BTC/USDT – Kritik Sıkışma Alanında! Yön Arayışı Bitmek Üzere

📍 PARITY: BTC/USDT🕐 TIME: 1 -hour graph (1H) 💰 Instant Price: 104,378.9 USDT🔍 Technical Analysis: BTC/USDT parity 104,400 - 103,800 in the range of horizontal jams entered the direction of direction. While most of the technical indicators point to the weak momentum, this dar a break will determine the short -term direction to be made in the band. 104,400 - 106,633 - 108,900Des: 104,326 - 103,800📌 Formation: Although a classic rotational formation is not seen in the graph, the dar band consolidation is available. These structures generally create a clear direction with voluminous breakage. So the end of this jam may end with a strong movement.💡 Process Suggestions: 🔴 Short Position: 📍 Introduction: 103,800 (after support fracture) 🎯 OBJECTIVE: 102,600🛡️ STOP: 104,500📊 SUCCESS RATE: 63 %Justification: MACD and CCI Bearish, ADX Low; The downward breakdown is more likely. Volume is weak, which makes long -term trials difficult. If the 103,800 level is broken downward, a strong wave of decrease can be triggered. Do not neglect risk management.
RolinLong
BTC/USDT 4H | Güçlü Trend, Zayıflayan Hacim – Kritik Bölge

اطلاعات نمودار 📊:جفت ارز: BTC/USDT (Bitcoin / تتر USDT)بازه زمانی: نمودار 4 ساعته (4H)قیمت لحظه ای: 92,959.5 دلارتحلیل اندیکاتورها و اسیلاتورها 📈:وضعیت RSI (شاخص قدرت نسبی): نرمال، مقدار: 66.89قیمت به محدوده خرید بیش از حد نزدیک می شود، احتمال اصلاح در کوتاه مدت وجود دارد.وضعیت MACD: نزولیخط اصلی MACD: 1742.11 / سیگنال MACD: 1877.72 ← سیگنال منفی، احتمال از دست دادن مومنتوم.ADX (شاخص جهت دار میانگین) وضعیت: صعودی، مقدار: 40.97نشان دهنده وجود یک روند قوی است.وضعیت CCI (شاخص کانال کالا): نزولی، مقدار: 52.84سیگنال کاهش مومنتوم را نشان می دهد.وضعیت Chande MO: نرمال، مقدار: -27.99نشان می دهد که مومنتوم ناپایدار است.تحلیل تقاطع EMA و WMA:9/30 EMA: صعودی5/22 EMA: متقاطع، دیدگاه صعودی9/15 WMA: نزولی10/20 WMA: صعودیقیمت بالاتر از EMA و WMA های 5 - 200: این نشان دهنده یک روند صعودی قوی است.وضعیت حجم:تغییرات حجم 10، 20 و 30 باری منفی ← کاهش در حجم معاملات وجود دارد، این یک سیگنال است که باید به آن توجه شود.سطوح حمایت و مقاومت 🧱:مقاومت ها:93,500 دلار94,300 دلارسپورت ها:90,000 دلار88,750 دلار86,443 دلارتحلیل الگو 🔎:در نمودار، ساختار قله ها و کف های بالاتر (Higher Highs & Higher Lows) ایجاد شده پس از یک "Breakout" واضح قابل توجه است. این ساختار یک الگوی ادامه روند است و نشان می دهد که روند صعودی ممکن است ادامه یابد.علاوه بر این، افزایش قیمت همراه با کاهش حجم، سیگنال "Negative Volume Divergence" (واگرایی حجم منفی) را نشان می دهد. این یک وضعیت است که باید مراقب آن بود.پیشنهادات معاملاتی 💡:لانگ میان مدت 🟢:نقطه ورود: 91,800 دلار (مقاومت قبلی اکنون حمایت شده است)هدف قیمت: 93,500 دلار ← 1.85٪ سود بالقوههدف دوم: 94,300 دلارحد ضرر: 90,000 دلار ← 1.96٪ ضرر بالقوهنرخ موفقیت: 72٪ (احتمال موفقیت بالا، روند قوی)شورت میان مدت 🔴:نقطه ورود: 93,500 دلار (منطقه مقاومت جدید)هدف قیمت: 91,800 دلارحد ضرر: 94,300 دلارنرخ موفقیت: 55٪ (ریسک متوسط، کاهش حجم و سیگنال MACD نزولی وجود دارد)مدیریت ریسک و استراتژی ⚠️:قیمت بالاتر از تمام EMA و WMA ها معامله می شود ← روند صعودی است.با این حال، MACD و CCI سیگنال های نزولی می دهند.با توجه به اینکه RSI به خرید بیش از حد نزدیک می شود، باید خطر اصلاح را در نظر گرفت.نقطه ورود امن تر برای موقعیت لانگ 91,800 دلار است.سطوح استاپ به دلیل کمبود حجم باید با دقت تعیین شوند.⚠️ پیشنهاد معاملاتی ⚠️: لانگ⚠️ پیشنهاد نمودار ⚠️: معامله در این جفت ارز پیشنهاد می شود.
RolinLong
BTC/USDT 15D | Güçlü Trend + Düşen Hacim = Kritik Karar Noktası!
Graphic Information 📊: Parite: BTC / USDT (Bitcoin / Tetherus Perpetual) Time Zone: 15 minutes of graphics (15D) Instant Price: $ 94,245.0indicator and oscillator analysis 📈: RSI Status: Normal - Value: 69.11 → Be close to the Over Purchase Lim → rise momentum strong. ADX Status: Bullish - Value: 52.15 → It shows that the strong trend continues. Bulish - Value: 123.22 → In the Extreme Purchase Zone, Correction may come. Extreme Sale: Excessive Sale: 54.42 → Potential Recruitment Opportunity. There is a serious decrease in 10-20-30 bar volumes (around 30-45%) → Price increase is supported with weak volume, attention should be paid. Price) Supports: $ 88,850.0 $ 88,418.2 $ 86,610.0 $ 86,327.0FoMMation analysis. Increasing the probability of correction in the term. Strong Support) Success Ratio: 68 %(Medium-High) 📉 Short-Term Short 🔴: Introduction Point: $ 94,245.0HEDEF Price 1: $ 93,000.0 (1.32 %Potential profit-alt Support) Stop-Loss: $ 94,400.0 (0.16 %on the upper resistance) success rate: 55 %(moderate, weakness) Strategy ⚠️: Low volume shows that it should be careful in long positions. It may be sudden corrections due to RSI and CCI close to the reception zones. However, be cautious due to low volume and high RSI-CCI. Stop-Loss should be used.⚠️ Graphic recommendation ⚠️: ✅ It is recommended that you do this parity. There is potential for long operations, but careful risk management is essential.
RolinLong
Yeni Nesil Al-Sat Sistemi: Multistrada

۸+ استراتژی در یک اندیکاتور واحد! مولتیاسترادا با الگوریتمهای EMA، MACD، RSI، Bollinger Bands، Supertrend، ADX، MFI و Stochastic کار میکند و یکی از جامعترین سیستمهای توسعهیافته برای معاملهگران دستی است.💥 چه ارائه میدهد؟ • سیگنال چند استراتژی (همگی در منطق AND کار میکنند) • TP + SL + Break Even سه مرحلهای • پیگیری سود/زیان در زمان واقعی • سیستم هشدار + پنل عملکرد • برچسبگذاری و جانمایی خط کاملاً خودکار 📊 نرخ موفقیت، سود خالص و تعداد معاملات بسته شده را مستقیماً روی صفحه نمایش ببینید! 🎯 تمام تنظیمات تحت کنترل شماست. 🎥 برای استفاده رایگان و ویدیوی معرفی مفصل، به کانال یوتیوب من مراجعه کنید: ROLINLONG
RolinLong
Gerçek Zamanlı TP/SL, Break Even ve Kâr Paneli Gelişmiş Sistem

ایامای کراس پرو نسخه ۲.۵، یک سیستم قدرتمند است که برای ارائه ۱۰۰٪ وضوح در معاملات خرید و فروش شما توسعه یافته است. این ساختاری که در نمودار مشاهده میکنید، با ترکیب سیگنال کراساوور ایامای، سه سطح برداشت سود (TP)، حد ضرر (SL) و سر به سر (خروج بدون ضرر)، به طور ویژه برای معاملهگران دستی و سازندگان سیستم طراحی شده است. 📌 ویژگیهای سیستم: • سیگنالهای ورود مبتنی بر ایامای • اهداف TP به میزان ۰.۵٪، ۱.۰٪ و ۱.۵٪ (نسبتها قابل تغییر هستند) • تقسیم سرمایه بر اساس نسبتهای TP به ازای هر معامله (۶۰/۳۰/۱۰) • گزینه سر به سر: میتواند پس از TP1، TP2 یا TP3 فعال شود • سیستم هشدار خودکار در نقاط TP، SL و سر به سر • پنل بصری که تاریخچه معاملات، نرخ موفقیت و کل سود/زیان را نشان میدهد. 🎯 سیستم، از لحظه شروع معامله، تمام ترسیمها (TP/SL/Breakeven) را به طور خودکار روی نمودار قرار میدهد و در پایان معامله، سود/زیان خالص را در برچسب نشان میدهد. 📺 برای آموزش مفصل و لینک استفاده رایگان، حتماً از کانال یوتیوب من ROLINLONG دیدن کنید. در توضیحات ویدیو، نحوه نصب سیستم و نمونه معاملات آورده شده است.
RolinLong
Multistrada İndikatörü – Tüm Stratejiler Tek Yerde!

این سیستمی که در نمودار میبینید، با گردآوری ابزارهای مختلف تحلیل تکنیکال، هدفش ارائه حداکثر بازدهی در استراتژیهای خرید و فروش است. EMA، MACD، RSI، باندهای بولینگر، Supertrend، Stochastic، MFI، ADX و بسیاری موارد دیگر، همه در یک سیستم! به علاوه، با اهداف TP1–TP2–TP3، نقطه سر به سر خودکار، پنل نرخ موفقیت و سیستم هشدار دقیق پشتیبانی میشود. 🔄 ویژگیهای سیستم: ✅ پشتیبانی از چندین اندیکاتور ✅ سطوح TP/SL و محاسبات نرخ سود ✅ سیستم خروج سر به سر ✅ جدول تجزیه و تحلیل سود/زیان ✅ ساختار بصری غنی با آلارمها، خطوط، برچسبها ✅ پیگیری دقیق عملکرد از تاریخ اولین سیگنال 🎥 فراموش نکنید برای ویدیوی معرفی مفصل و لینک استفاده رایگان، از کانال یوتیوب من دیدن کنید: 📺 یوتیوب: ROLINLONG 🆓 اما فقط از طریق یوتیوب میتوانید به لینک نسخه رایگان دسترسی پیدا کنید، از آن استفاده کنید و نحوه کارکرد سیستم را در ویدیو ببینید.
RolinLong
7 İndikatör Tek Sistem! Ücretsiz

🚀 اندیکاتور Multistrada – همه سیستمها در یک نمودار! با ترکیب ۷ اندیکاتور قدرتمند ایجاد شده است. همه آنها در یک نمودار بهینه، ساده و قابل فهم شدهاند. 🔥📌 هدف ما: ارائه یک سیستم قدرتمند واحد است که در معاملات اسکالپینگ، روزانه و نوسانی به شما راهنمایی کند. طوری طراحی شده که همیشه روی صفحه بماند، دیگر نگران از دست دادن سیگنالها نباشید. 🔗 برای دسترسی به تمام جزئیات، لینک اندیکاتور و ویدئوی آموزشی میتوانید به کانال تلگرام ما مراجعه کنید:👉 تلگرام: rolinlong 🚀 ویدئوی معرفی: 👉 یوتیوب: rolinlong وبسایت ما rolinlong نقطه کام 📈 فراموش نکنید که اندیکاتور را به علاقهمندیهای خود اضافه کرده و روی نمودار خود اعمال کنید. با این سیستم که در هر معامله پشتیبان شما بود، آشنا شوید! ⚠️ هشدار: این اندیکاتور حاوی توصیه سرمایهگذاری نیست. صرفاً جنبه آموزشی دارد.
Disclaimer
Any content and materials included in Sahmeto's website and official communication channels are a compilation of personal opinions and analyses and are not binding. They do not constitute any recommendation for buying, selling, entering or exiting the stock market and cryptocurrency market. Also, all news and analyses included in the website and channels are merely republished information from official and unofficial domestic and foreign sources, and it is obvious that users of the said content are responsible for following up and ensuring the authenticity and accuracy of the materials. Therefore, while disclaiming responsibility, it is declared that the responsibility for any decision-making, action, and potential profit and loss in the capital market and cryptocurrency market lies with the trader.