Technical analysis by RolinLong about Symbol PAXG: Buy recommendation (8/1/2025)

RolinLong
Spot Altın (XAUUSD) 1 Saatlik Grafikte Trend Kırılımı Sonrası
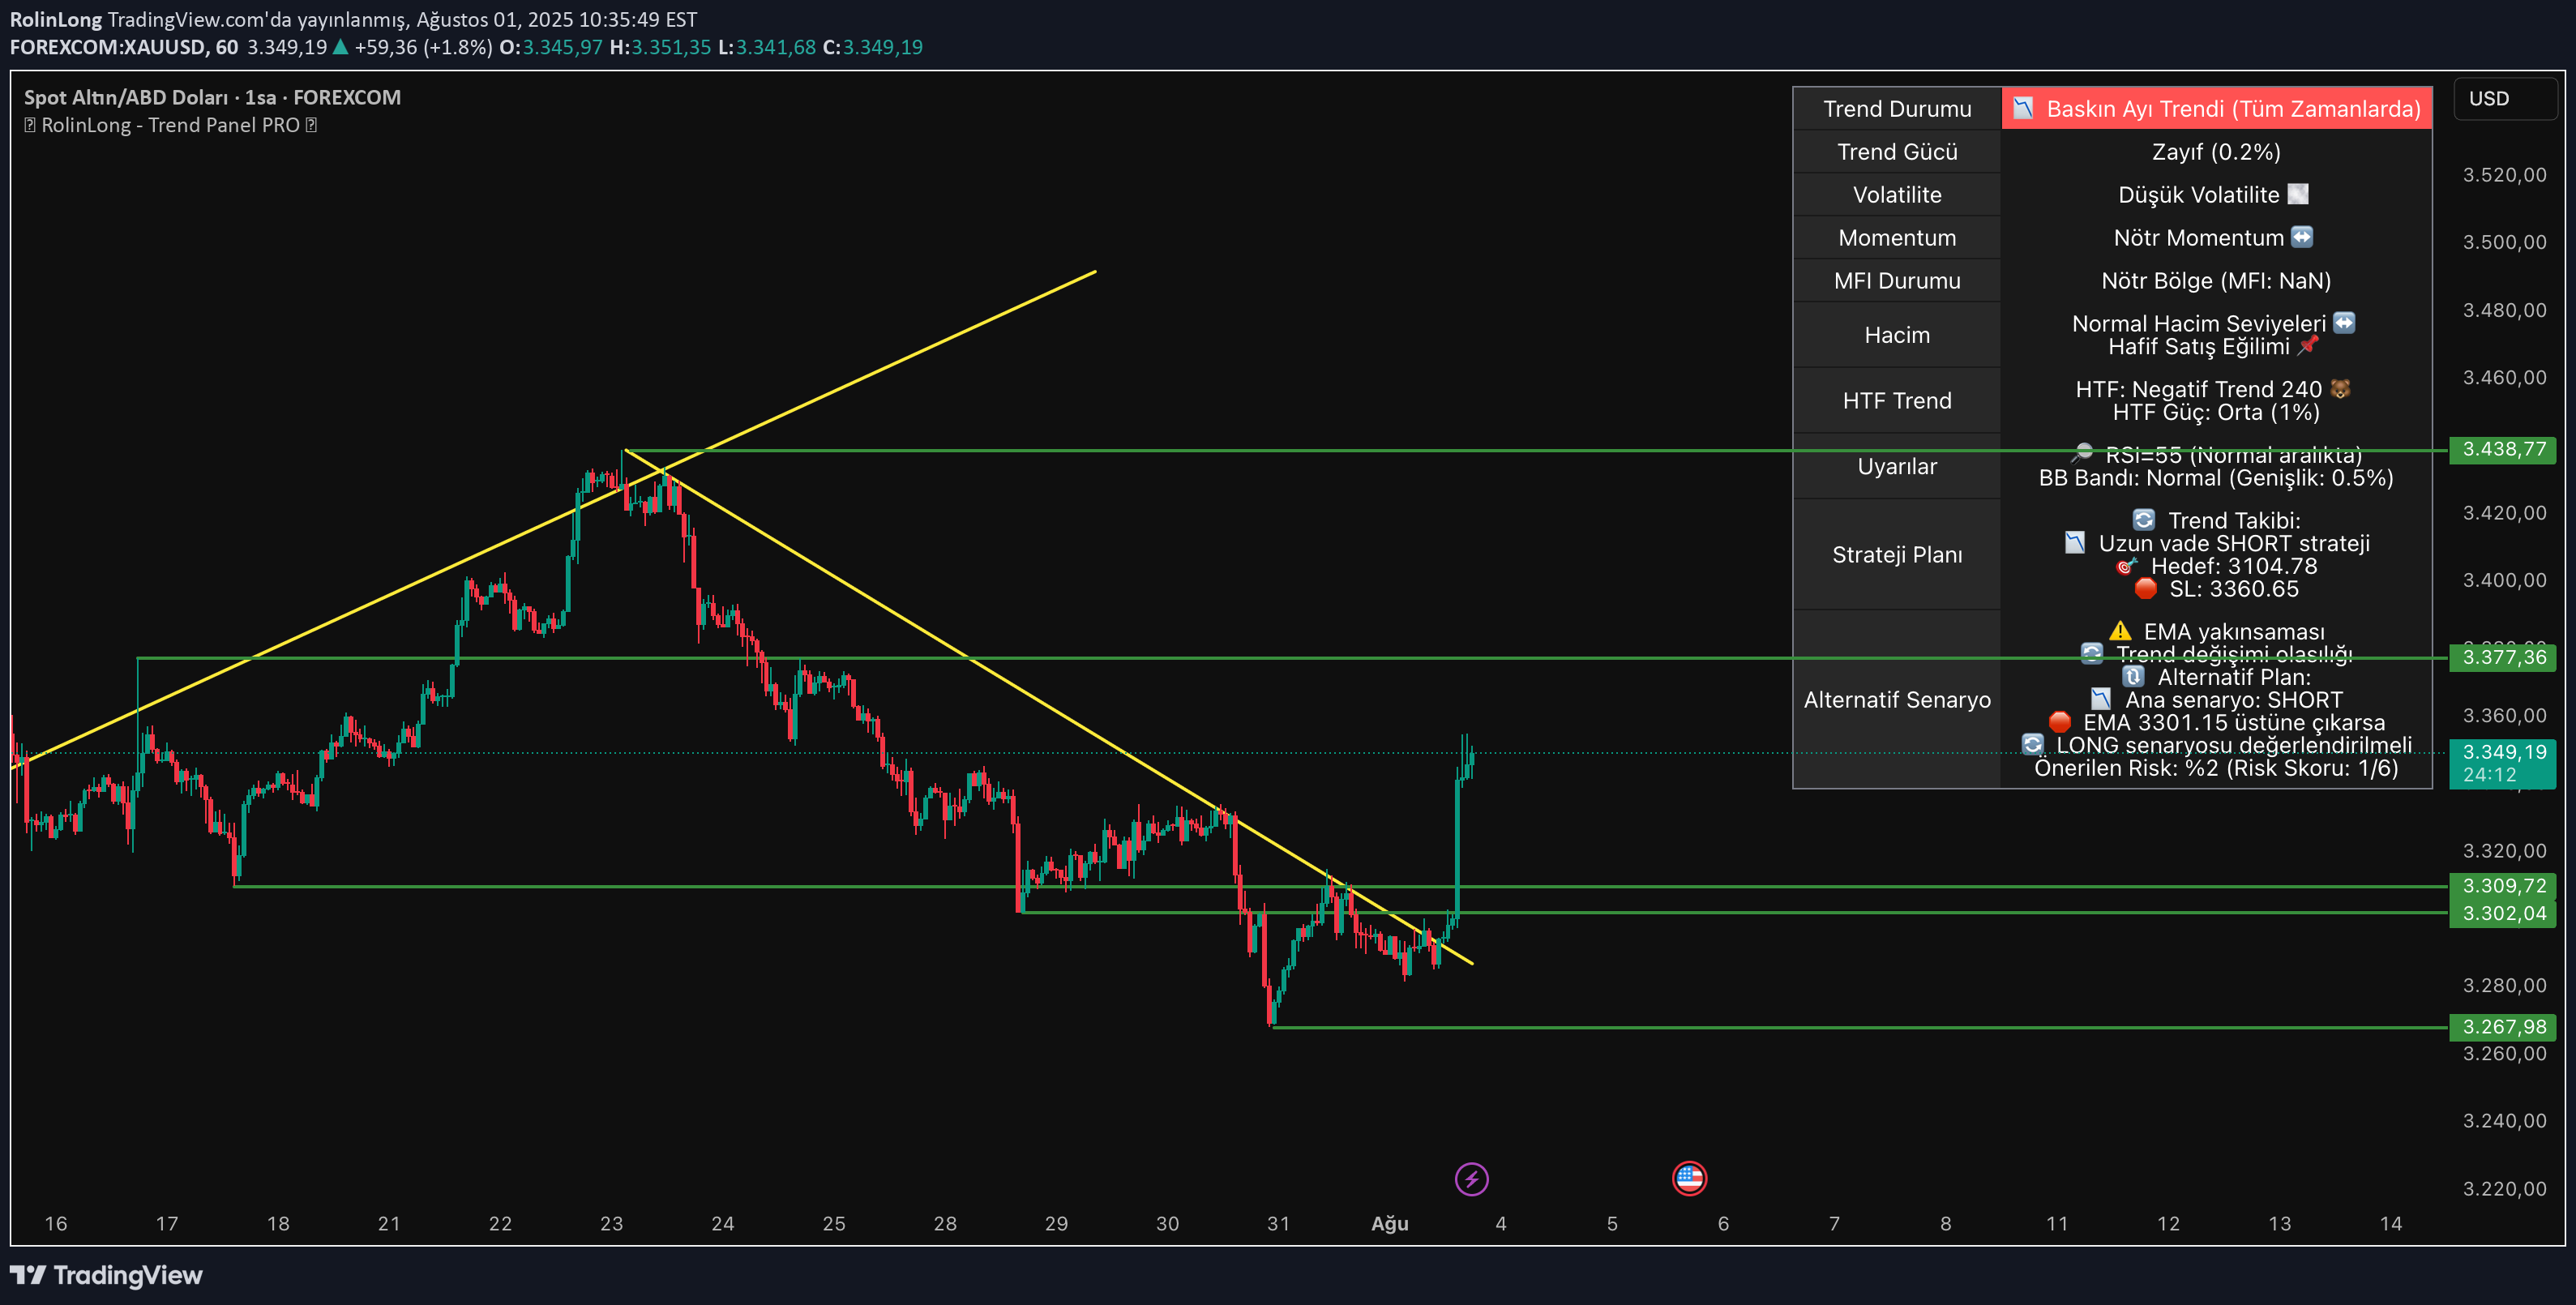
Graphic Information 📊: Parity: Spot Gold / US dollar (Forexcom: Xauusd) Time Zone: 1 Hour Graph (1S) Instant Price: $ 3,350.5 Indicator and oscillator analysis 📈: RSI (Relative Strength Index): Excessive purchase (77.75) → The price may come in the overcrease area, correction may come. MACD: BULlish - main line: 10.91, Signal: 3.8 → Indicates that the rise momentum is strong. ADX: Bearish (30) → The trend direction may be weak, care should be careful. CCI: Bullish (190.31) → In the overput area, but the rise acceleration continues. Chande Momentum Oscillator: Excessive sale (83.88) → There is a possibility of short -term correction after excessive movement. EMA and WMA Cross: 5/22 EMA, 9/15 WMA, 10/20 WMA all supports the rising trend in the medium term. Taurus/Bear Power: 56.71 → The dominance of the bulls is available. Volume Analysis 🔍: 10, 20 and 30 bar volume exchange information is not available (nan%), which makes it difficult to evaluate the current volume power. Current transaction volume: 0 (probably data deficiency) Support and resistance levels 🧱: Resistances: R1: 3334.19 R2: 3438.94 R3: 3377.47 Supports: S 1: 3268.18 S 2: 3301.93 S 3: 3309.99 Trend Top Band: 3286.76 (Important Fracture Zone) Formation Analysis 🔎: Breakout Formation (Trend Line Break): The long -standing trend has been broken and a strong upward movement has been initiated. This can usually be the starting signal of an ascension. The price exceeded the R1 level after the upward breakdown. This breakage can also be considered as the upward frustration of a Falling Wedge formation. This formation is a Bulish signal as indicated in Goodcrypto. In addition, a small diameter “Bulllish Engulfing” candle structure is seen. Process suggestions 💡: Short -term long process 🟢: INTRODUCTION: $ 3,340.00 (R1 Level Reduction After Breaking Reddness) Target Price: $ 3,377.47 (R3 level) Stop-Loss: $ 3,309.99 (S3 level, 0.9 %deviation share) Achievement Rate: 78 %(strong formation breakage and EMA/WMA supported BULLlish structure) Short -term Short process 🔴: Entry Point: $ 3,350.5 (instant price) Target Price: $ 3,301.93 (S2 level) Stop-Loss: $ 3,377.47 (R3 level) Success Ratio: 49 %(RSI and CCI in excessive intake, even though the possibility of correction is a trend bulish) Risk Management and Strategy ⚠️: Long positions should be careful because RSI and CCI values in excessive intake. However, the fact that the movement is supported by EMA/WMA and MACD after trend breakage shows that long operations are more advantageous. Short process is more risky because the general momentum is upward. ⚠️ Process Suggestion ⚠️: Long ⚠️ Graphic suggestion ⚠️: It is recommended that you do this parity. Especially after trend breakage, the increase in momentum continues strongly. Stop-Loss must be used considering RSI and CCI warnings.