Technical analysis by RolinLong about Symbol BTC: Sell recommendation (8/1/2025)

RolinLong
Bitcoin 1S Grafikte OBO Formasyonu ve Trend Kırılımı
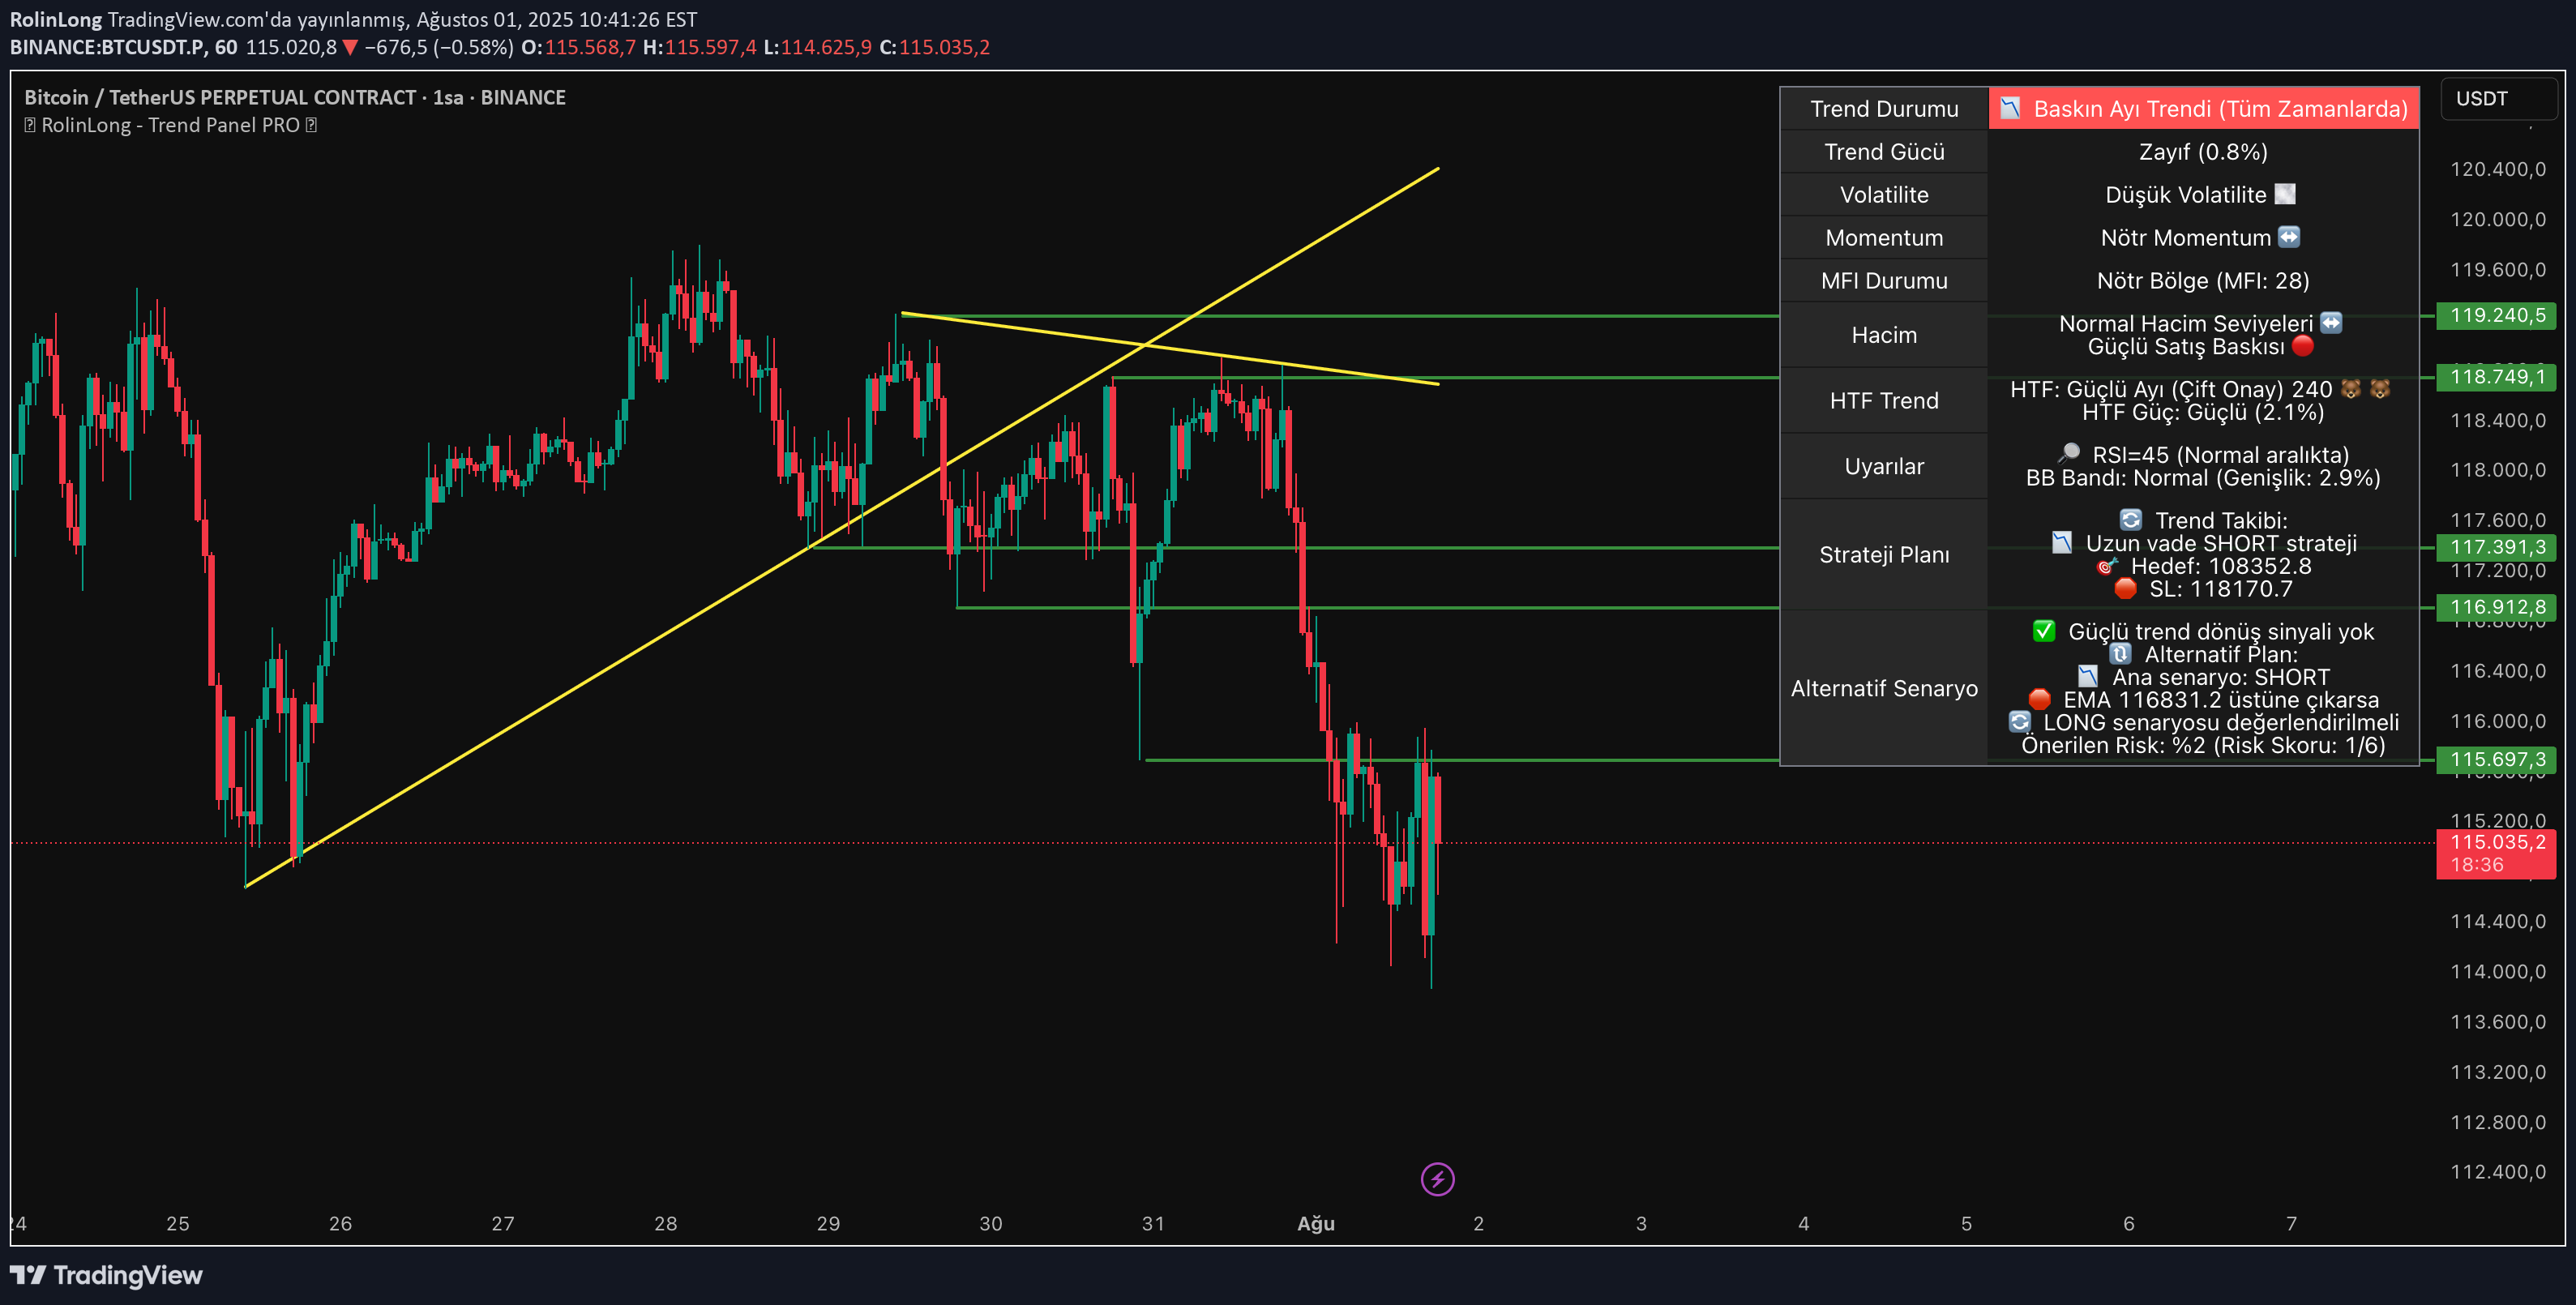
Graphic Information 📊: Parity: BTC / USDT PERPETUAL CONTRACT (Bitcoin / Tetherus) Time Zone: 1 Hour Graph (1S) Instant Price: $ 114,877 Indicator and oscillator analysis 📈: RSI (41.87): Neutral - neither in excessive intake nor in excessive sale. In the region of indecision. MACD: Bullish (main line: -609.74, signal: -669.17) → In the negative region, but the intersection is positive. Possible return signal. ADX (38.11): There is a strong trend. CCI (-51.14): Bearish-Momentum is weak, the price is suppressed down. Chande Momentum Oscillator (-4.37): Low Momentum-does not support the rise. EMA/WMA Status: All EMA and WMA combinations Bearish → Sale pressure still continues in the medium term. Taurus/Bear Power: +308.55 → There is a superiority in favor of buyers. Volume Changes: 10 Bar: 90.87 %increase (positive) 20 Bar: -47.03 %decrease (negative) 30 Bar: 243.5 %increase (positive) This shows that there are rise in the short term, but the general confidence is weak. Support and resistance levels 🧱: Resistances: R1: 118,910 R2: 118,763.5 R3: 119,258.7 Supports: S 1: 115,700 S 2: 116,923 S 3: 117,388 Trend support has been broken: The rising trend that has been running for a long time has been broken. This shows that the general aspect is turning down. Formation Analysis 🔎: Head and Shoulders (Shoulder-Baş-Somuz): The graph has a significant peak structure and trend support is broken. This is considered a decrease formation. Trend Support Break: A clear breakdown took place, pullback took place and moved down again. Bearish Engulfing Candle Structure: Strong decrease in the last candles is evident. Process suggestions 💡: Short -term Short process 🔴: Entry Point: $ 114,877 (instant price) Target Price: $ 115,700 (S1) and then $ 113,500 (previous low) Stop-Loss: $ 118,910 (above R1) Success Rate: 76 %(Trend Support broken, EMA/WMA All Bearish) Short -term long process 🟢: INTRODUCTION: $ 116,923 (If the R2 level is taken back) Target Price: $ 118,763.5 Stop-Loss: $ 114,000 Success Ratio: 41 %(Weighted indicators indicate a decrease, weak Long probability) Risk Management and Strategy ⚠️: The broken trend support and all of the EMA/WMA aspects make it risky in the short term. A strong technical floor has been formed for Short transactions. Although RSI and MACD give neutral or limited recovery signals, formations and EMAs show that sales pressure continues. ⚠️ Process Suggestion ⚠️: Short ⚠️ Graphic suggestion ⚠️: It is recommended that you do this parity. Technical formations and broken trend support creates a powerful floor for Short operations.