
Rich_From_Home
@t_Rich_From_Home

What symbols does the trader recommend buying?
Purchase History
پیام های تریدر
Filter
Signal Type
Rich_From_Home
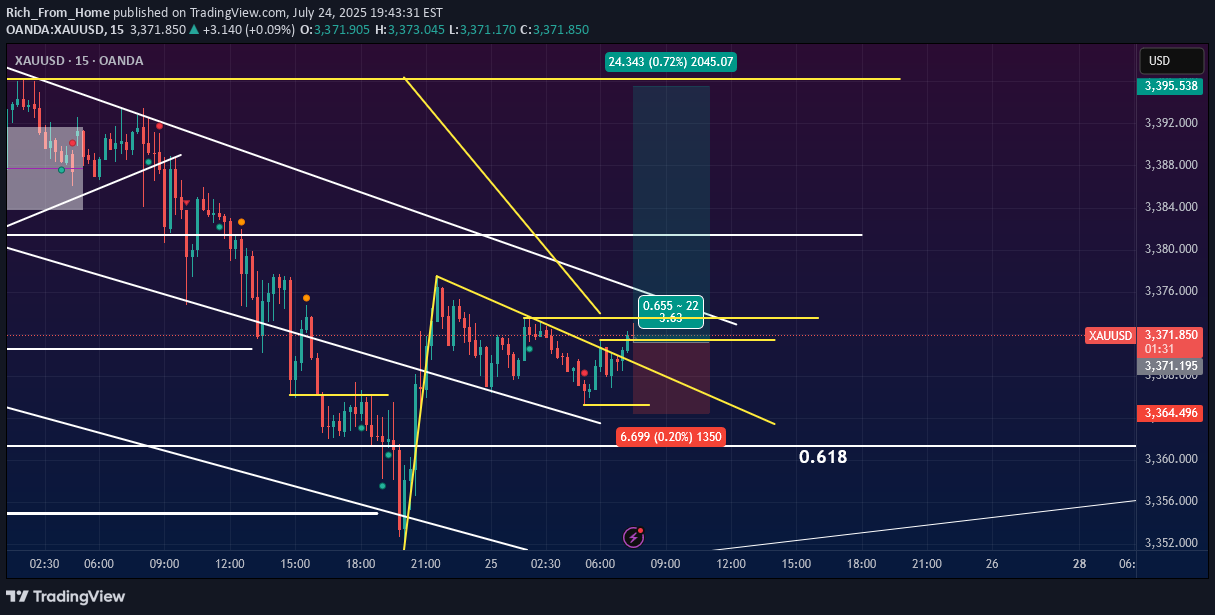
Based on the provided XAUUSD chart, a classic bullish flag pattern appears to be forming on a short-term timeframe. This is a continuation pattern that suggests a potential resumption of the prior uptrend. Here's a breakdown of the pattern's components: The Flagpole: The pattern begins with a strong and rapid upward price movement, which forms the "flagpole." This sharp rally is visible around the 21:00 mark on the chart, indicating strong buying pressure. The Flag (Consolidation): Following the flagpole, the price has entered a period of consolidation. This forms the "flag," which is characterized by the price action moving downward within a well-defined parallel channel or falling wedge. The two white trendlines neatly outline this corrective phase. Potential Breakout: The price is currently testing the upper trendline (resistance) of the flag. A bullish flag pattern is confirmed when the price breaks decisively above this upper trendline. Interpretation and Potential Trade: Continuation Signal: A breakout would signal that the consolidation period is over and the initial bullish momentum is likely to continue. Price Target: The "Long Position" tool on the chart illustrates a potential trade based on this pattern. Typically, the target for a flag pattern is measured by taking the height of the flagpole and adding it to the breakout point. The tool projects a take-profit level around 3,395.538. Risk Management: The tool also indicates a potential stop-loss placed below the low of the flag (around 3,364.496), which is a common strategy to manage risk if the pattern fails. In summary, the chart shows a pause in an uptrend. Traders will be watching for a confirmed breakout above the flag's resistance to anticipate further upward movement in XAUUSD.
Rich_From_Home
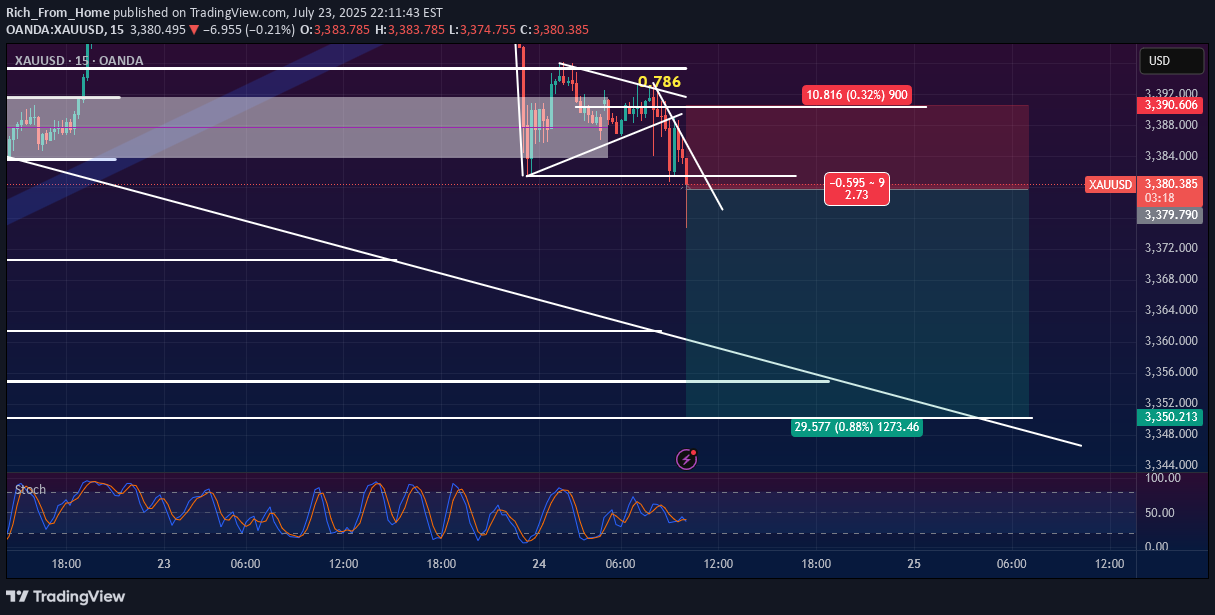
This analysis outlines a potential short (sell) trading opportunity on the XAUUSD (Gold/USD) 15-minute chart. The setup is based on a bearish continuation pattern following a sharp price drop. Key Observations: Pattern Formation: After a significant downward impulse move, the price has entered a consolidation phase, forming a symmetrical triangle or a bearish pennant. This type of pattern typically signals a temporary pause before the downtrend resumes. Fibonacci Confluence: A Fibonacci retracement tool has been drawn from the recent swing high to the swing low. The price has struggled to break above the 0.786 Fibonacci level, which is acting as strong resistance. This rejection adds significant weight to the bearish outlook. Support and Confirmation: The horizontal line at approximately 3,380.348 is a critical support level. The chart includes an important instruction: "Wait for confirmation break support." This emphasizes the need to see a decisive candle close below this level before entering a trade, to avoid a false breakdown (fakeout). Trade Setup Details: Asset: XAUUSD Timeframe: 15-Minute (M15) Bias: Bearish (Short/Sell) Entry: The proposed entry is on a confirmed breakdown below the support level of ~3,380.348. Stop Loss (SL): The stop loss is placed at 3,391.691. This level is strategically set above the recent consolidation high and the 0.786 Fibonacci resistance, protecting the trade from price spikes. Risk: 11.343 points (0.34%) Take Profit (TP): The profit target is set at 3,350.213. This target aligns with a previous area of support, making it a logical level for price to reach. Reward: 30.135 points (0.89%) Risk/Reward Ratio (RRR): The setup offers an attractive risk/reward ratio of 2.66, meaning the potential profit is 2.66 times greater than the potential loss. Indicator Analysis: Stochastic Oscillator (Stoch): The stochastic indicator at the bottom is in the mid-range and not in the overbought or oversold territory. This is neutral and does not contradict the bearish price action setup. Conclusion: This is a well-defined bearish trade setup that aligns with the recent price momentum. The strategy is to wait for a confirmed break of the immediate support structure. The confluence of the bearish pennant/triangle pattern, rejection from a key Fibonacci level, and a favorable risk/reward ratio makes this a high-probability trading idea. Prudence is advised by waiting for clear confirmation before execution.Cut loss we loss 1/2 posisition, its a fakeout
Rich_From_Home
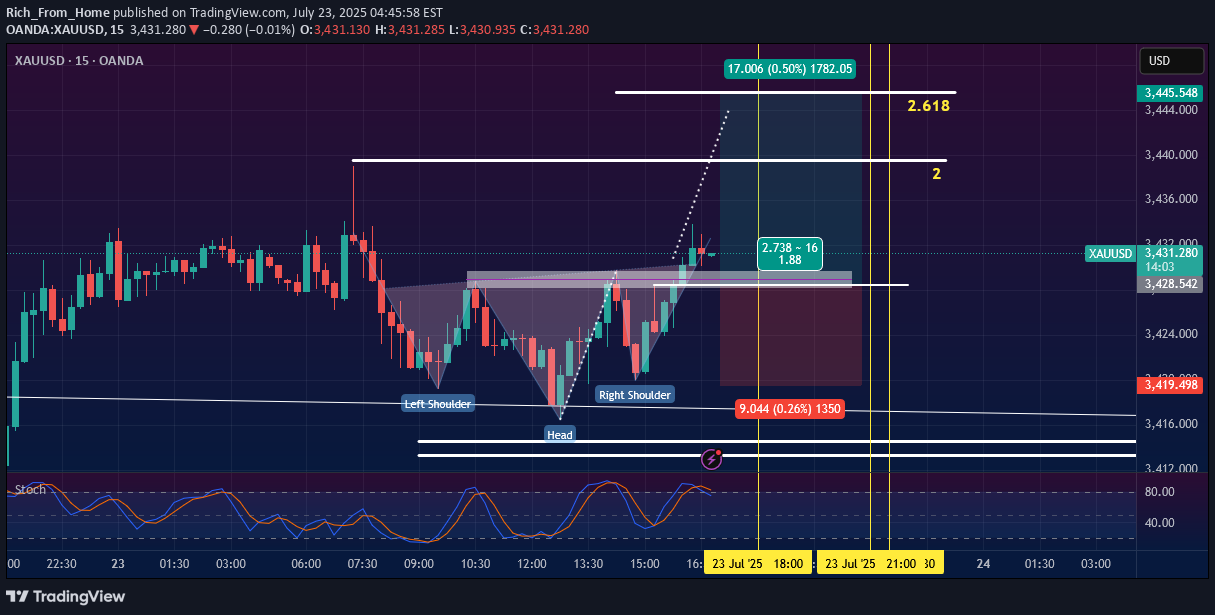
Technical analysis of the XAU/USD (Gold) on the 15-minute timeframe. We are seeing a classic bullish reversal pattern that could offer a solid long opportunity. The Pattern: Inverted Head and Shoulders (IH&S) As highlighted on the chart, an Inverted Head and Shoulders pattern has clearly formed. Left Shoulder: The initial dip and recovery. Head: A lower dip, marking the potential bottom of the recent downtrend. Right Shoulder: A higher low, indicating that sellers are losing strength and buyers are stepping in at higher prices. This pattern signals a potential shift in market sentiment from bearish to bullish. Confirmation and Trade Setup The key to confirming this pattern is the neckline, which has been acting as a significant resistance level. We have now seen a decisive candle break and close above this neckline, providing the confirmation we need to consider a long position. Here is the trade idea based on the chart: Entry: A long position is initiated right after the breakout of the neckline, around the 3,428.542 level. A potential entry could also be on a retest of this broken neckline, which would now act as support. Stop Loss (SL): To manage risk, the stop loss is placed below the low of the Right Shoulder at 3,419.498. A move below this level would invalidate the bullish pattern. Take Profit (TP): The profit target is determined by measuring the height from the Head to the neckline and projecting it upwards from the breakout point. Primary Target (TP1): 3,445.548. This target also aligns well with the '2' Fibonacci extension level, adding extra confluence to the trade. Risk/Reward Ratio: This setup offers a favorable Risk/Reward ratio of approximately 1.88, making it an attractive trade from a risk management perspective. Additional Confluence Moving Averages: The price is now trading above the key moving averages, which are beginning to curl upwards, suggesting building bullish momentum. Stochastic Oscillator: While the Stochastic is in the upper region, in a strong bullish move, it can remain overbought for an extended period. Conclusion The confirmed breakout from the Inverted Head and Shoulders pattern on the 15M chart presents a compelling bullish setup for XAU/USD. The defined entry, stop, and target levels provide a clear and actionable trade plan.invalid market manipulation, we cant get good confirmation for this move
Rich_From_Home
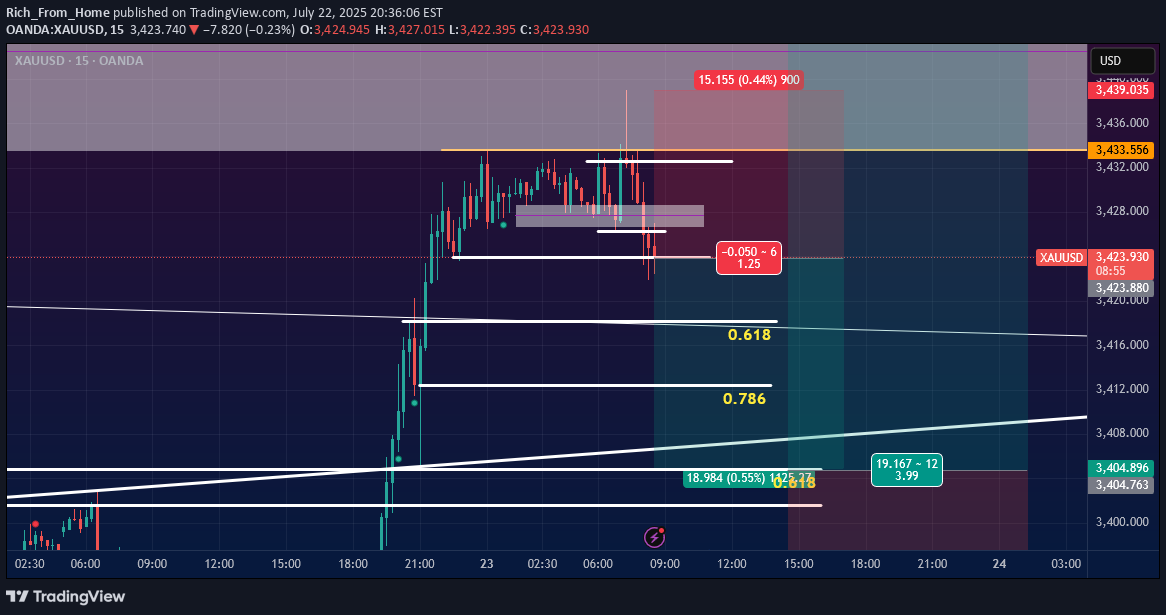
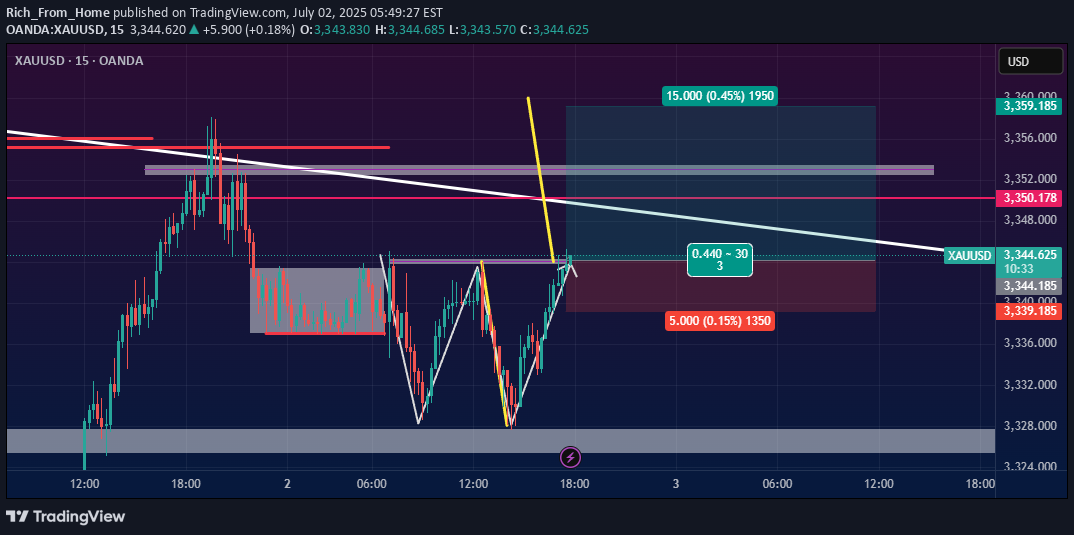
This analysis outlines a tactical, aggressive short-term selling (scalping) opportunity on XAU/USD. The plan is now updated with a specific confirmation trigger to increase the probability of the trade. It is important to remember that this is a counter-trend trade, as the primary market bias remains bullish. I. The Aggressive Sell (Scalping) Setup The immediate price action suggests a short-term selling opportunity, but we will wait for confirmation before entering. Rejection from Resistance: The price has clearly been rejected from the key resistance level around 3,433.556, indicating that sellers are defending this zone. Initial Breakdown: The price has broken below the immediate consolidation area (gray rectangle) and is testing a crucial short-term support level. Trade Plan: Entry Confirmation (Key Condition): For a higher probability entry, we will wait for a 15-minute candlestick to close decisively below the support level of 3,423.915. This candle close serves as confirmation that sellers have gained control and that the breakdown is likely to continue. Entering before this confirmation is significantly more aggressive and carries higher risk. Stop Loss: Once the entry is confirmed, place a tight stop loss above the recent high and the main resistance level, around 3,439.035. This protects against a false breakdown and a swift reversal. Take Profit Targets: TP1 (Aggressive): The 0.618 Fibonacci retracement level (around 3,416.000) is the first logical target. TP2 (Full Target): The area between the 0.786 Fibonacci level and the lower support line (around 3,404.800) serves as the primary target for this corrective move. II. The Primary Buy (Main Focus) Strategy This sell trade is viewed as a temporary correction within a larger uptrend. Our main focus remains on finding an optimal entry point to go long (buy). Underlying Bullish Strength: The market's previous strong, impulsive move upwards indicates that the larger trend is bullish. The current downward price action is likely a healthy pullback. Potential Buy Zones: The take-profit areas for our short trade are the ideal entry zones for our primary buy strategy. We will be actively looking for buying opportunities in these key areas: Zone 1: The 0.618 Fibonacci level (~3,416.000). Zone 2: The 0.786 Fibonacci level (~3,408.000) and the surrounding ascending trendline support. We will wait for clear reversal signals in these zones—such as bullish candlestick patterns or a strong bounce—before committing to a long position. Summary: Our revised plan is to wait for a confirmed breakdown with a 15-minute candle close below 3,423.915 before entering a short (sell) position. This tactical sell aims to capitalize on the pullback. The strategic goal remains to exit the sell at key Fibonacci support levels and pivot to a buy position in alignment with the dominant bullish trend.
Rich_From_Home
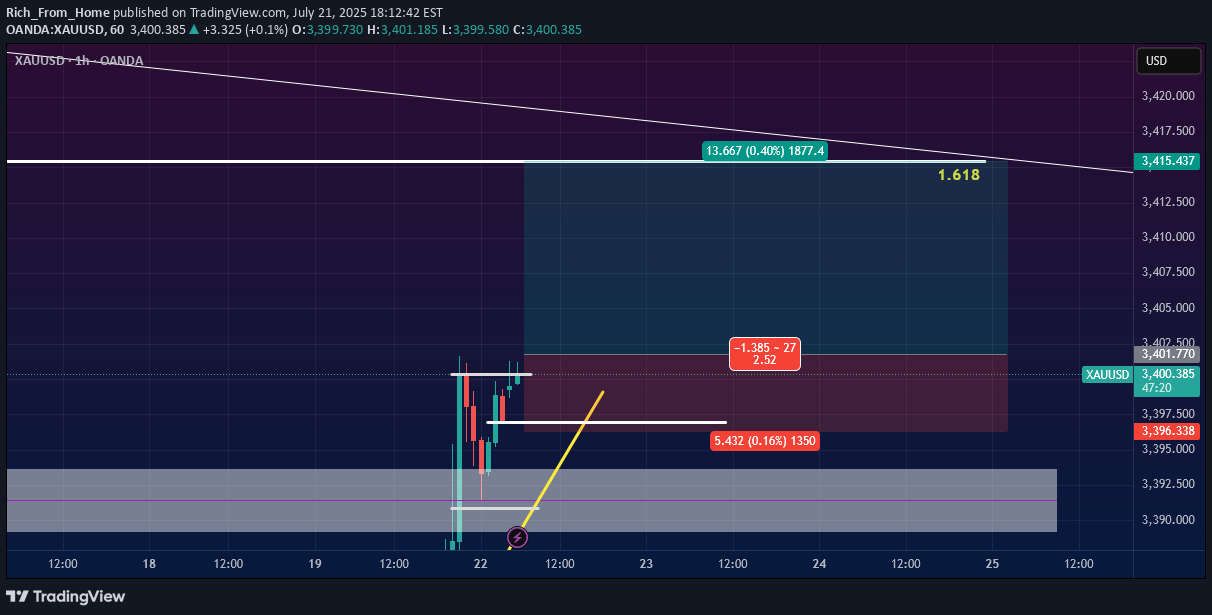
This analysis outlines a potential long (buy) position on Gold (XAU/USD) based on a breakout strategy. Trade Rationale The price is currently consolidating below the key resistance level of 3,401. The plan is to enter a long trade on the assumption that if the price can break and hold above this level, it will continue its bullish momentum towards the next major resistance zone. Confirmation for Entry The entry is not immediate. The trade should only be taken after a 1-hour candle body closes decisively above the 3,401.770 resistance. This confirmation indicates that buyers are in control and helps avoid a "fakeout" where the price spikes and quickly reverses. Key Trade Levels Entry: 3,401.770 (Only after the confirmation candle closes). Take Profit (TP): 3,415.437 Reason: This target is set at the 1.618 Fibonacci extension level, measured from a Daily timeframe swing, which represents a significant potential resistance area. Stop Loss (SL): 3,396.338 Reason: Placed below the recent price consolidation area to protect against minor volatility. This setup offers a favorable Risk/Reward Ratio of 2.52, making it a strategically sound trade if the entry conditions are met.
Rich_From_Home
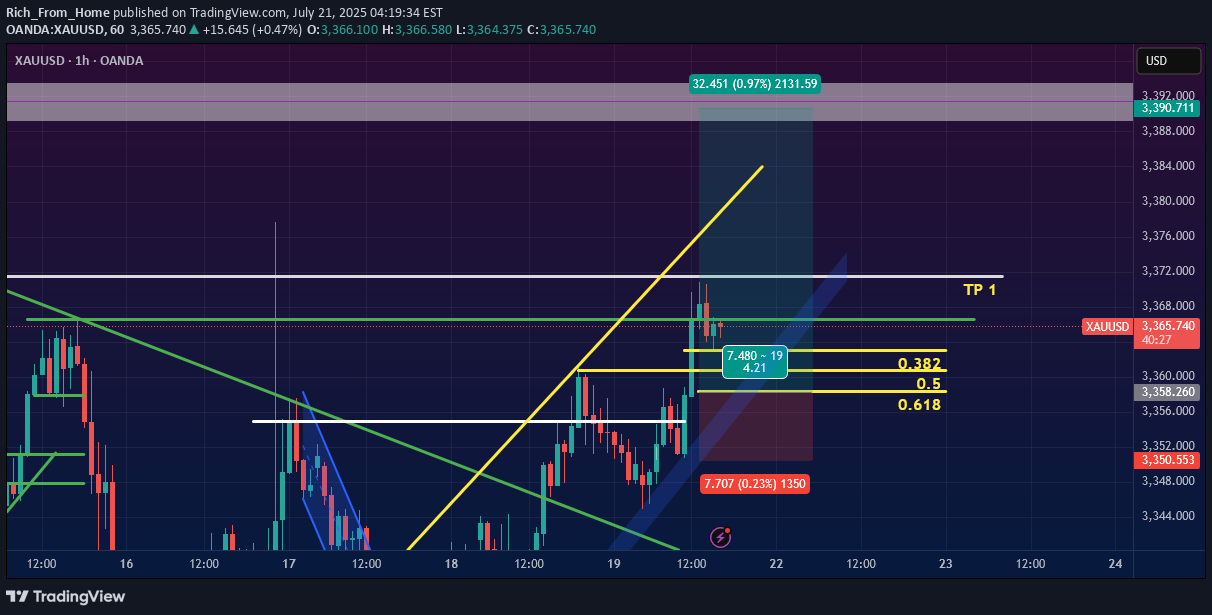
This chart presents a bullish trade setup for XAU/USD based on several technical indicators and patterns. The analysis suggests a potential buying opportunity after a significant breakout and subsequent pullback. Key Observations: Bullish Trend Reversal: The price has clearly broken out of a major descending trendline (shown in green), which had been acting as resistance. This breakout indicates a potential shift in momentum from bearish to bullish. Continuation Pattern: Following the initial breakout, the price has established a new short-term uptrend, which is supported by the steep yellow ascending trendline. The current price action is a pullback or consolidation after a strong upward impulse. Fibonacci Retracement: A Fibonacci retracement tool has been applied to the most recent upward wave (from the low around the 19th to the recent high). This helps identify potential support levels for a long entry: 0.382 level: ~3,360.19 0.5 level: ~3,358.26 0.618 level: ~3,356.33 This "golden zone" between the 0.382 and 0.618 levels is a common area for a trend to resume after a pullback. Proposed Trade Setup (Long Position) The chart explicitly outlines a long (buy) trade with the following parameters: Entry: The suggested entry point is within the Fibonacci retracement zone, likely around the 3,360.00 area. The trader is waiting for the price to dip into this support zone before entering. Stop Loss (SL): The stop loss is placed at approximately 3,350.553. This level is strategically set below the 0.618 Fibonacci level and the recent swing low, invalidating the bullish setup if breached. Take Profit (TP): TP 1: The first target is marked by the white horizontal line at approximately 3,371.00. Final Target: The full target of the trade setup extends much higher, towards the 3,388.00 price area. Risk/Reward Ratio (R/R): The trade setup shows a highly favorable risk-to-reward ratio of 4.21. This means the potential profit is over four times the potential loss, making it an attractive setup from a risk management perspective. Conclusion The analysis points to a high-probability bullish continuation for XAU/USD. The strategy is to enter a long position during the current pullback, targeting the support levels identified by the Fibonacci retracement. The well-defined stop loss and excellent risk/reward ratio make this a structured and compelling trade idea. The key is for the price to find support in the entry zone and continue its upward momentum.
Rich_From_Home
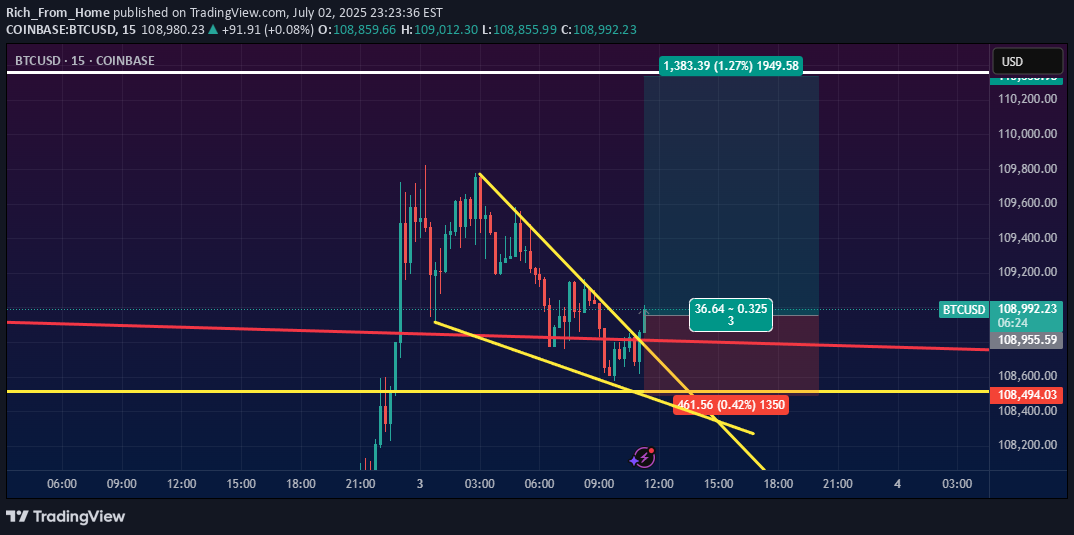
Btc formed a falling wedge pattern and also tested the Resistance become support, and also in the major trend has broken the trendline.
Rich_From_Home
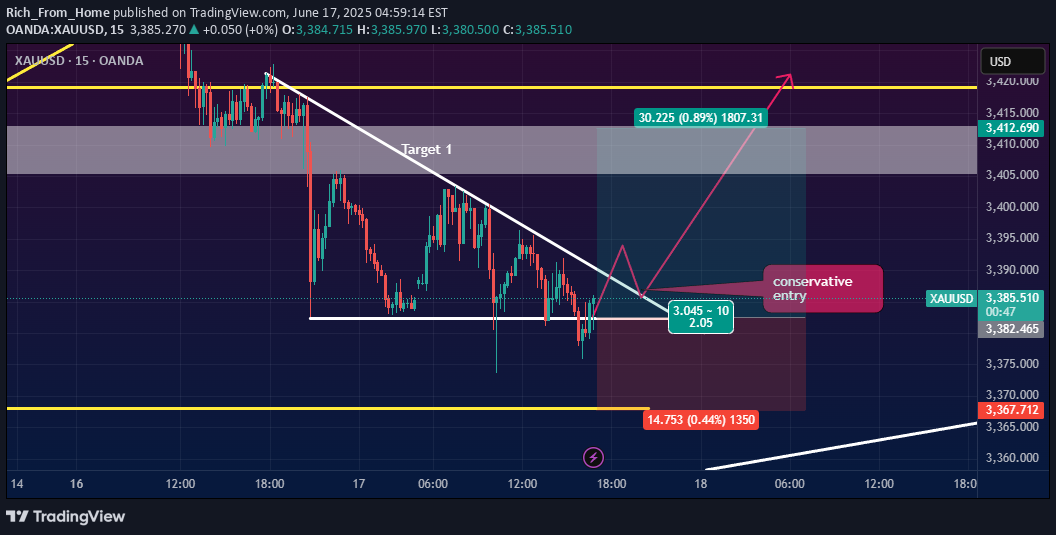
Actually 50-50 there is potential for prices to go up or down, but by chance it is safer for us to take a buy because of the w pattern, so here I took a buy, for conservative entry wait for a breakout, but if later it looks like a fake breakout has broken out upwards but goes back down then we will stop and reverse to take a sell.Fakeout, stop and reverseClose due to news
Rich_From_Home
Gold needs a correction, it has made a very extreme increase yesterday, but the increase is not forever, it needs a healthy correction too, with a drop base drop pattern.
Rich_From_Home
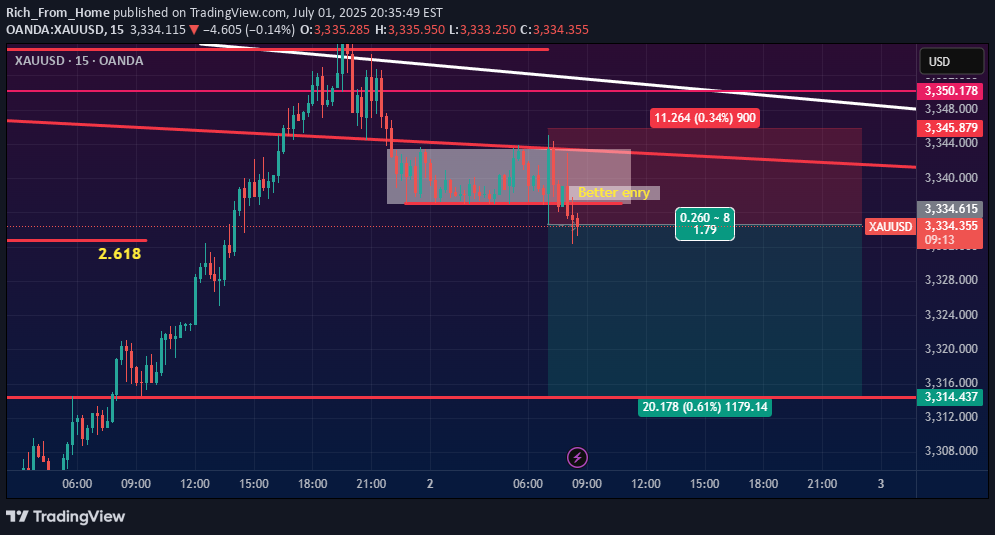
This pattern looks like a descending triangle, the target should be down, but if I see this as a trap, I have been looking at gold charts for more than 10 years, I have an intuition that this is a trap. for conservative entry, you can wait for the break of the digonal trendline.
Disclaimer
Any content and materials included in Sahmeto's website and official communication channels are a compilation of personal opinions and analyses and are not binding. They do not constitute any recommendation for buying, selling, entering or exiting the stock market and cryptocurrency market. Also, all news and analyses included in the website and channels are merely republished information from official and unofficial domestic and foreign sources, and it is obvious that users of the said content are responsible for following up and ensuring the authenticity and accuracy of the materials. Therefore, while disclaiming responsibility, it is declared that the responsibility for any decision-making, action, and potential profit and loss in the capital market and cryptocurrency market lies with the trader.