Technical analysis by Rich_From_Home about Symbol PAXG: Buy recommendation (7/21/2025)

Rich_From_Home
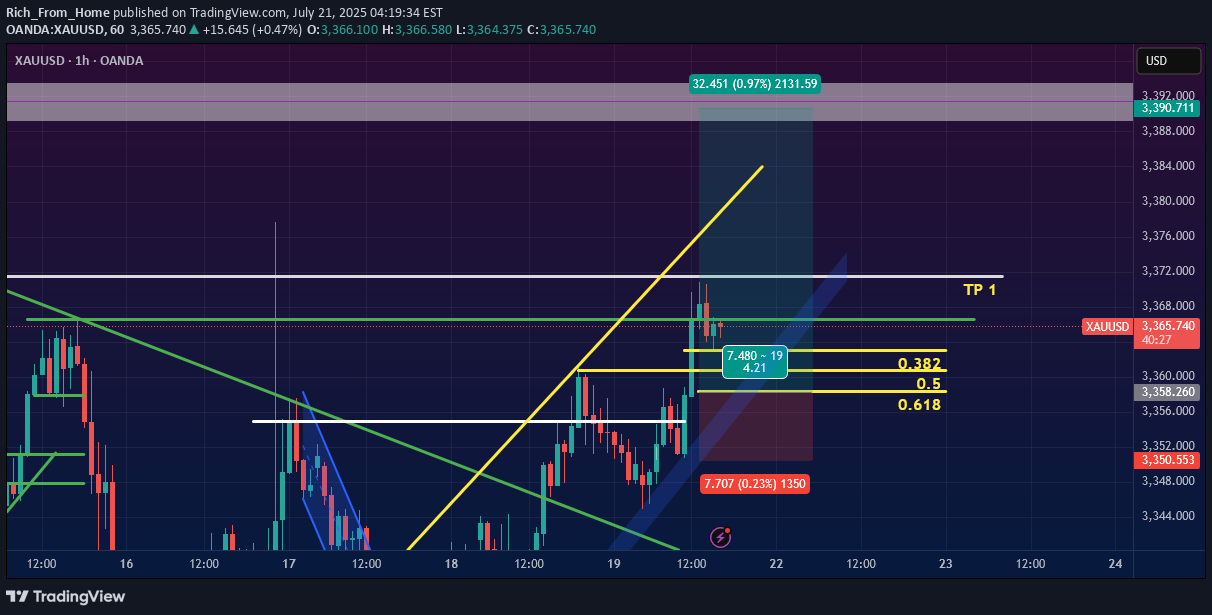
This chart presents a bullish trade setup for XAU/USD based on several technical indicators and patterns. The analysis suggests a potential buying opportunity after a significant breakout and subsequent pullback. Key Observations: Bullish Trend Reversal: The price has clearly broken out of a major descending trendline (shown in green), which had been acting as resistance. This breakout indicates a potential shift in momentum from bearish to bullish. Continuation Pattern: Following the initial breakout, the price has established a new short-term uptrend, which is supported by the steep yellow ascending trendline. The current price action is a pullback or consolidation after a strong upward impulse. Fibonacci Retracement: A Fibonacci retracement tool has been applied to the most recent upward wave (from the low around the 19th to the recent high). This helps identify potential support levels for a long entry: 0.382 level: ~3,360.19 0.5 level: ~3,358.26 0.618 level: ~3,356.33 This "golden zone" between the 0.382 and 0.618 levels is a common area for a trend to resume after a pullback. Proposed Trade Setup (Long Position) The chart explicitly outlines a long (buy) trade with the following parameters: Entry: The suggested entry point is within the Fibonacci retracement zone, likely around the 3,360.00 area. The trader is waiting for the price to dip into this support zone before entering. Stop Loss (SL): The stop loss is placed at approximately 3,350.553. This level is strategically set below the 0.618 Fibonacci level and the recent swing low, invalidating the bullish setup if breached. Take Profit (TP): TP 1: The first target is marked by the white horizontal line at approximately 3,371.00. Final Target: The full target of the trade setup extends much higher, towards the 3,388.00 price area. Risk/Reward Ratio (R/R): The trade setup shows a highly favorable risk-to-reward ratio of 4.21. This means the potential profit is over four times the potential loss, making it an attractive setup from a risk management perspective. Conclusion The analysis points to a high-probability bullish continuation for XAU/USD. The strategy is to enter a long position during the current pullback, targeting the support levels identified by the Fibonacci retracement. The well-defined stop loss and excellent risk/reward ratio make this a structured and compelling trade idea. The key is for the price to find support in the entry zone and continue its upward momentum.
