Technical analysis by Rich_From_Home about Symbol PAXG: Sell recommendation (7/24/2025)

Rich_From_Home
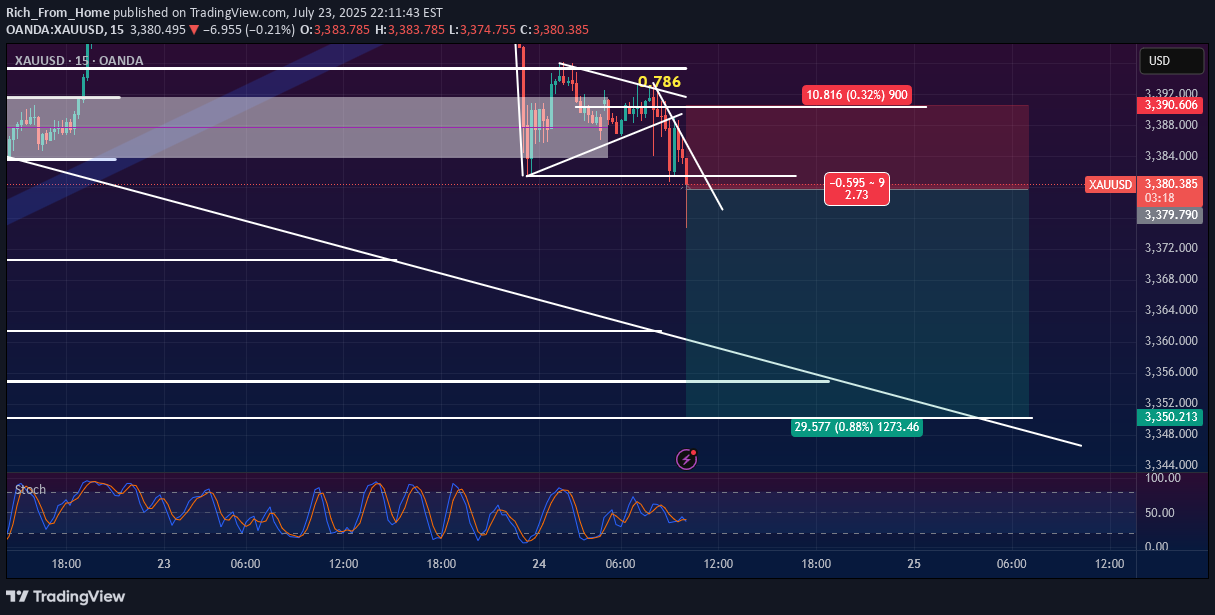
This analysis outlines a potential short (sell) trading opportunity on the XAUUSD (Gold/USD) 15-minute chart. The setup is based on a bearish continuation pattern following a sharp price drop. Key Observations: Pattern Formation: After a significant downward impulse move, the price has entered a consolidation phase, forming a symmetrical triangle or a bearish pennant. This type of pattern typically signals a temporary pause before the downtrend resumes. Fibonacci Confluence: A Fibonacci retracement tool has been drawn from the recent swing high to the swing low. The price has struggled to break above the 0.786 Fibonacci level, which is acting as strong resistance. This rejection adds significant weight to the bearish outlook. Support and Confirmation: The horizontal line at approximately 3,380.348 is a critical support level. The chart includes an important instruction: "Wait for confirmation break support." This emphasizes the need to see a decisive candle close below this level before entering a trade, to avoid a false breakdown (fakeout). Trade Setup Details: Asset: XAUUSD Timeframe: 15-Minute (M15) Bias: Bearish (Short/Sell) Entry: The proposed entry is on a confirmed breakdown below the support level of ~3,380.348. Stop Loss (SL): The stop loss is placed at 3,391.691. This level is strategically set above the recent consolidation high and the 0.786 Fibonacci resistance, protecting the trade from price spikes. Risk: 11.343 points (0.34%) Take Profit (TP): The profit target is set at 3,350.213. This target aligns with a previous area of support, making it a logical level for price to reach. Reward: 30.135 points (0.89%) Risk/Reward Ratio (RRR): The setup offers an attractive risk/reward ratio of 2.66, meaning the potential profit is 2.66 times greater than the potential loss. Indicator Analysis: Stochastic Oscillator (Stoch): The stochastic indicator at the bottom is in the mid-range and not in the overbought or oversold territory. This is neutral and does not contradict the bearish price action setup. Conclusion: This is a well-defined bearish trade setup that aligns with the recent price momentum. The strategy is to wait for a confirmed break of the immediate support structure. The confluence of the bearish pennant/triangle pattern, rejection from a key Fibonacci level, and a favorable risk/reward ratio makes this a high-probability trading idea. Prudence is advised by waiting for clear confirmation before execution.Cut loss we loss 1/2 posisition, its a fakeout
