
RakyatTrader
@t_RakyatTrader

What symbols does the trader recommend buying?
Purchase History
پیام های تریدر
Filter
تحلیل تکنیکال طلا: از منطقه واکنش تا صعود بزرگ (اهداف 4117 و 4259)
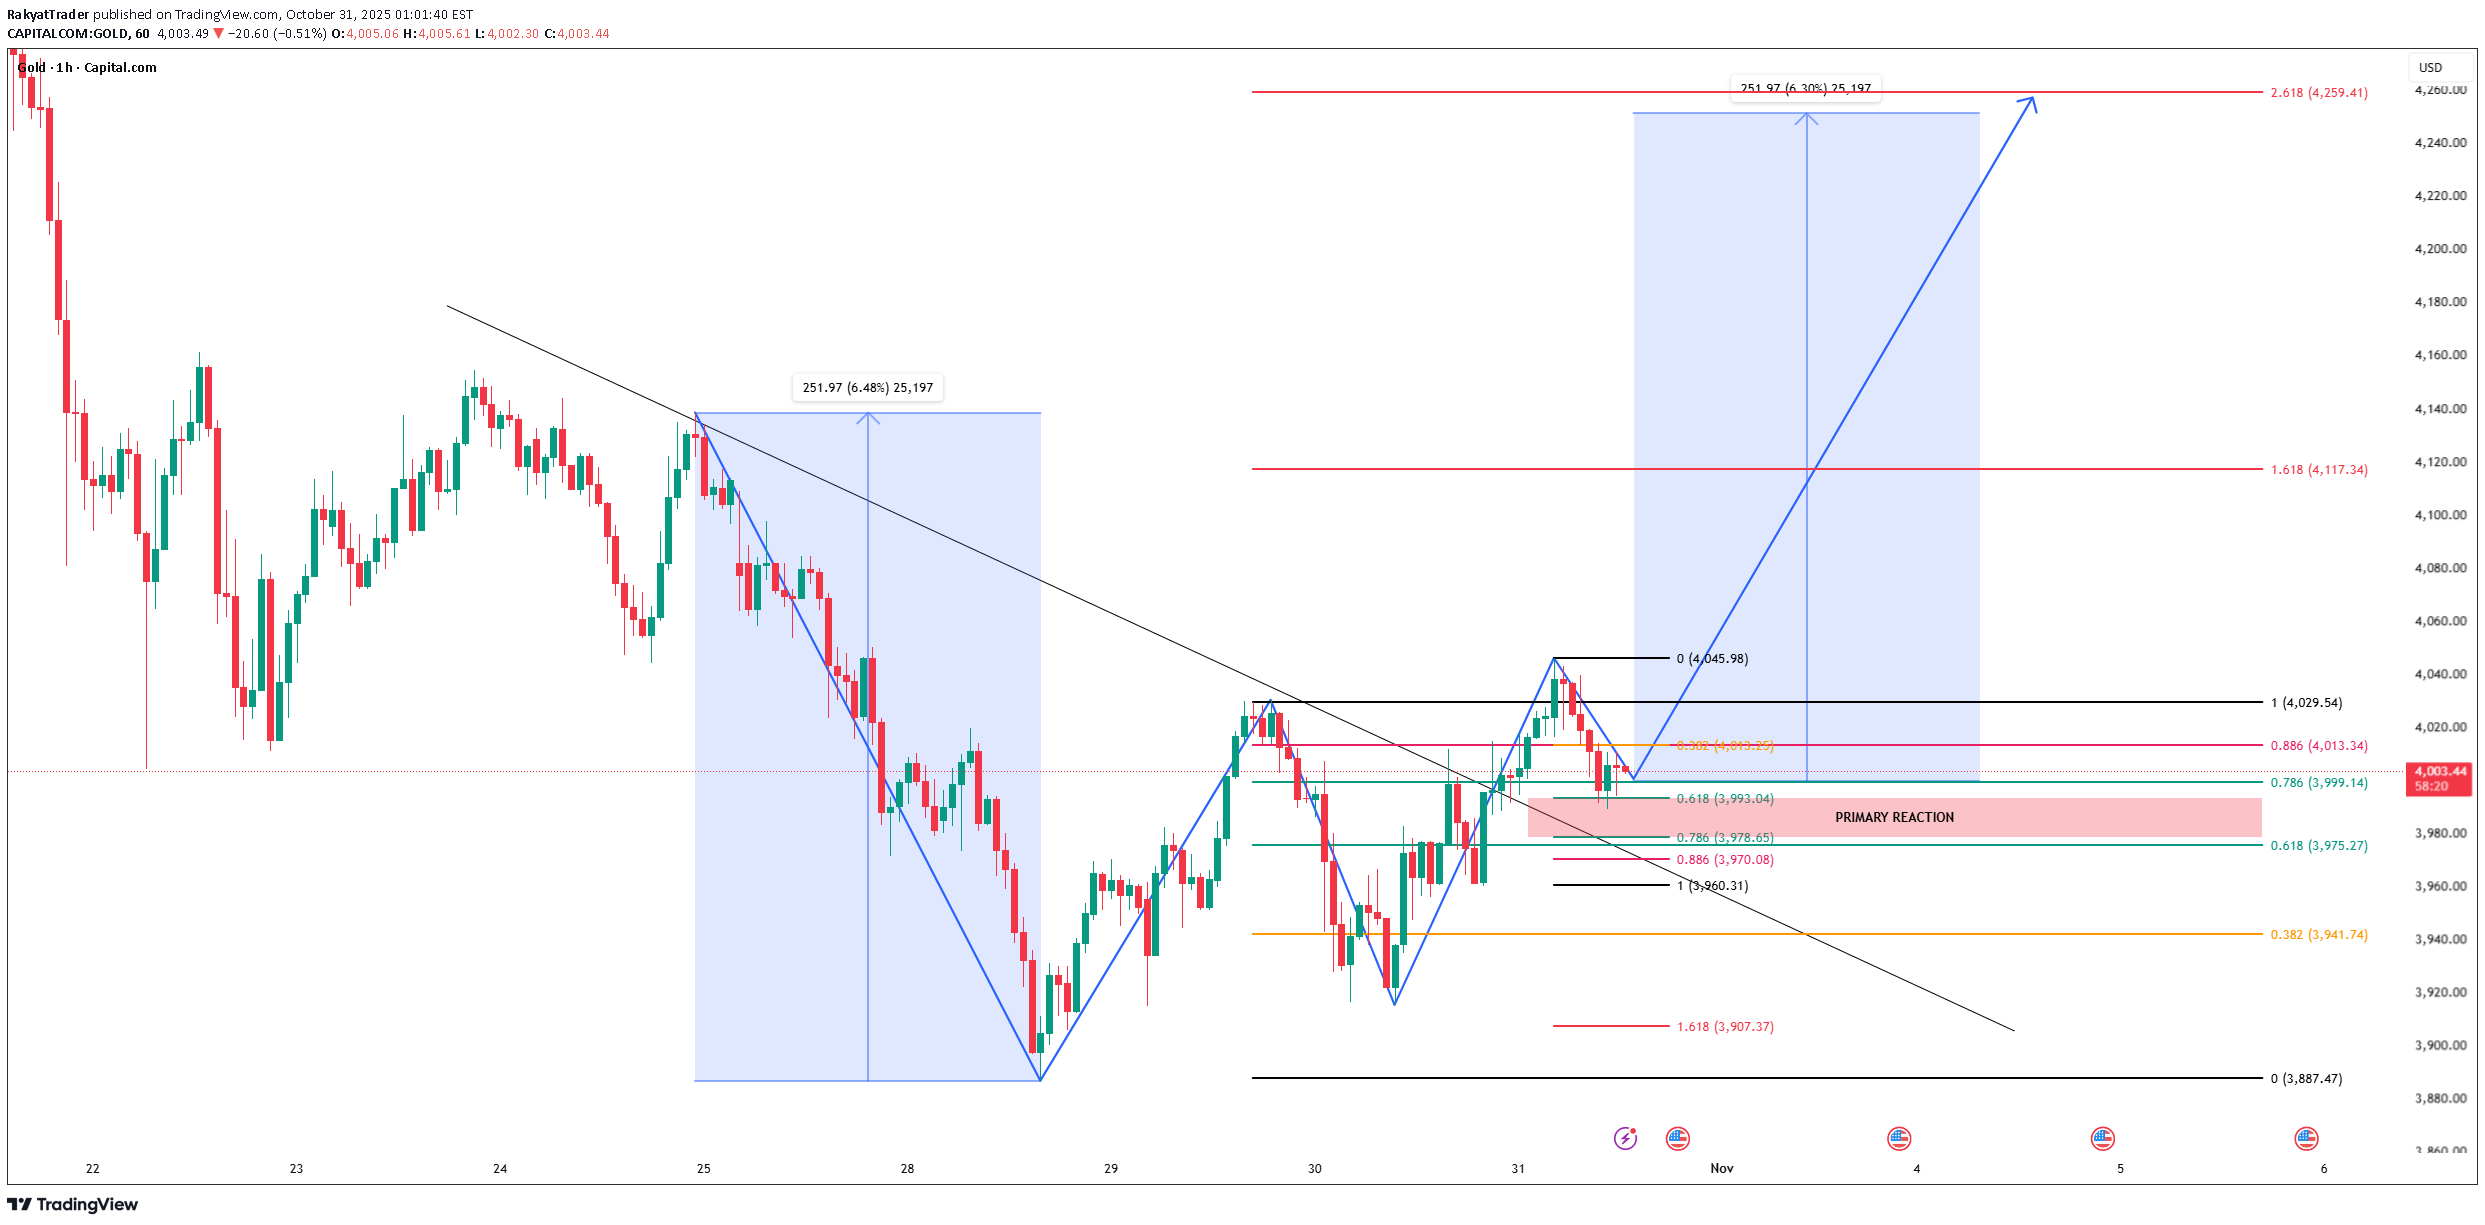
Structure and Trendline Break Gold on the H1 timeframe shows a clear breakout from the descending trendline, signaling a structural shift from bearish to potential bullish continuation. The breakout is supported by the formation of a higher low, suggesting growing buying pressure. ABC Pattern and Key Retracement Zone After the first bullish impulse from 3887 to 4045, price is now in a corrective phase (wave B), pulling back into the Fibonacci retracement zone: 0.618 (3993) to 0.786 (3978) marks the PRIMARY REACTION ZONE, where buyers are likely to step back in. A strong bullish reaction from this zone would confirm the start of wave C. Fibonacci Extension Targets If the bullish continuation (wave C) unfolds as projected: 1.618 extension at 4117 → short-term bullish target. 2.618 extension at 4259 → main bullish projection, mirroring the prior impulsive move. As long as price holds above the 3950–3980 support range, the bullish structure remains intact. Trading Bias & Summary Bias: Bullish (while above 3980) Ideal Entry: Buy limit around 3980–3995 (Primary Reaction Zone) Invalidation: Break below 3950 (signals potential deeper correction) Targets: 4117 and 4259
طلا در نقطه حساس: خریداران یا فروشندگان پیروز میشوند؟ (تحلیل سطح به سطح)
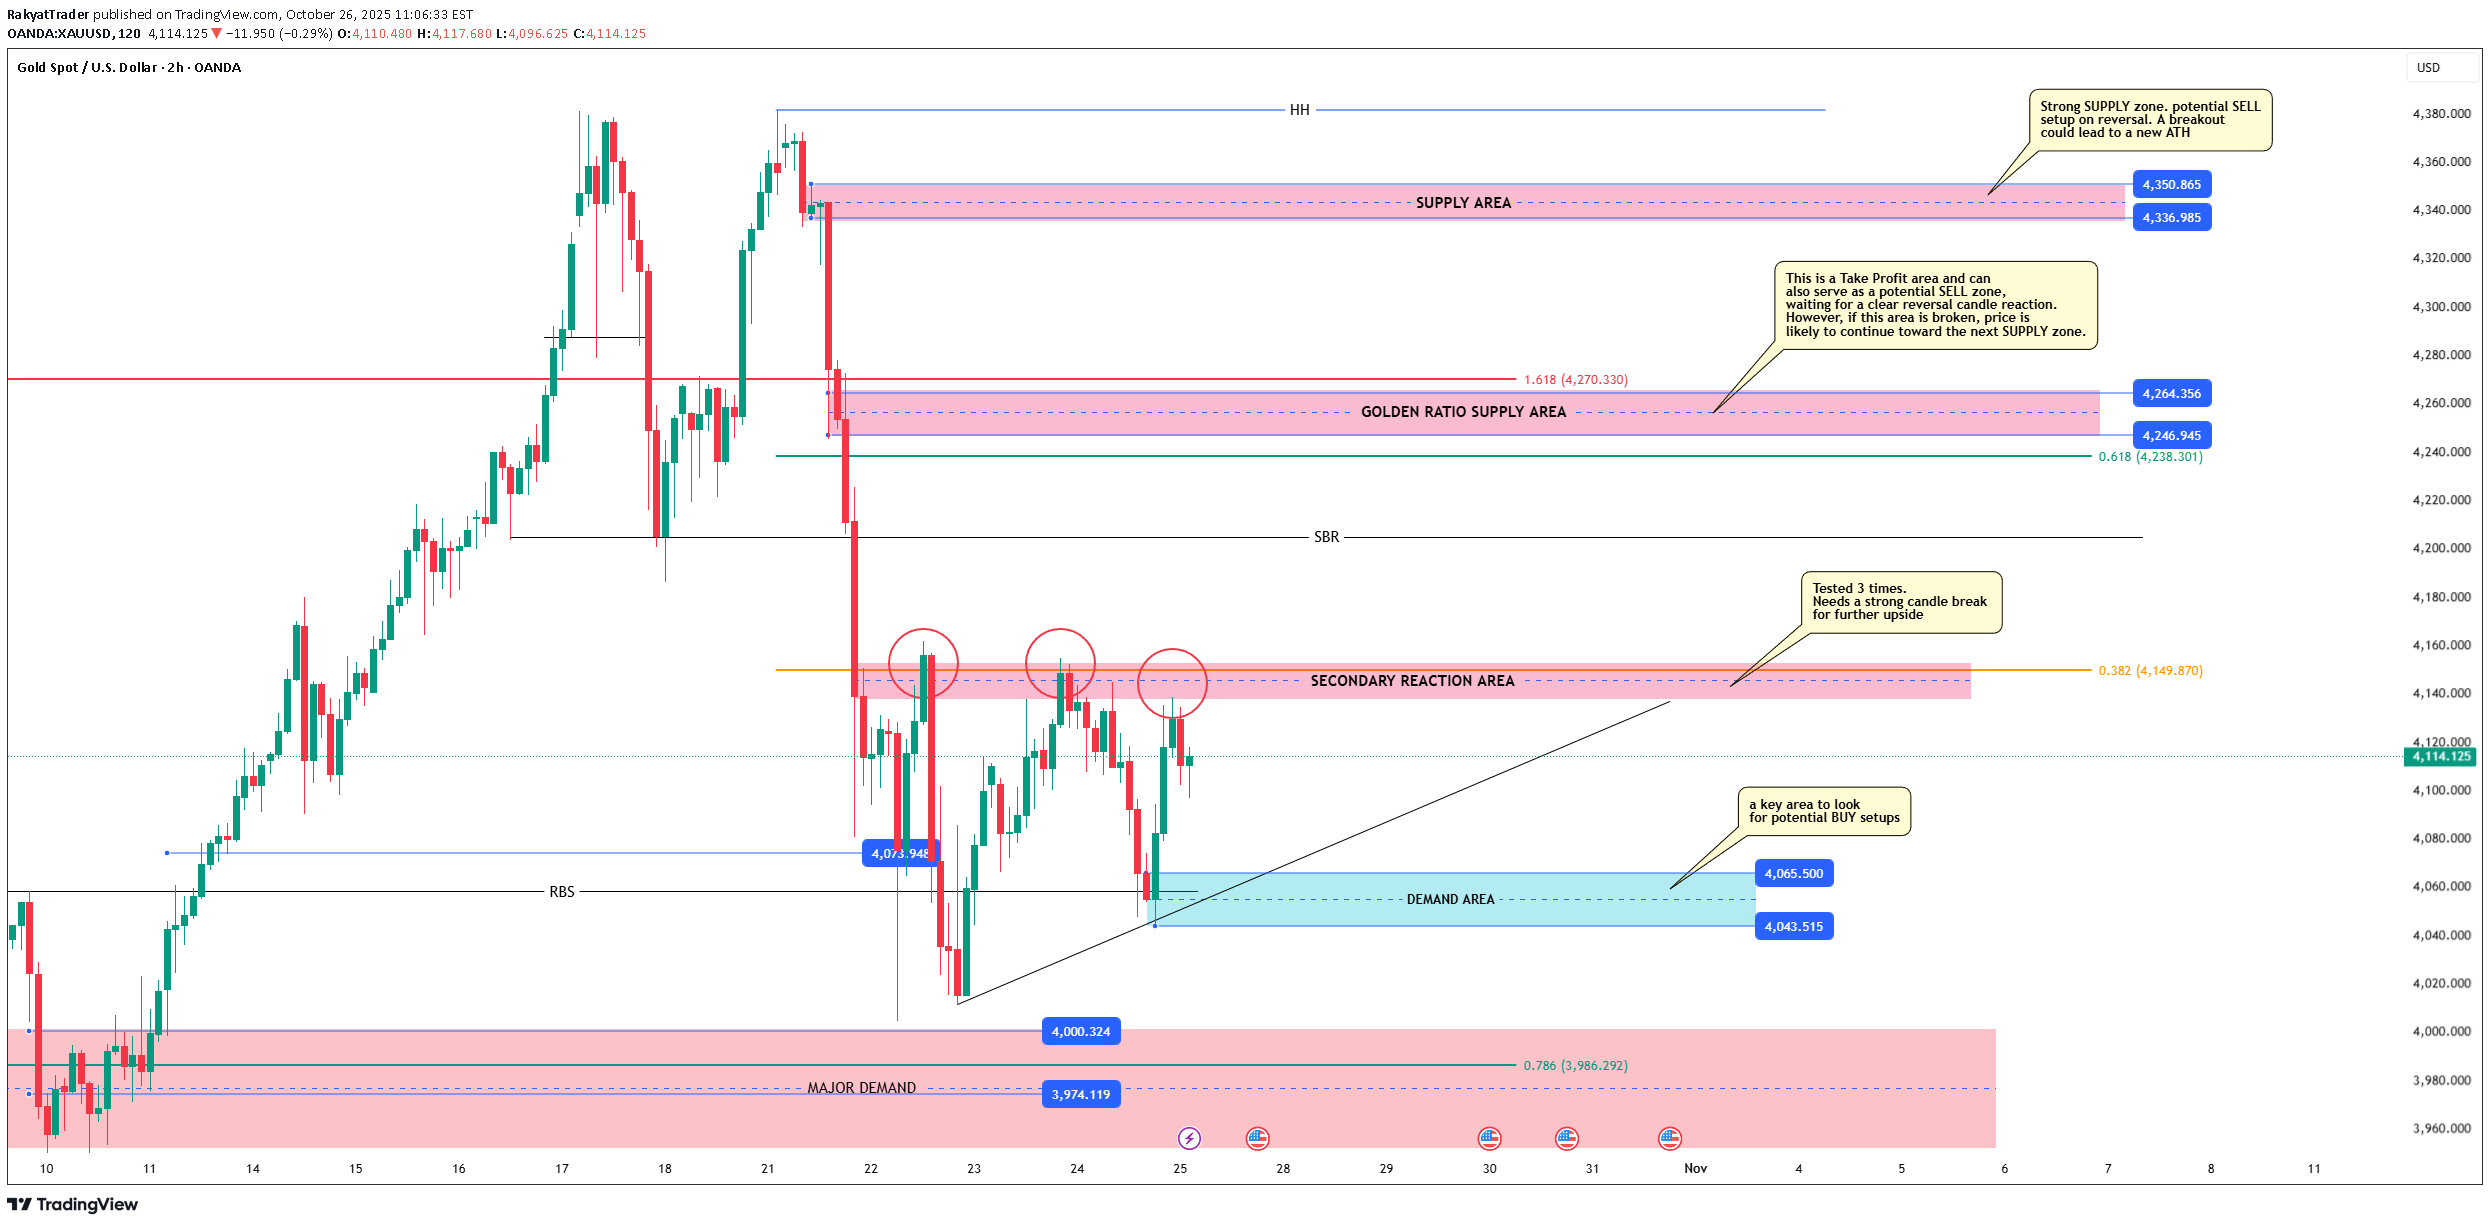
1. Market Structure Overall, gold is currently in a corrective phase following a strong bullish rally. The latest move formed a Higher High (HH) around 4,350–4,360, followed by a sharp rejection — signaling that supply pressure has started to take control. 2. Supply Zone & SELL Potential Strong Supply Zone (4,336–4,350): This is a key resistance area where price previously faced heavy rejection. If price retests this level, it could provide a potential SELL setup, especially if a clear reversal candle such as a bearish engulfing or shooting star appears. However, if this zone is broken with a solid bullish candle, the market could likely print a new All-Time High (ATH) in line with the medium-term bullish momentum. 3. Golden Ratio Supply Area (around 4,246–4,264) This area acts as both a Take Profit zone for prior long positions and a directional confirmation zone. A failure to break above could trigger another rejection and deeper pullback, strengthening short-term bearish pressure. 4. Secondary Reaction Area (around 4,150) This zone has been tested three times, confirming a strong short-term supply presence. Plan: wait for a strong bullish breakout candle above this area to validate a continuation move. If another rejection forms, price could head back toward the Demand Area (4,065–4,043). 5. Demand Area (4,065–4,043) A key level for potential BUY setups. Look for a clear bullish reversal candle before entering. If this zone holds, the market could rebound higher. But if it breaks down, price may extend lower toward the Major Demand zone (3,974–3,986). 6. Major Demand (3,974–3,986) A strong base zone capable of halting further downside movement. Suitable for swing BUY setups with a favorable risk-reward ratio, as long as price stays above this level. Trading Plan Summary BUY PLAN: Wait for bullish confirmation near Demand Area (4,065–4,043) or Major Demand (3,974–3,986). First targets: Secondary Reaction Area (4,150) and Golden Ratio Supply (4,246). SELL PLAN: Wait for clear rejection or reversal candle near Golden Ratio Supply (4,246) or Strong Supply (4,336–4,350). Target: Demand Area (4,065–4,043). Conclusion Gold is currently in a neutral strategic zone, squeezed between strong supply and solid demand. The next directional move will largely depend on how price reacts around the Secondary Reaction Area and Demand Area. The key principle: don’t predict—react to confirmation.
آمادهسازی طلا (XAUUSD) برای صعود بزرگ: سطوح کلیدی خرید و فروش
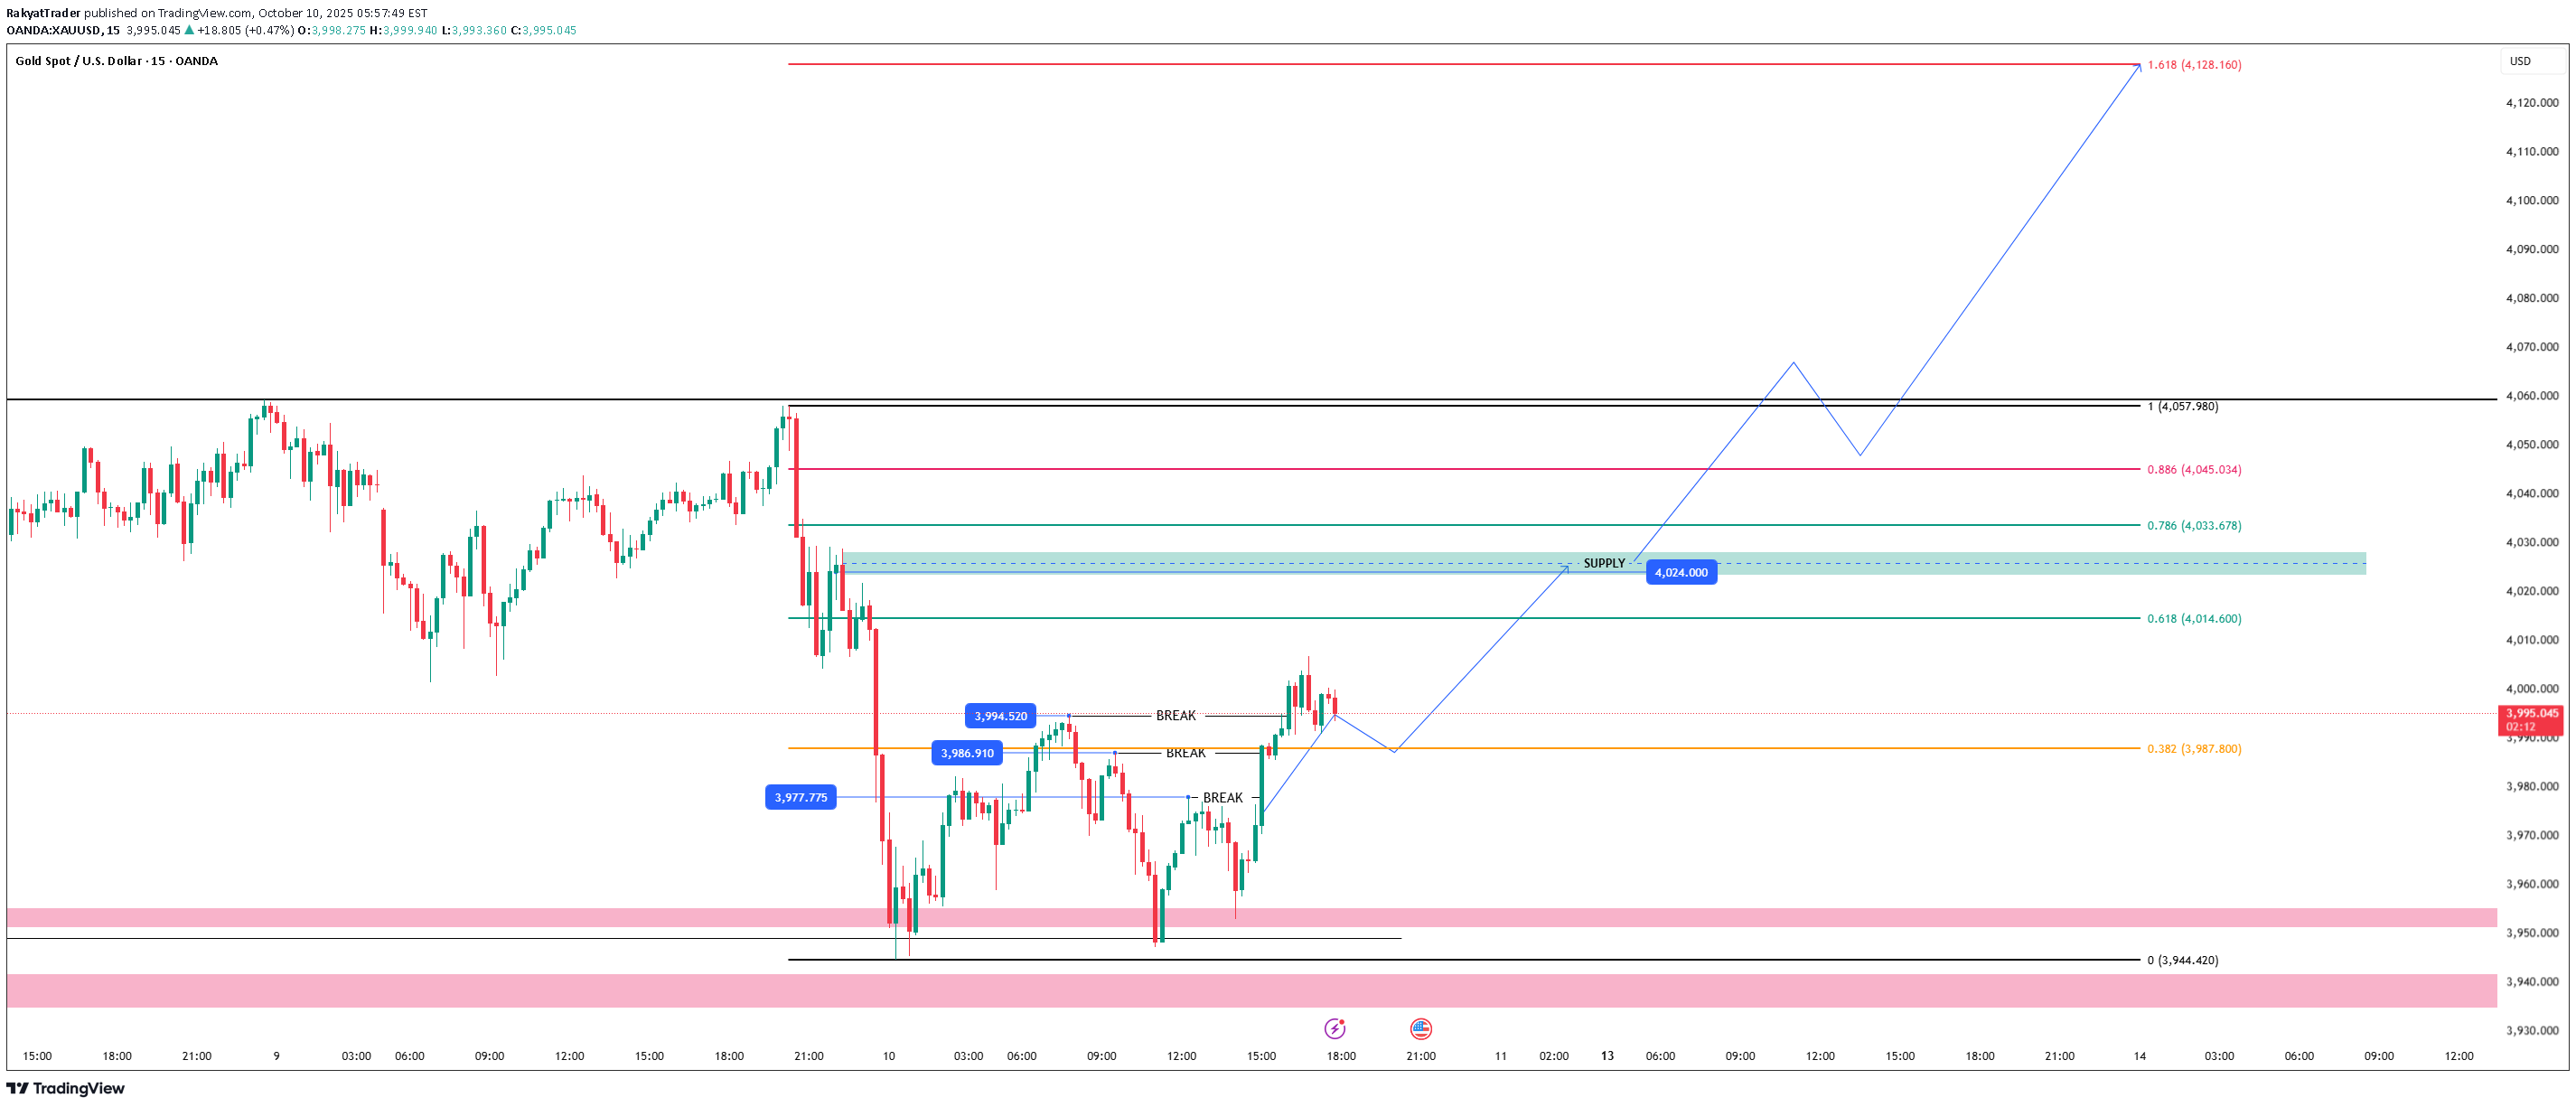
Gold (XAU/USD) is currently maintaining a short-term bullish structure after breaking several key resistance levels. Multiple Breaks of Structure (BOS) on the 15-minute chart signal a shift in momentum from bearish to bullish. As long as the price holds above the 3,977–3,970 support zone, the overall bias remains upward. The current formation of higher highs and higher lows suggests buyers are still in control, setting the stage for a potential continuation rally. The first demand zone lies between 3,944 – 3,955, where the last bullish impulse originated — a critical area for potential re-entry buys if the price retraces deeply. On the upside, the 4,014 – 4,033 range marks a strong supply zone that coincides with the Fibonacci 0.618–0.786 retracement levels. Should bulls manage to clear this supply zone, price could extend toward the 4,057 (1.0 Fibonacci) level, and possibly reach the 4,128 (1.618 extension) as the next swing target. The primary scenario anticipates a minor pullback toward 3,985 (Fib 0.382) before resuming its bullish move toward 4,024 (supply). A clean break above that zone could accelerate momentum toward 4,057–4,128. Alternatively, if price breaks below 3,977, it might retest the demand base at 3,944–3,955 before another bullish attempt. The technical landscape points to a bullish continuation setup with well-defined risk. Gold is preparing for a possible surge, but traders should stay patient for confirmation at key retracement levels. As always — trade the plan, not emotions.
XAUUSD Daily: Fed’s Dovish Signals & Key Breakout Level Ahead
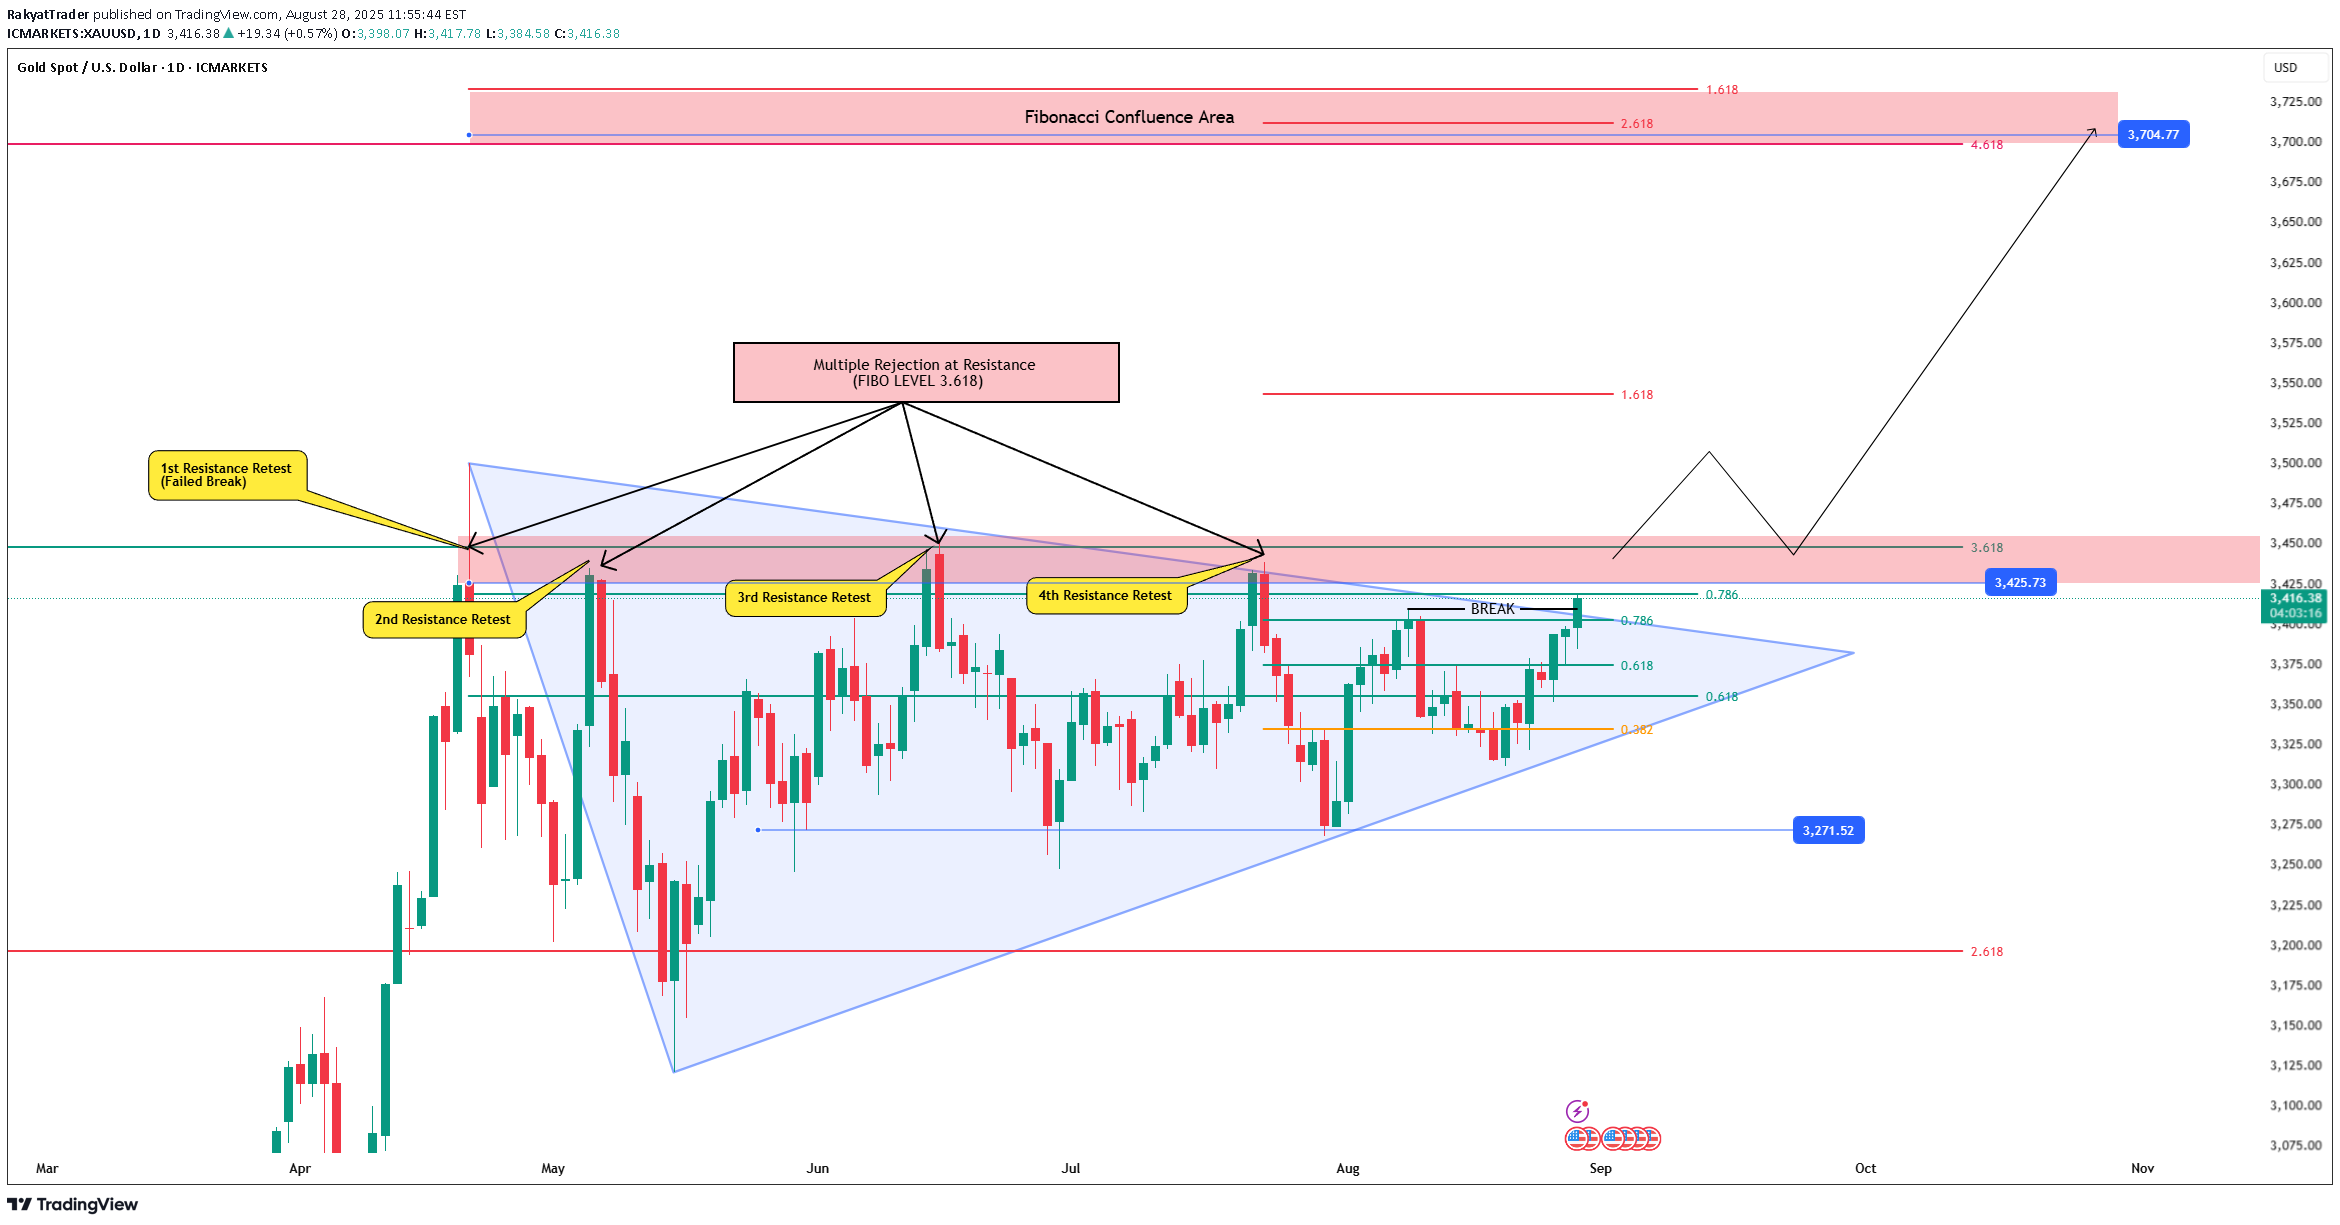
Gold prices are currently at a critical juncture, consolidating within a symmetrical triangle that has been developing over an extended period. An initial breakout near the 3,414 level signaled potential bullish continuation; however, the key challenge remains at a well-tested resistance zone that has repeatedly capped upward momentum. 1. Fundamental Update According to Investing.com, Fed Chair Jerome Powell emphasized during his Jackson Hole speech that the Fed is considering rate cuts as inflation remains elevated while unemployment begins to rise. This creates a unique macro backdrop: persistent inflation concerns on one hand, but weakening labor market conditions on the other. Powell acknowledged that labor market risks “may warrant rate cuts,” though he refrained from explicitly endorsing immediate action. 2. Resistance Structure The chart shows four distinct retests of the same resistance zone. Each approach toward the 3.618 Fibonacci level has resulted in sharp rejections, confirming the area as a major resistance cluster. Such multiple rejections at resistance often resolve either with a deeper correction or a decisive breakout once buyers gain control. 3. Fibonacci Confluence Area Above the current resistance, a Fibonacci confluence zone exists around 3,704.77, formed by overlapping levels of 1.618, 2.618, and 4.618 from multiple swings. This area serves as a key upside target if the 3,425–3,450 resistance band is broken decisively. 4. Scenario Analysis Bullish Scenario A confirmed daily close above 3,425–3,450 with a solid candle body would open the door to 3,555 (1.618 extension), with further upside potential toward 3,704 (Fibonacci confluence). Such a breakout would mark a strong shift in buyer dominance, increasing the probability of a new higher high. Bearish Scenario If rejection occurs again at resistance, price could retreat toward the triangle support near 3,271.52. A breakdown below this support would expose downside risks toward 3,100–3,150 (2.618 extension). Conclusion Gold is at a decisive crossroads. Fundamentally, Powell’s dovish tone regarding labor market risks supports the bullish case. Technically, the 3,425–3,450 zone remains the pivotal level: a valid breakout would strengthen the case for a rally toward 3,704, while failure to clear resistance would prolong consolidation and increase the risk of a corrective move back to 3,271 or lower.
BTCUSD Outlook: Key Breakout at 113K and Trading Scenarios Ahead
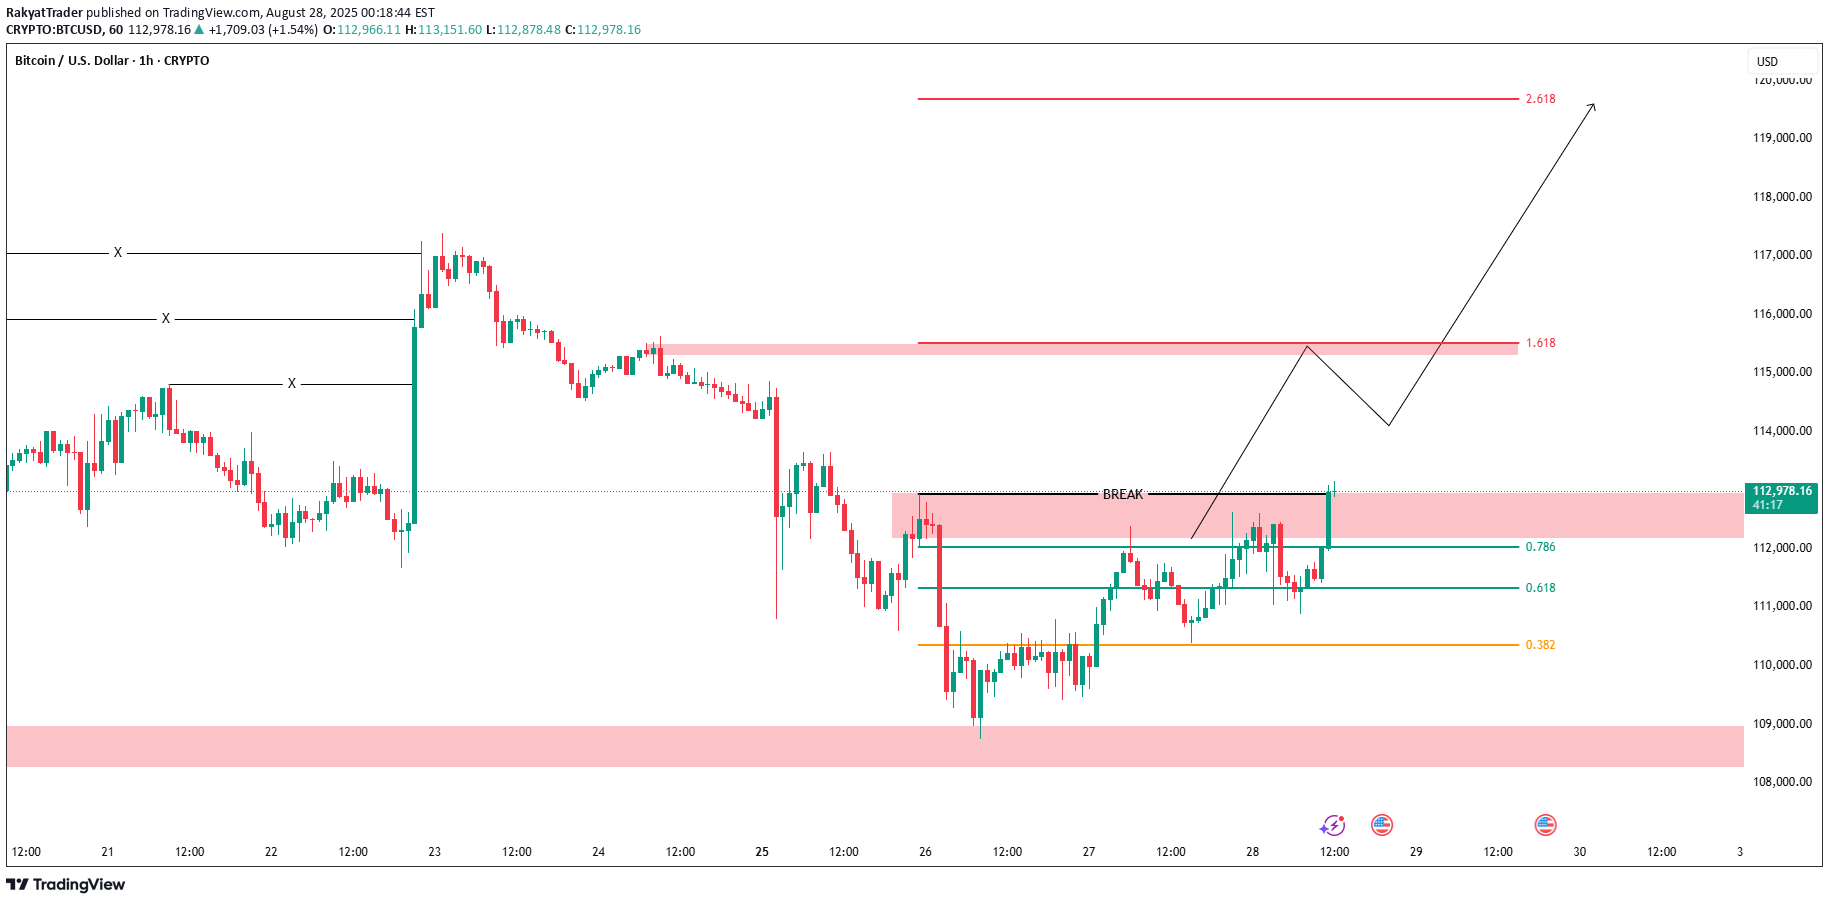
Scenario 1 – Bullish Continuation Price has broken above the minor supply zone around 112,800 – 113,000. If this breakout is confirmed with a valid retest, the next upside target is the supply zone at 115,000 – 115,500 (Fibonacci extension 1.618). A solid breakout above this level could extend the rally toward 119,500 (Fibonacci 2.618). Trading plan: Entry buy after a retest of 112,800 – 113,000 (with bullish confirmation candle). Targets: 115,000 then 119,500. Stop loss: below 112,000 (to invalidate false breakout). Scenario 2 – Bearish Rejection If price fails to sustain above 113,000 and forms a strong rejection, a deeper correction is likely. The nearest support zone sits at 111,000 – 111,500 (Golden Ratio 0.618–0.786). Trading plan: Entry sell on rejection from 113,000. Target: 111,000. Stop loss: above 113,500. Scenario 3 – Bearish Breakdown If the 111,000 level breaks decisively with a solid candle body, bearish pressure will dominate. The next correction target is the demand zone around 108,000 – 108,500. Trading plan: Entry sell after a confirmed break below 111,000. Target: 108,000. Stop loss: above 112,000. Conclusion BTCUSD is now at a critical juncture around the 113K supply zone. A confirmed breakout could open the way toward 115K–119K, while failure to hold above 113K may trigger a correction toward 111K or even 108K. The key focus is on price action confirmation around 113K to define the next market direction.
XAUUSD Outlook: Triangle Breakout and Path Toward a New ATH
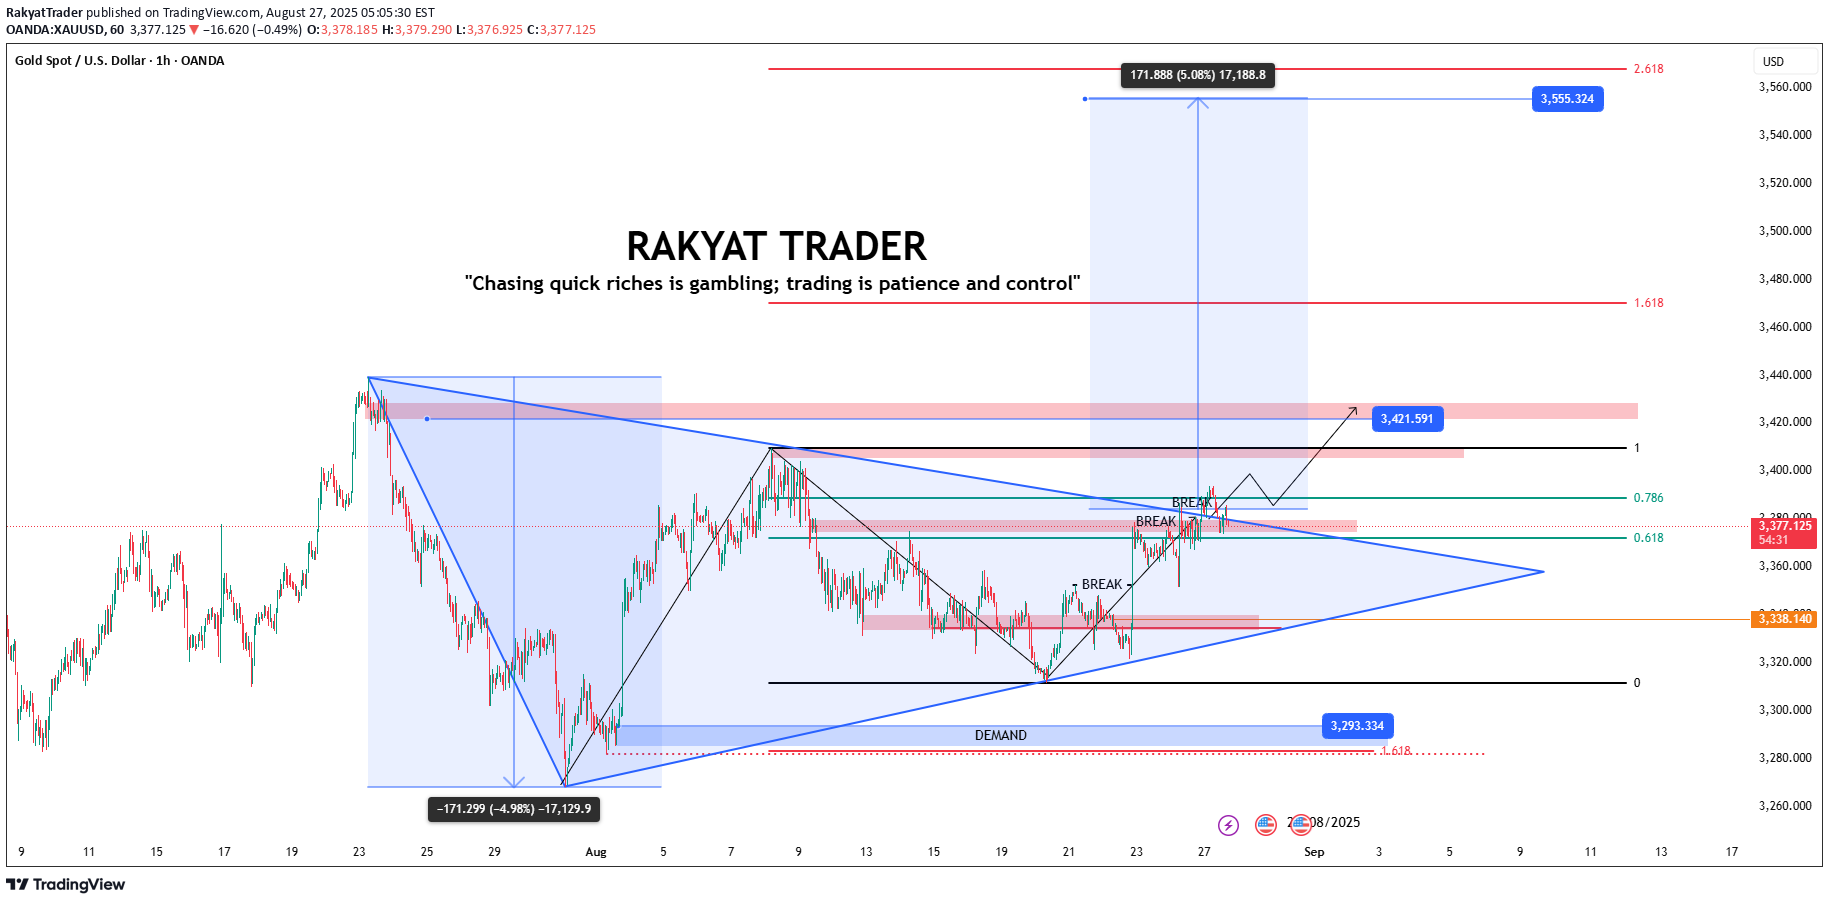
Gold is currently showing a symmetrical triangle breakout after several retests of the resistance trendline. This breakout, supported by a retest, signals the potential for continued bullish momentum. Demand and Support Zones The primary demand zone is located around 3,293.334, which has acted as a strong reversal level. As long as this zone holds, the broader bias remains bullish, with additional minor support near 3,338. Resistance and Supply Zones The nearest resistance lies at the supply zone around 3,421.591, closely aligned with key retracement levels. If this area is broken convincingly, the next bullish targets are the Fibonacci extensions: 1.618 near 3,480.000 and 2.618 around 3,555.324. Sustained momentum could open the path to a new All-Time High (ATH). Technical Scenarios Bullish Continuation – As long as price holds above the breakout line, upside potential remains dominant, targeting 3,421 and further toward 3,480–3,555. False Breakout / Pullback – If price falls back below the breakout line, deeper corrections toward 3,338 or even the primary demand at 3,293.334 could unfold. Conclusion Technically, XAUUSD is positioned in a bullish phase, validated by a breakout from consolidation. Short-term focus is on the 3,421 supply zone. Holding above 3,293 keeps the door open for an advance toward 3,480–3,555. A strong breakout above 3,421 would serve as a catalyst for the market to potentially achieve a new ATH in gold.
BTCUSD Outlook: Fibonacci Levels to New Highs
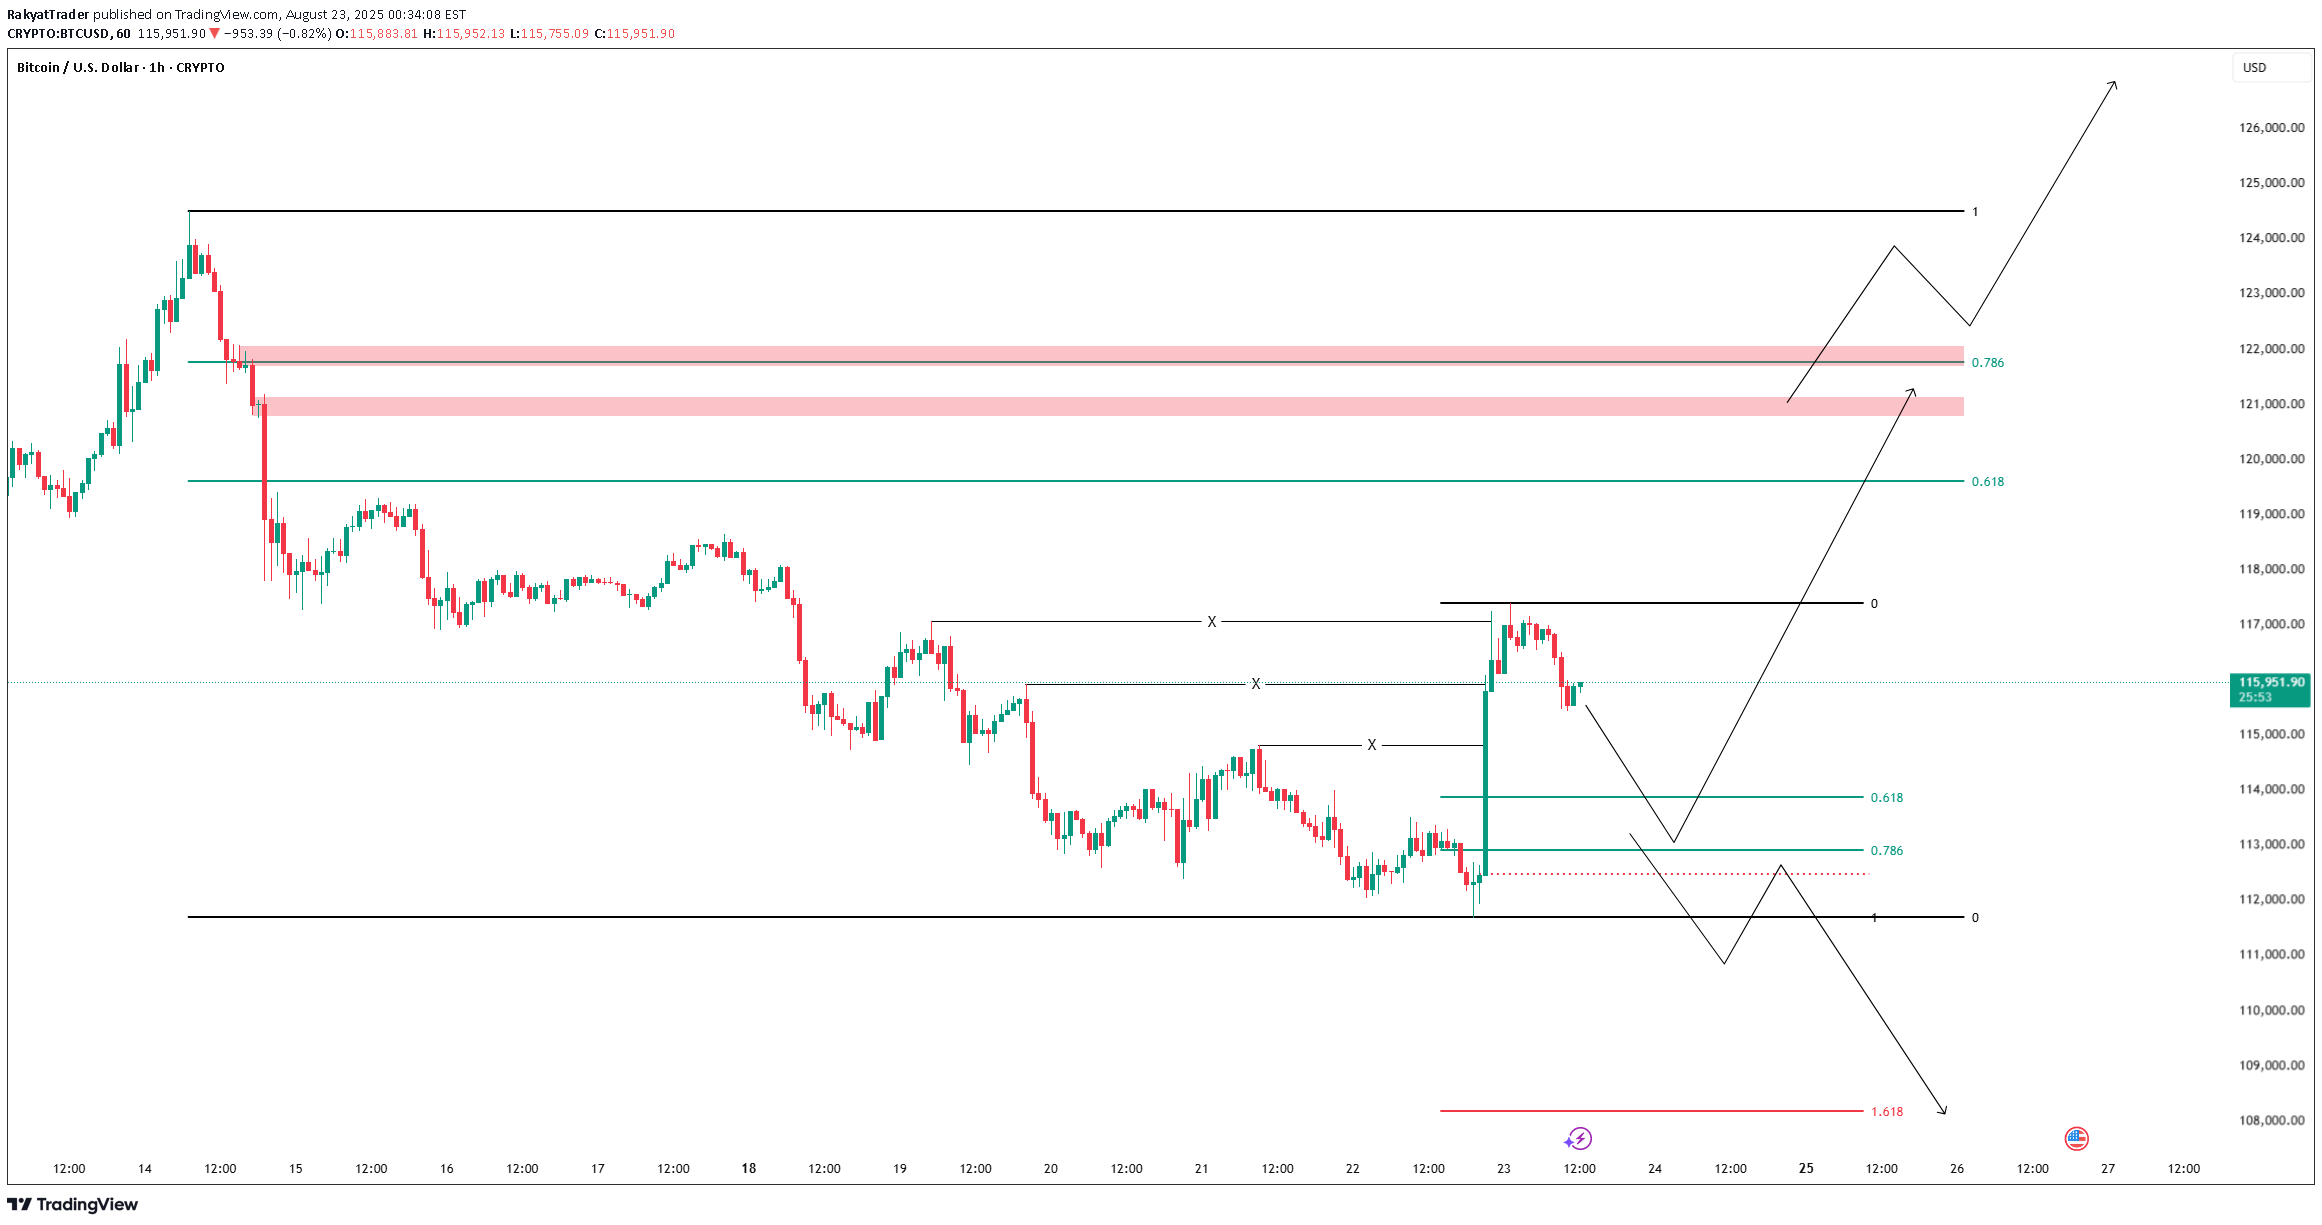
Plan 1 – Bullish Scenario (Fed Rate Cut Support) With the Federal Reserve signaling a rate cut, the probability of continued bullish momentum in BTCUSD remains strong. A corrective move may first test the Golden Ratio Fibonacci zone (0.618–0.786), drawn from the swing high 117,390.57 to the swing low 111,659.94, located between 112,908 – 113,846. If buyers step in from this zone, price could extend higher toward the supply zone at 120,818 – 121,730, which also aligns with the golden ratio retracement of the larger swing 124,501.31 – 111,659.94. Plan 2 – Bearish Scenario (Break of Golden Ratio Support) If the Fibonacci Golden Ratio support at 112,908 – 113,846 fails and price breaks down decisively, bearish pressure could intensify, targeting the 1.618 Fibonacci extension around 108,157. This would confirm sellers regaining control after buyers failed to defend a key retracement level. Plan 3 – Bullish Continuation (Toward a New ATH) If the supply zone at 120,818 – 121,730 is broken with a solid candle body—a strong sign of buyer dominance—BTC could enter a more aggressive bullish phase. In this scenario, momentum may drive price into uncharted territory, opening the door to a new All-Time High (ATH). Conclusion BTCUSD is currently positioned at a critical juncture. A healthy pullback into Fibonacci support could provide buyers with the setup to retest the 120k–121k supply zone. Conversely, a break below 113k may expose deeper downside toward 108k. On the flip side, a strong breakout above 121k would shift the market outlook toward a potential new ATH.
XAUUSD Technical Outlook: Buyer’s Last Stand at Demand
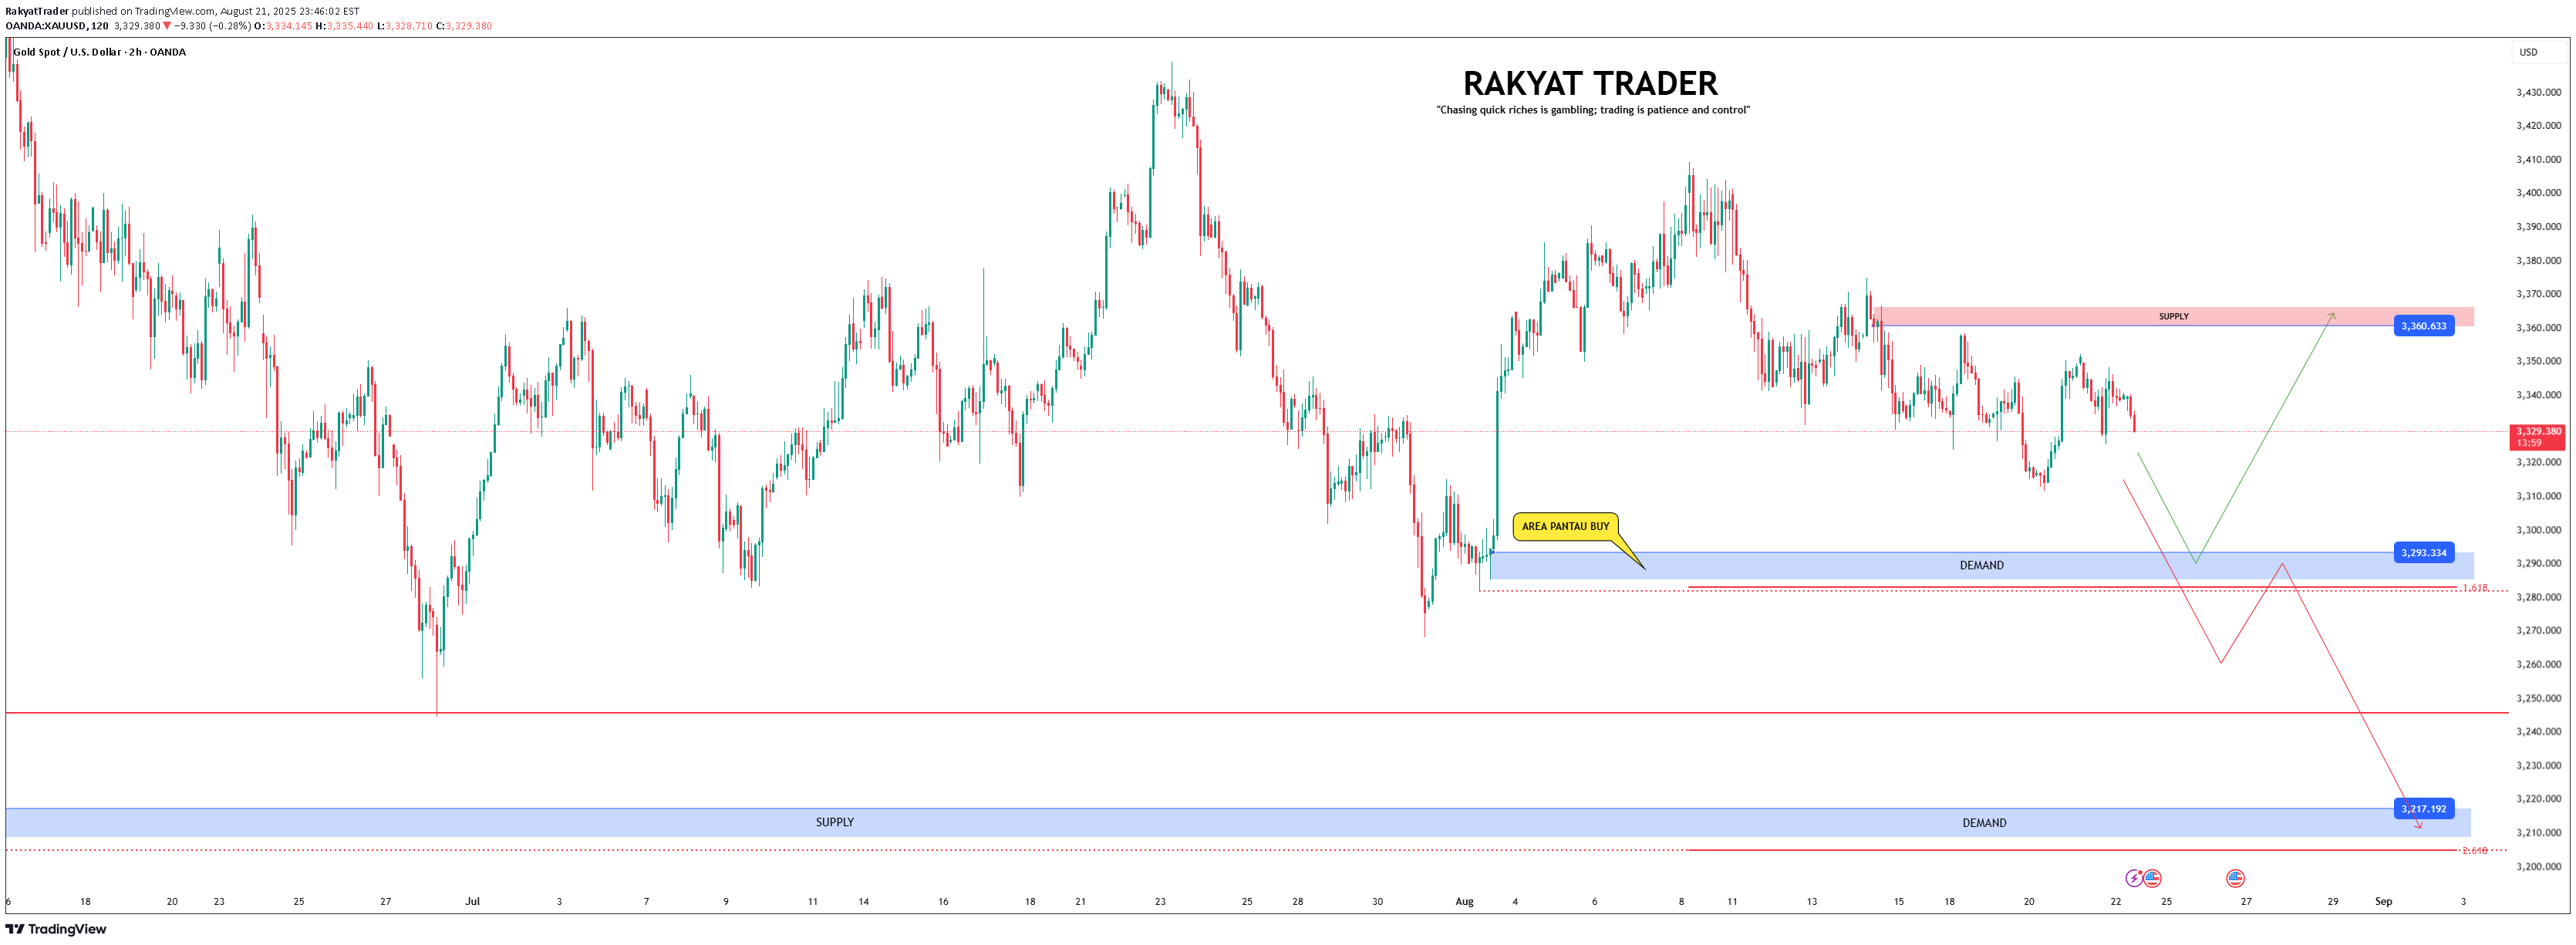
XAUUSD Outlook (Gold Spot / USD, H2) Gold is currently trading around 3,329 and approaching a key demand zone at 3,293.334. This area is basically the “battlefield” between buyers and sellers. Let’s break down the scenarios: 1. Bullish Scenario (Green Path) If price respects the demand zone at 3,293, we could see a solid bounce to the upside. The first target would be the supply zone around 3,360.633. Buyers entering at this demand zone may look for a short-term rally. This setup is attractive for swing entries with a good risk-to-reward ratio. 2. Bearish Scenario (Red Path) If the demand zone at 3,293 fails to hold, it signals that buyers are not strong enough. Price could continue lower toward the Fibonacci extension 1.618 around 3,280, and potentially down to the next demand at 3,217.192 near the 2.618 level. This would show a “risk-off” sentiment with sellers taking control. The likelihood of a continuation move lower increases if demand breaks. 3. Key Takeaway The main focus is the reaction at the 3,293 demand zone. A buy setup is only valid if we see price action confirmation (e.g., bullish engulfing or rejection candles). Without signs of strength from buyers, the safer play is to wait for a breakdown of demand and follow the move lower toward 3,217. Conclusion Gold is currently at a crossroads. Buyers still have a chance to push price higher into the supply zone, but if the demand breaks, sellers will likely drive price deeper. In short: don’t predict, just react wait for how the market reacts at the demand zone, then execute with discipline and proper risk management.
Technical Analysis – XAUUSD (Elliott Wave + Demand Zone Outlook)

Elliott Wave StructureAn impulsive 5-wave structure has been identified (1-2-3-4-5 upward),followed by a corrective A-B-C pattern forming a falling wedge/channel, which has now broken to the upside.Breakout & Potential MovementThe breakout from the descending trendline signals a potential bullish reversal.Currently, price is in a retest phase, likely seeking a pullback before continuation.Demand Zones OverviewMinor Demand ZoneUpper: 3305 – 3314Lower: 3290 – 3294→ Acts as a short-term pullback area. If price holds here, continuation is likely without needing to revisit deeper zones.Major Demand ZoneUpper: 3208 – 3217Lower: 3185 – 3192→ Considered a stronger support area. If the minor zone fails, buyers may step in significantly from here.Trading ScenariosBullish Scenario (Preferred)Price retests minor demandBullish rejection forms → Buy entryTarget: Retest previous highs (~3500) or start of a new impulsive waveBearish Scenario (Alternative)Price breaks below minor demand → Continues toward major demandSafer buy setup if bullish candle or divergence confirms at major zone
XAUUSD Price Outlook – Correction Risk & Demand Zone Watch

Gold (XAUUSD) is currently hovering near the 3,300 level, facing potential resistance from a previously tested supply zone. Price is consolidating in a low-volatility range, suggesting a possible pullback scenario. Should a correction occur, the nearest downside target lies around the Minor Demand zone (3,222–3,204).A deeper correction could extend to the Daily Demand area at 3,105 and possibly down to 3,030–2,970, which historically provided strong bullish reaction. As long as price stays above these zones, the overall bullish structure remains intact.Keep an eye on the supply rejection and signs of BOS (Break of Structure) for any potential reversal confirmation.
Disclaimer
Any content and materials included in Sahmeto's website and official communication channels are a compilation of personal opinions and analyses and are not binding. They do not constitute any recommendation for buying, selling, entering or exiting the stock market and cryptocurrency market. Also, all news and analyses included in the website and channels are merely republished information from official and unofficial domestic and foreign sources, and it is obvious that users of the said content are responsible for following up and ensuring the authenticity and accuracy of the materials. Therefore, while disclaiming responsibility, it is declared that the responsibility for any decision-making, action, and potential profit and loss in the capital market and cryptocurrency market lies with the trader.