Technical analysis by RakyatTrader about Symbol PAXG: Buy recommendation (10/31/2025)

تحلیل تکنیکال طلا: از منطقه واکنش تا صعود بزرگ (اهداف 4117 و 4259)
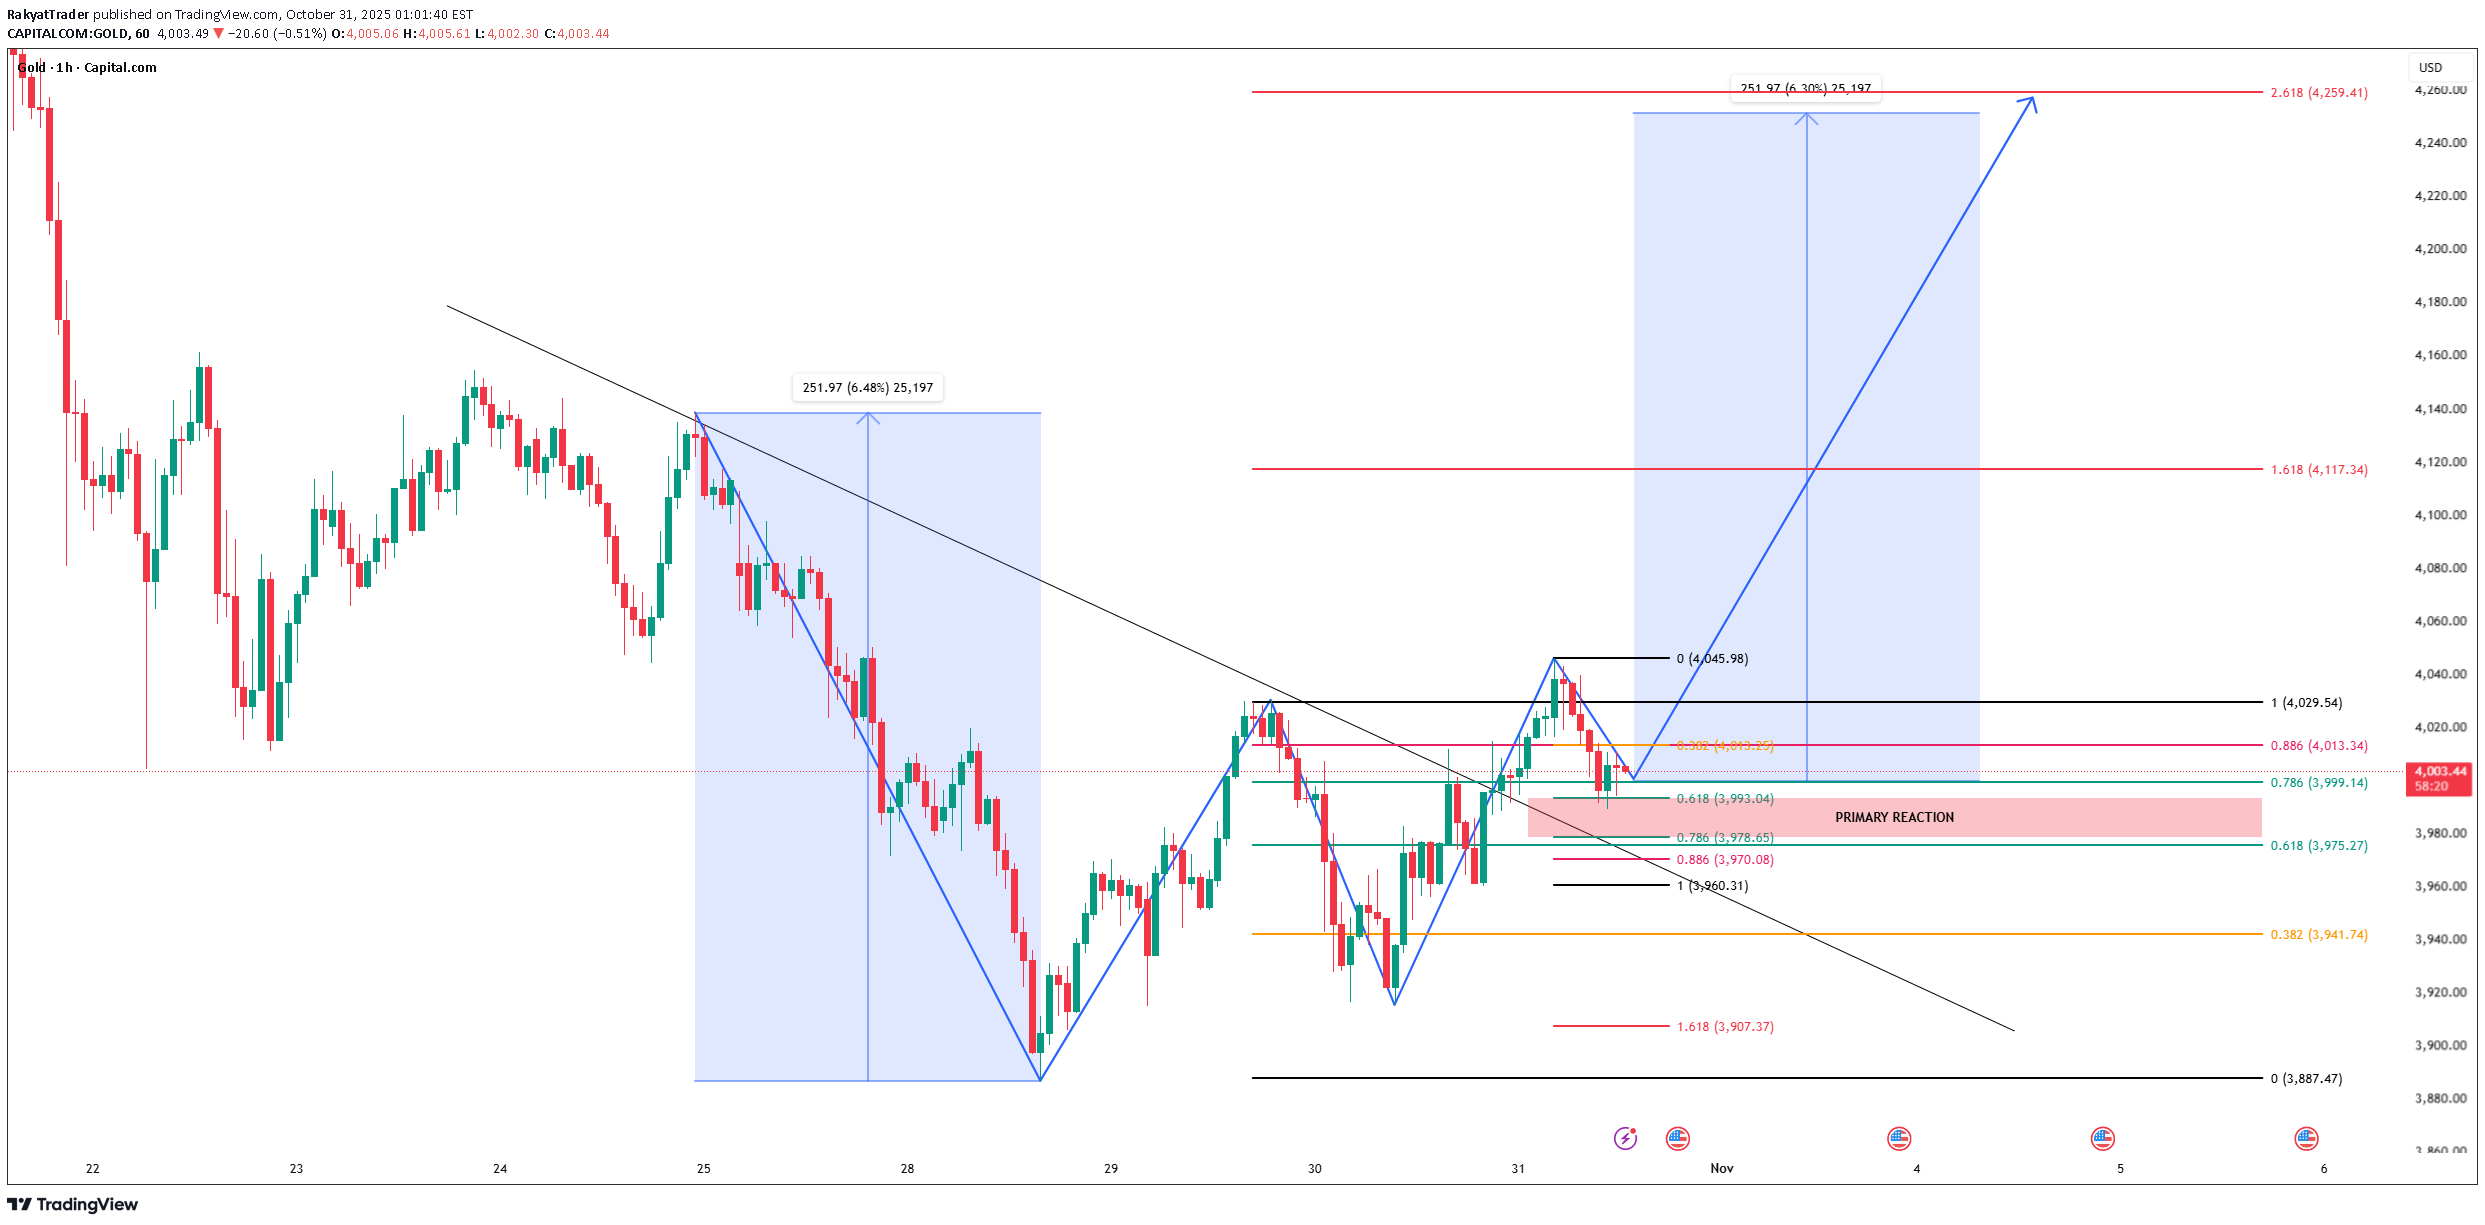
Structure and Trendline Break Gold on the H1 timeframe shows a clear breakout from the descending trendline, signaling a structural shift from bearish to potential bullish continuation. The breakout is supported by the formation of a higher low, suggesting growing buying pressure. ABC Pattern and Key Retracement Zone After the first bullish impulse from 3887 to 4045, price is now in a corrective phase (wave B), pulling back into the Fibonacci retracement zone: 0.618 (3993) to 0.786 (3978) marks the PRIMARY REACTION ZONE, where buyers are likely to step back in. A strong bullish reaction from this zone would confirm the start of wave C. Fibonacci Extension Targets If the bullish continuation (wave C) unfolds as projected: 1.618 extension at 4117 → short-term bullish target. 2.618 extension at 4259 → main bullish projection, mirroring the prior impulsive move. As long as price holds above the 3950–3980 support range, the bullish structure remains intact. Trading Bias & Summary Bias: Bullish (while above 3980) Ideal Entry: Buy limit around 3980–3995 (Primary Reaction Zone) Invalidation: Break below 3950 (signals potential deeper correction) Targets: 4117 and 4259