
RSI_Trading_Concepts
@t_RSI_Trading_Concepts

What symbols does the trader recommend buying?
Purchase History
پیام های تریدر
Filter
RSI_Trading_Concepts
اصلاح هفتگی اتریوم: فرصت خرید بلندمدت پس از عقبنشینی بزرگ!
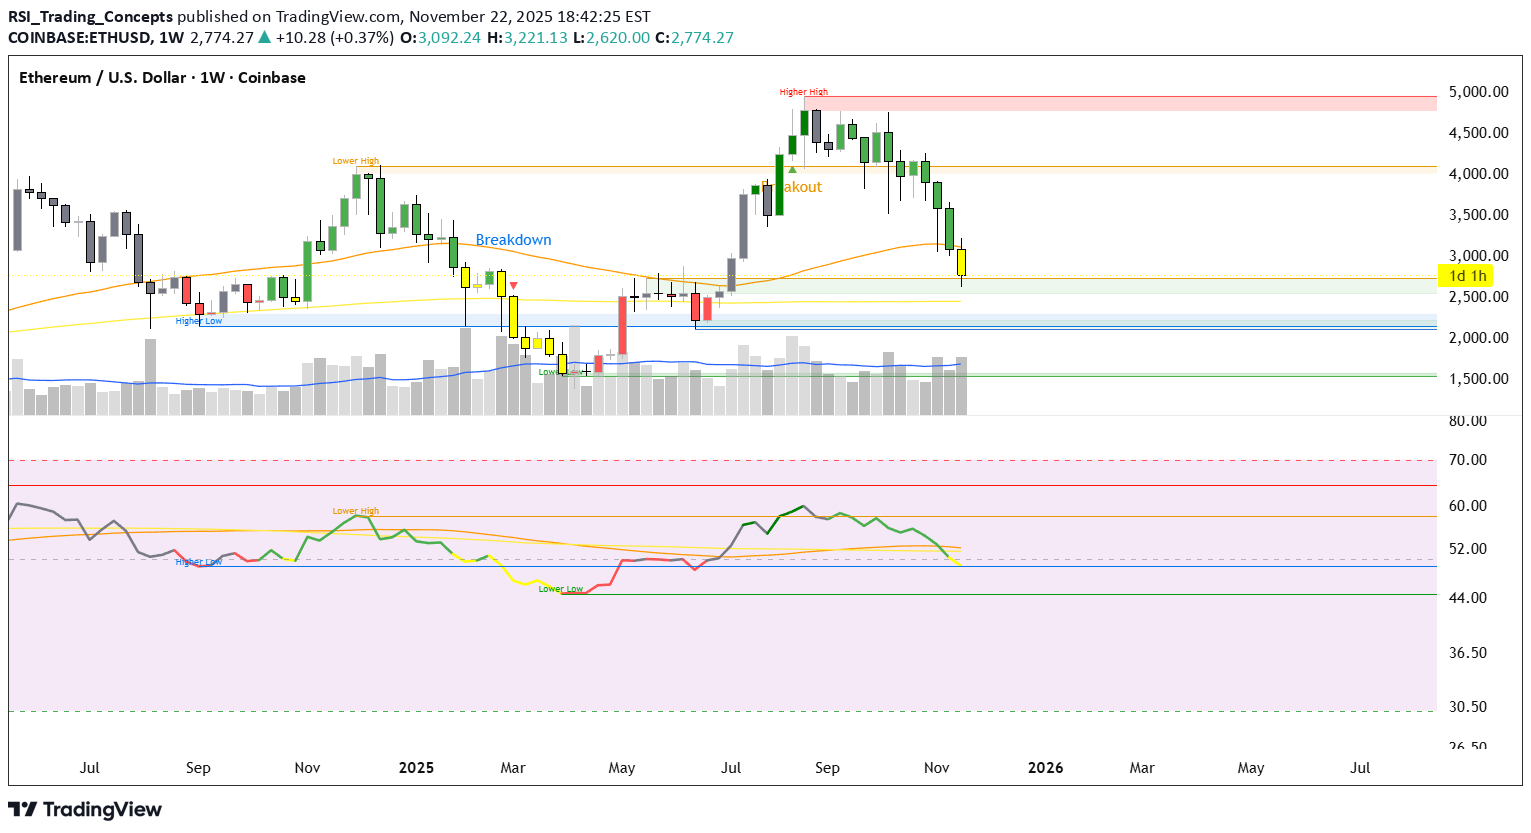
https://www.tradingview.com/x/uzFDV1O7/ Great weekly pullback for ETHUSD. Long-term buy here with the market structure bill coming next month.
RSI_Trading_Concepts
H&S on $ALGO
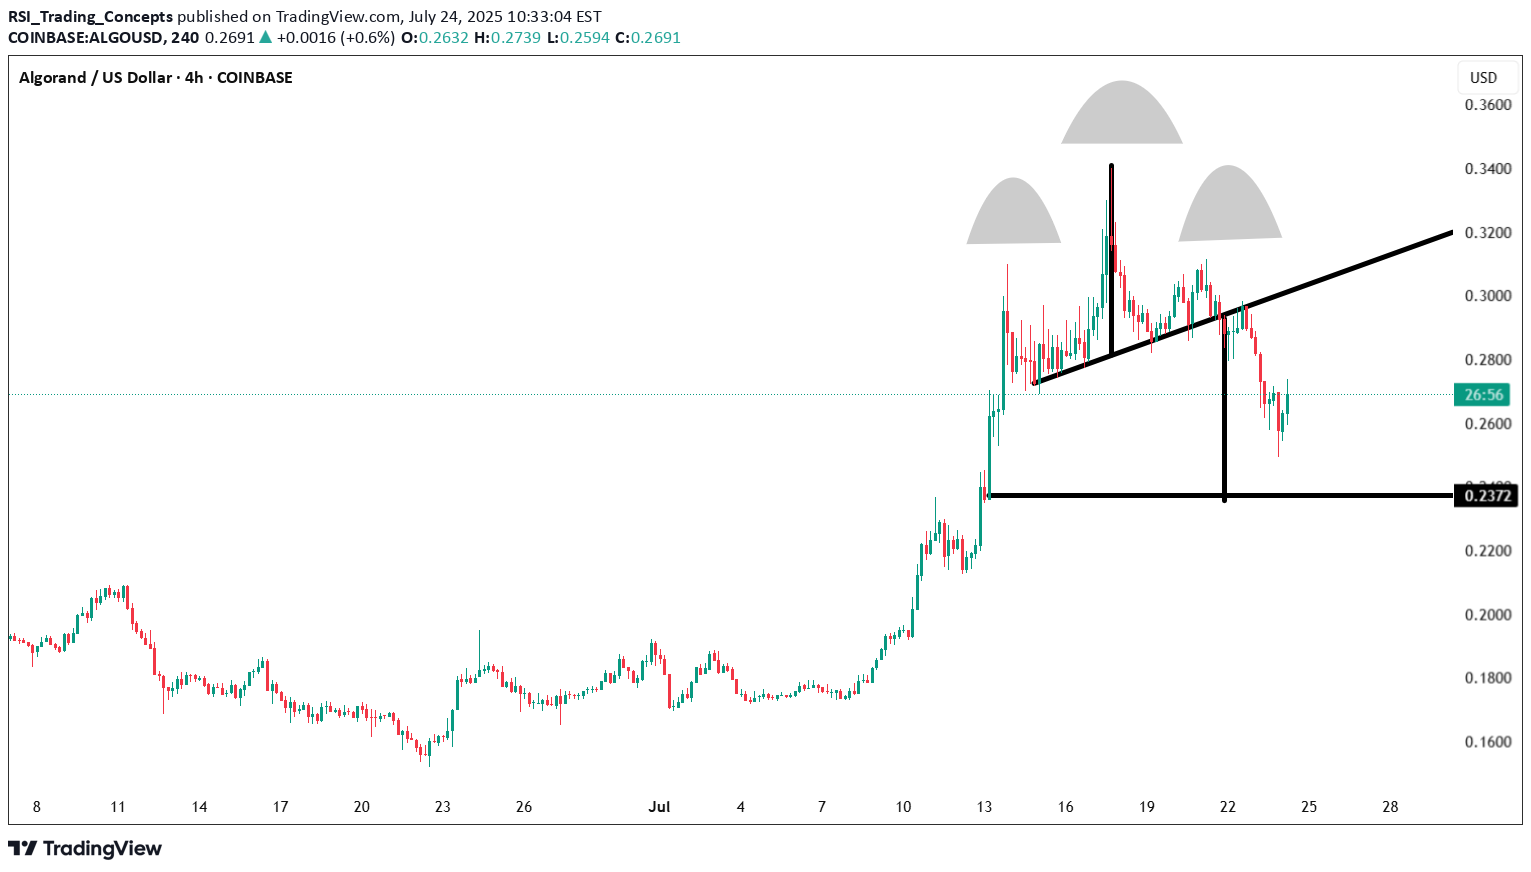
https://www.tradingview.com/x/XDxKmMRu/ H&S almost reached the target move. If you missed an entry on ALGO , this might be a good entry buy. Head and Shoulders
RSI_Trading_Concepts
BTC Cup & Handle
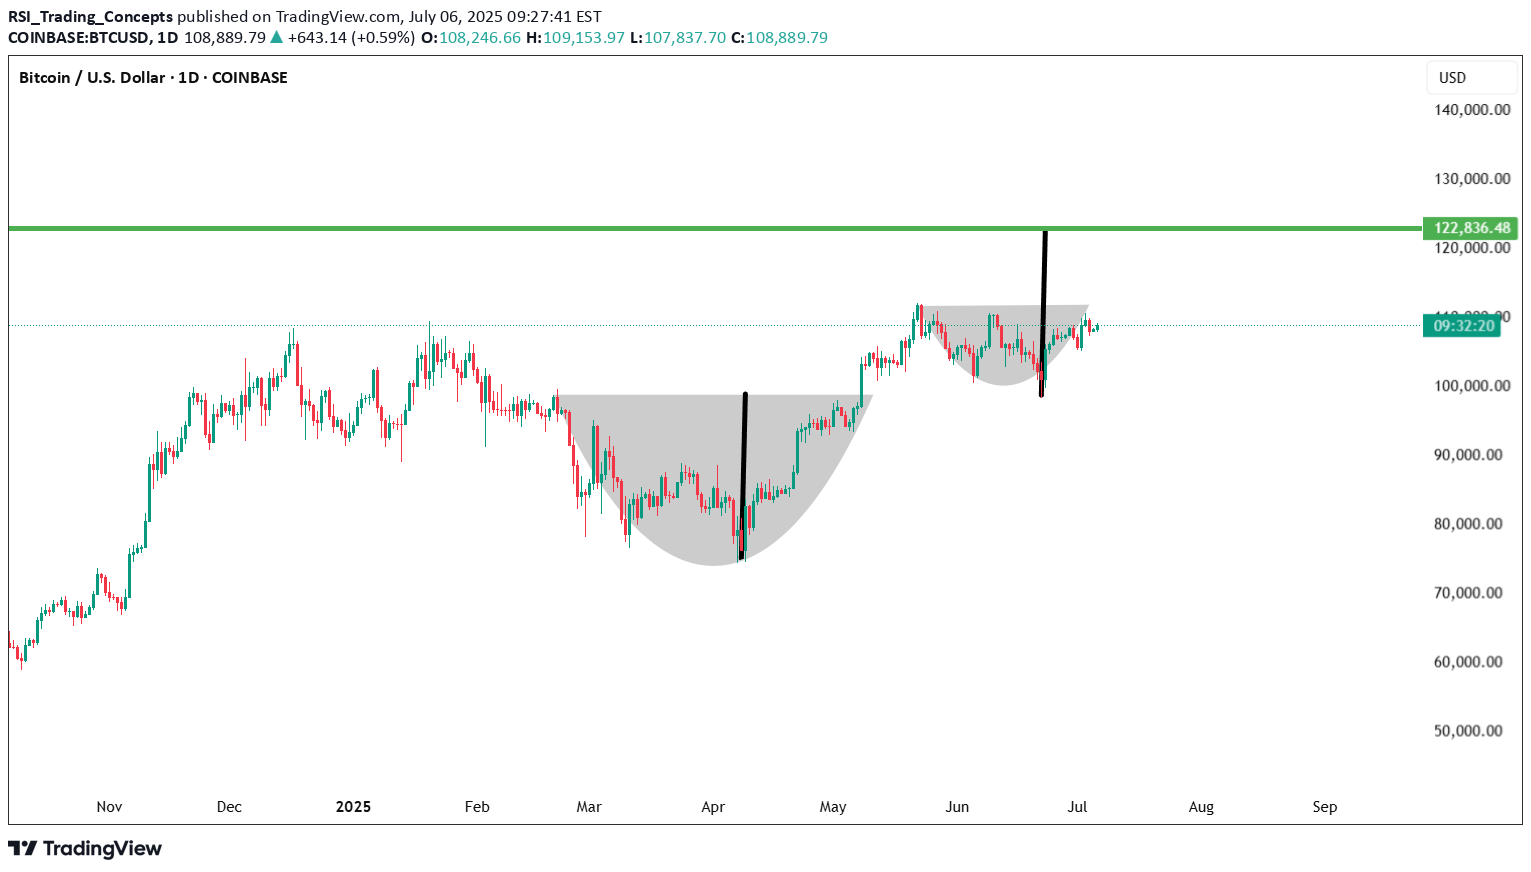
https://www.tradingview.com/x/28InsNSQ/ Cup and Handle measured move $123Kish.
RSI_Trading_Concepts

RSI_Trading_Concepts
Aptos H&S in the making

RSI_Trading_Concepts
BTC weekly zones

🚀 Bullish Breakthrough for Bitcoin on Weekly Time Frame! 🚀 Just in from RSI_Trading_Concepts on TradingView - the Bitcoin weekly chart is a beacon of bullish sentiment! 📈 The analysis highlights how the #BTC bulls are not just defending but thriving at the Overbought (OB) zone low on the weekly time frame, showcasing their strength and determination. 💪 🔹 Key Insights: Following a significant breakout in late 2023, Bitcoin has been on a steady upward trajectory. The bulls have impressively defended the OB Low at $53,841 on the weekly chart, indicating strong support within this zone. This defense of the OB Low, especially in an overbought RSI context, suggests that the market sentiment remains overwhelmingly positive, with momentum favoring further gains. 🔹 What This Tells Us: This isn't just a defense; it's a statement from the Bulls. Holding strong at this critical level, particularly after RSI has indicated overbought conditions, is a powerful sign that the current trend might continue. The market is showing us that despite being in overbought territory, the appetite for Bitcoin is still voracious. Don't overlook this signal! The resilience at this key level on the weekly chart could propel Bitcoin to new heights. Keep your eyes on this zone and prepare for what might be an exhilarating journey upwards. 🚀💹 #Bitcoin #Bullish #Crypto #RSI #TradingView
RSI_Trading_Concepts
Algorand going back to .13-.15 range

Measured move to .13-15 range.
RSI_Trading_Concepts
Ethereum pending breakout

https://www.tradingview.com/x/iIQFI6oK/ All eyes are on Ethereum for a potential breakout. Forming a base in the green zone indicates a bullish divergence. As long as those low remains, stay on ETH for a long. Awaiting a close above the descending trend line and a close above the local lower high marked with a black line on the chart and RSI.
RSI_Trading_Concepts
SUIUSD Local Bottom

A RSI bullish divergence is forming for SUIUSD near support, indicating a potential upward movement in the cryptocurrency market, including Bitcoin.
RSI_Trading_Concepts
Polkadot Accumulation Zone

The concept of an "accumulation zone" in cryptocurrency, like with Polkadot (DOT), refers to a price range where a significant amount of buying is occurring, often by long-term investors or "whales" who believe the asset is undervalued or poised for an upward price movement. Here's how it relates to Polkadot based on available information: Seems DOT is holding up in the accumulation zone with a bullish RSI getting ready for a move in the coming week. The Green Zon is the RSI Low using an RSI 7-period respecting the low zone Accumulation might be occurring here. Most Crypto assets have similar zones happening. Just looking at the bar patterns it's hard to see but with the RSI indicator, it looks positive to me.
Disclaimer
Any content and materials included in Sahmeto's website and official communication channels are a compilation of personal opinions and analyses and are not binding. They do not constitute any recommendation for buying, selling, entering or exiting the stock market and cryptocurrency market. Also, all news and analyses included in the website and channels are merely republished information from official and unofficial domestic and foreign sources, and it is obvious that users of the said content are responsible for following up and ensuring the authenticity and accuracy of the materials. Therefore, while disclaiming responsibility, it is declared that the responsibility for any decision-making, action, and potential profit and loss in the capital market and cryptocurrency market lies with the trader.