
Quartz-
@t_Quartz-

What symbols does the trader recommend buying?
Purchase History
پیام های تریدر
Filter
پیشبینی انفجاری بازار در جمعه: آیا بیتکوین رکورد تاریخی را میشکند؟
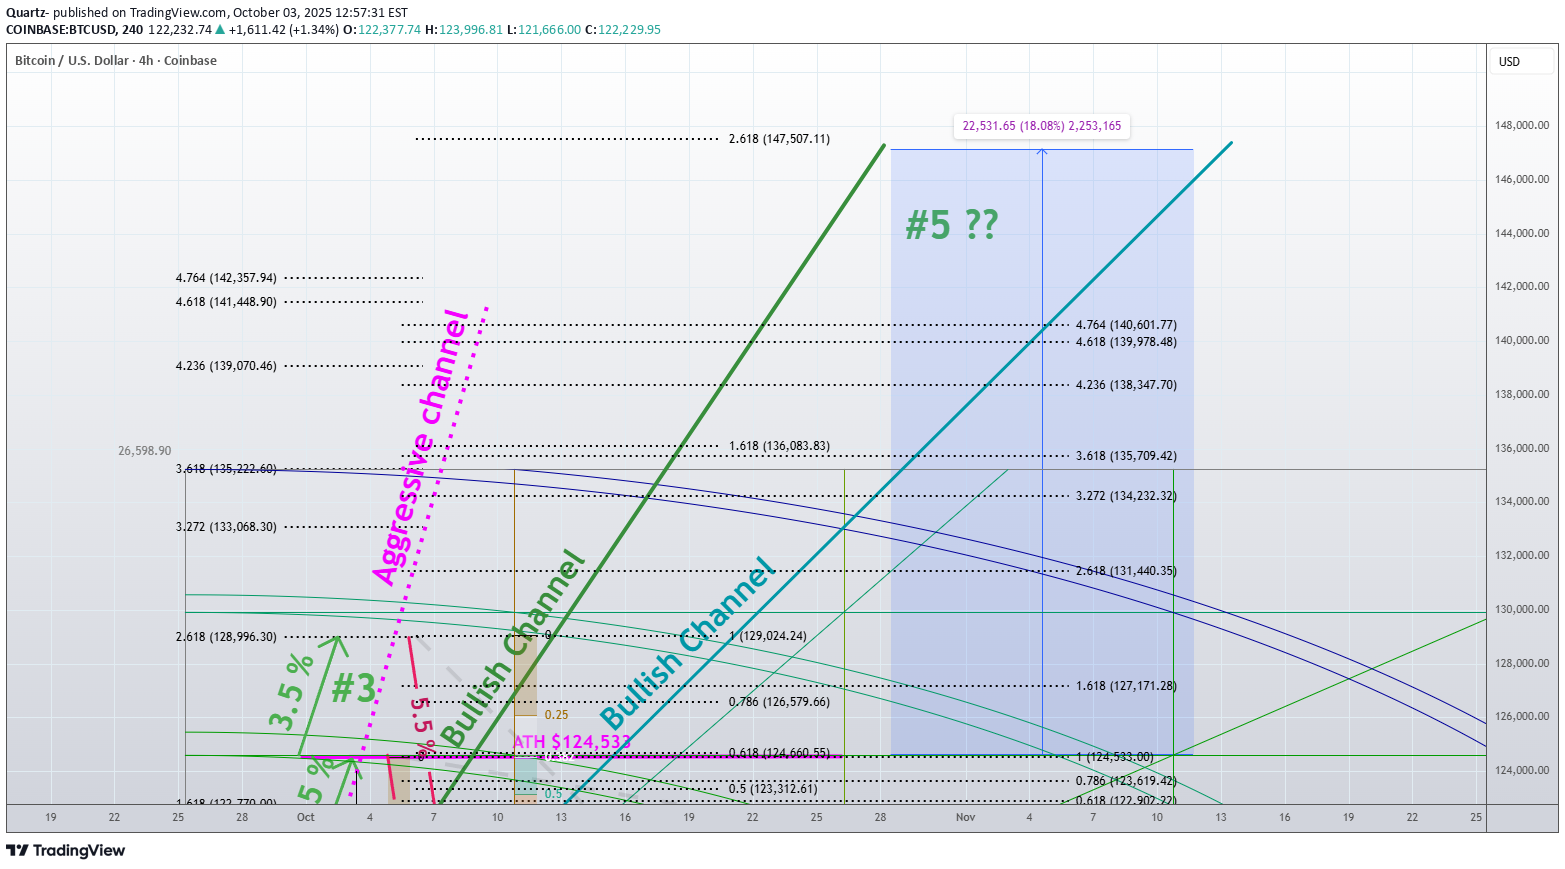
It's Friday. It's been pumping PA. While I was making this chart this morning's PA was moving with very healthy volatility. Bulla's are pushing for the ATH. At the same time, if my 12345 leg is correct.. we are waiting for the finalized #3. Oddly with the ATH at the #3 level... we have no clue what PA will do around the area. We could have a normal healthy drop to #4 or a very very shallow drop to #4 .... and then ... not realize PA is already on it's way to #5. With the weekend almost here, we might see the ATH crushed for a Friday's close, with lots of activity. I will add that, weekends are usually dead, I don't except anything other than, low volatility with PA looking to correct into the #4 low position. That's my bias for now... if PA doesn't follow this, then my bias will change. Lastly with this Chart, I used the GannBox again and have some notable FIB targets for #5 (130K - 165K) and timeline is end of Pumptober into November. There are two future fib target lines graphs. One is extreme the other is minimal, and thus there is the posted forecasted regions. Until the 3-4 settles, it's still a guess, might as well take a look. Good LuckPosting my original idea, which was built on another chart layout before I made this clean one. - I thought it was note worthy, to conclude that the temptation to go SHORT at the PINK fib 1.272 level @ $120,600 was looking like a great short setup. {The Top top} .. however it wasn't, at the time it was looking short bias. I actually almost took the short. The downside move was +1.3% so capturing o.75% might have been challenging before quick diminishing profits started creeping in.updated this zoomed in 4-hour snapshot Point is... What will weekend price post first? Will PA creep into #4 leg area, or aggressively post a different High for leg #3?Well...PA has bypassed the recent H by 1.4% and the ATH by o.98% Move the retrace graph and watch for the set-up. This next setup is for a long into Leg #5 ... of course ... we are all looking for where the turn is... Loose math is this retrace theory. retrace leg 4 has a range that ~90% of the time turns in this area. This time the range is 5.2% stretched out between 122,444 & 115,973. everyone has their risk level and confirmation levels .. Good Luck This update is my Now Bias and expectations.I am short.. first trade of this posted chart... it does say LONG however, this is the initial plan to get a little buffer money for the LONG entry later on. Found a few entries as I scaled in. Yes very near the top of that particular pulse-wave set. It's been slow watching the PA turn and scaling in, 4 hours now. Good Luck ... Not enough room to set a (profit stop as a stop loss also) and walk away yet, so here I sit. the wanna be profit target 5.25% is obtainable, not guaranteed, so somewhere down there, as I watch indicators I would fix on exiting and finding the LONG afterwards.
BTC 4-Hour Long Target 115,500

Hello fellow Traders.I am long, only posting my target area.This Chart is very clean.I came to the target conclusion area, with some Math, and I have used a Gann Square to monitor a time frame to reach the target area.Yes, your reading it correctly, seems like it can happen as early as this Friday, and as late as July 22.PA doesn't necessarily have to stay in the positive area of this Gann Square, and has all the right to swing back up inside positive, to finish it's goal.The Plan:The probability to reach the target within the time frame will fade slowly out, far past the Gann Square.Yes, I am actually guessing where the nearest chance to reach this price level is going to happen "if it will happen" within the green target area, so I may close out my long trade somewhere along the way up. Afterwards scalp the box up and down till it hits the Target Area.Except price to have an extremely high chance to bounce down from the Target Area, when it hits.Good Luck !!Lots of pressure is building for the downside, however the strength that the indicators are holding onto currently, has been yielding a steady march upwards. The Bears are failing to take over.It's very touchy as BTC dominance has an edge currently and is causing extra BTC pumping and most of the alt market coins are slowly loosing ground. The market is all BTC for the near term. In general... alts directly tied to BTC, will not see the extreme % numbers to the downside, if compared to the other alts that are tied to ETH.
BTC Daily - Diamond or Deep Pullback ?

Someone in chat suggested this was a Diamond pattern. More specifically Diamond patterns tend to be Top or Bottom "Stoppers" ... meaning this is where the big turn in the opposite direction happens. Could drop as much as the 1.618 line, in the high 70's.However I think it is just a deep pullback, and some sideways movement, and PA will slowly make it's way to a new high.Over all I think it is a Long for the trade.I had difficulty placing a diamond pattern around the whole thing, and some technical problems with exactly meeting the diamond pattern requirements.Well as time passes we will all find out.Good Luck trading!!

Forget the past and move on to another Fresh Look.Because of the Higher TF's (like the 3-Day) and especially the Daily, urgent for a reset within their indicator levels. We find PA reacting to this as a massive downtrend. PA has to do this, and as a result, traders can confidently enter into new LONG positions. I have identified TWO trading channels that are merged together because of this large move.How to trade now? Here is a visual note I have added for us. Identifying a solid Daily Trend position can help immensely with decisions on placing an order. This can help us expect certain trading results. With or Against the Daily Trend you have identified, can help with a limited movement towards the Middle Trend Line for a bounce and/or a Larger movement away from the Middle Trend Line. Good Luck !!This is only a piece of the puzzle, a piece that can help us with a piece of mind while trading.Smoothed Moving Average ... simple indicator in Trading View's Library.

Long term BTC is still in a overall Bullish trend.PA gets to a point where absorption of higher prices becomes exhausted, and a waiting period then begins before the next upward pulses.Channel Lines, Wedge Lines, Graphics and anything else on any chart are just temporary Historic lines and will become broke at some point in time.We see the Goal of "143k - 175K".When this will happen....Nobody knows~~~however I guessed about May -Sept of this year 2024. Heck it could happen in March?? Who knows what ""Trump (Dump or Pump)"" world event is going to happen in the future. We might see 70k prices again. Looking at PA bump it's head against the Top Channel line several times, I feel that to obtain those prices most everyone is expecting, PA "will need to" eventually break-out of the upper blue channeling line.I placed some Time Frame PA action bracketing graphics in order to somewhat "Guess When" this breakout and new higher high PA might happen.Use SL's and watch-out for the downside (Trump-Tariffs).Good Luck !!

Here we all are stuck in the range.I usually call this the "Chop Chop Zone"Possible for a long position at the bottom.Channel trading will produce the unknown.Meaning.. long fast wicking and reversal ..and.. eventually a breakout (up or down). The breakout is subjected to the traders interpretation of the trend or maxing out of the trend. It is either a continuation of the trend or a reversal of the trend. So channeling can break-out in either direction. The trending lines I have is an "M" and suggests PA will breakdown and out, towards the Green Lower Oval graphic. However if PA continues more bouncing in the channel, we could see a continuation to the upside and 111k might be in our future soon.Good Luck !!

I am Long currently, waiting for PA to go the direction I want. BULLISH.I made this 1-hour incase I start erasing the chart and start a new layout for PA.I am sharing this disaster chart, for our insights and also a record for myself of what I historically was thinking.I have a sneaky feeling, PA is looking for a reason to dip yet one more time.However eventually price moves out of any designed graphic, pattern, channel, triangle, up or down trends.The point is finding something to help trade with.Currently PA is still in a downtrend pattern.Here is a screen shot of a larger span of what I have evolved this chart into.I have thrown in a Violet colored Bearish Channel...(expecting it to break-out on the top-side to complete the #3 Leg)...it is possible. However PA will most likely break-down and out posting Lower Lows. Yet another scenario is... That super-sized Yellow Channel is actually a Bull Flag!! and a break-out will eventually occur to the upside. It could be soon or later in a week or so.Indicators:The 3-day sure is suggesting further downside, as that TF hasn't hinted on the turn upwards, however it is close to showing a possible turn. This turn depends on the strength of the Daily's PA. The Daily is weak, and this area is where it can do another dip or two, or just finally start moving upwards with authority.The 9-hour is set for the upside.The 4-hour is resetting.The 1-hour is resetting currently for a bounce off the channel bottom where that green oval is set-up.I got out of this with 4.97% profit. I actually had a stop order for this trade. I picked up some bags at o.707 The drop was massive. Possible one more drop.

I had an order waiting. Another one further down also.I need to reanalyze all this.See what happens. Under 1 dollar for FET is a good value I believe.If it dips, then I have an adjusted cost average entry.Volatility is very high with FET.. Just look at the last time I sold some bags... its 65% higher than now.There's nothing wrong with buying on the way down, if what seems like like the bottom is nearing a turning point.

Beginning a new trade. I had the order sitting and waiting. I was sleeping when it took hodl.Cleaned up the chart from the previous trade.I am expecting another bearish pennant to form.I am hopium that it goes 1-2-3-4-5 format.I am hopium that PA continues upwards and cancels out the possibility of a bearish pennant.I am hopium that PA breaks resistance levels and finds footing on support levels.I did draw out a possible bearish looking pennant, however I will post later screen pictures of the formation of channeling or pennants, etc. as those will eventually materialize visually. PA can/could/might continue lower. I will post the visual now, as the risk factor. o.81 - o.76 - o.69 are those levels where PA could go.its on a 9-hour chart to condense the informationThe Blue Fib is from last previous historic action for support and resistance levels.The idea to watch the 1-2-3-4-5, this is boiler plate distances between the numbers. We want this Elliot Impulse Wave ascending formation, NOT the bearish pennant formation. Something else to watch the PA going in a favorable direction.

Sold the bags here.Moving on for the next entry.PA has already moved down considerably.5.600 % lower than where I sold.I keep watching the price scooting downwards as I write this Publish Idea.I do initially think the PA will eventually move down to the region where the lower green arch is placed.The first arch is an area where a bounce is probable.Nothing is guarantee, and this chart is where my thoughts are about near term future movements.I need to restrain from entering too early.Patience.I have orders waiting. PA and indicators seem to be telling a story that lower PA is very likely.Geez... This market is at one-of-those-places where the "Daily & 4-Hour" looks like it can take off. However the 3-day is a strong trend setter, suggesting that it's play is going to continue a downward trend. I seem to be thinking there's a play upwards now or in the next few days, before that 3-Day kicks back in downwards. Currently I am so ready to play a long right now. I think there's a good chance for a scalp play now. ...okay I am in the weekend Saturday Trade... See if this works out. 5000 units.Oh Boy... I start drawing lines around my trade. It's Looking Horrible!! I reanalyzed my entry and I could have done much better. Here's the update. Down 50 bucks plus all the fee's about 30 bucks (in & out). Hmmm?Still in the trade. added more bags as a cost average. Remember I went into this for the 1-hour and 4-hour TF's. I guess it is more of a swing trade then a scalping trade. The first entry was horrible for a scalping trade.Temporary Trade still on board. Outlined a few more positive points to stay in the trade, However I am using the 15-minute TF. Indicator Data: The Daily still looks like it will take off upwards. The 4-Hour still has plenty of room for more uptrending. The 1-Hour is getting close to start pushing against the ceiling @ 100%. (the 1-hour is the going to hopefully bounce off the ceiling more than once)- that will help drive the 4-hour to more indicator maximum highs. Our MA lines are in alignment for the clear uptrend. PA broke-out over the Two Top trend lines I drew earlier. I have clean-up some old stuff and set in new lines. PA is still bouncing off of channel lines and MA lines.Oh geez that DROP was quick, unfortunately for me I made zero dollars. I had my stop at the break even point. However I was at the max up 1.3% which is okay, but was not my goal. Just wasn't the power of the Monday thru Friday traders to keep punching this upwards. looking for another low, or that already marked area.1-hour chart... when and where to buy? Diversions, Fib Lines are good ones. Some do break-outs like I have posted. Break-outs could be treated as a start quanity. As price increases and pulls back, add more on the dips.The Red Confirmation Line was broke. This suggests that a short orders were ordered and activated. This could be a reason the PA fluctuated upwards.Excellent!! I had this order and other orders, on other alts, going active on this last downtrend. A few alts did not make their purchase price point. PA could fall even lower to match the existing low point of o.7606 from the original run chart posted. With that said I do have another order down there to catch a cost average entry. However if PA doesn't fall that much or continues upwards, I have the additional capitol to add in later on small dips as the 1-2-3-4-5 pattern unfolds, if such a pattern does formulate. Or bouncing around on the possible "new bearish pennant" --- which would conclude another dip is possible in the future. However, nobody knows and PA analysis is what it takes to possible figure it out. I will probably clean up this chart I am now posting and I will start an entirely fresh run chart with the new LONG order and will post that link as the final on this published idea.Click on this visual chart, and it takes you to the newest ADA active trade with a cleaned up chart and new objectives.
Disclaimer
Any content and materials included in Sahmeto's website and official communication channels are a compilation of personal opinions and analyses and are not binding. They do not constitute any recommendation for buying, selling, entering or exiting the stock market and cryptocurrency market. Also, all news and analyses included in the website and channels are merely republished information from official and unofficial domestic and foreign sources, and it is obvious that users of the said content are responsible for following up and ensuring the authenticity and accuracy of the materials. Therefore, while disclaiming responsibility, it is declared that the responsibility for any decision-making, action, and potential profit and loss in the capital market and cryptocurrency market lies with the trader.