
QuantAi-Trend
@t_QuantAi-Trend

What symbols does the trader recommend buying?
Purchase History
پیام های تریدر
Filter
QuantAi-Trend
خطر بزرگ برای خریداران: تسلا در آستانه انفجار قیمتی یا سقوط؟
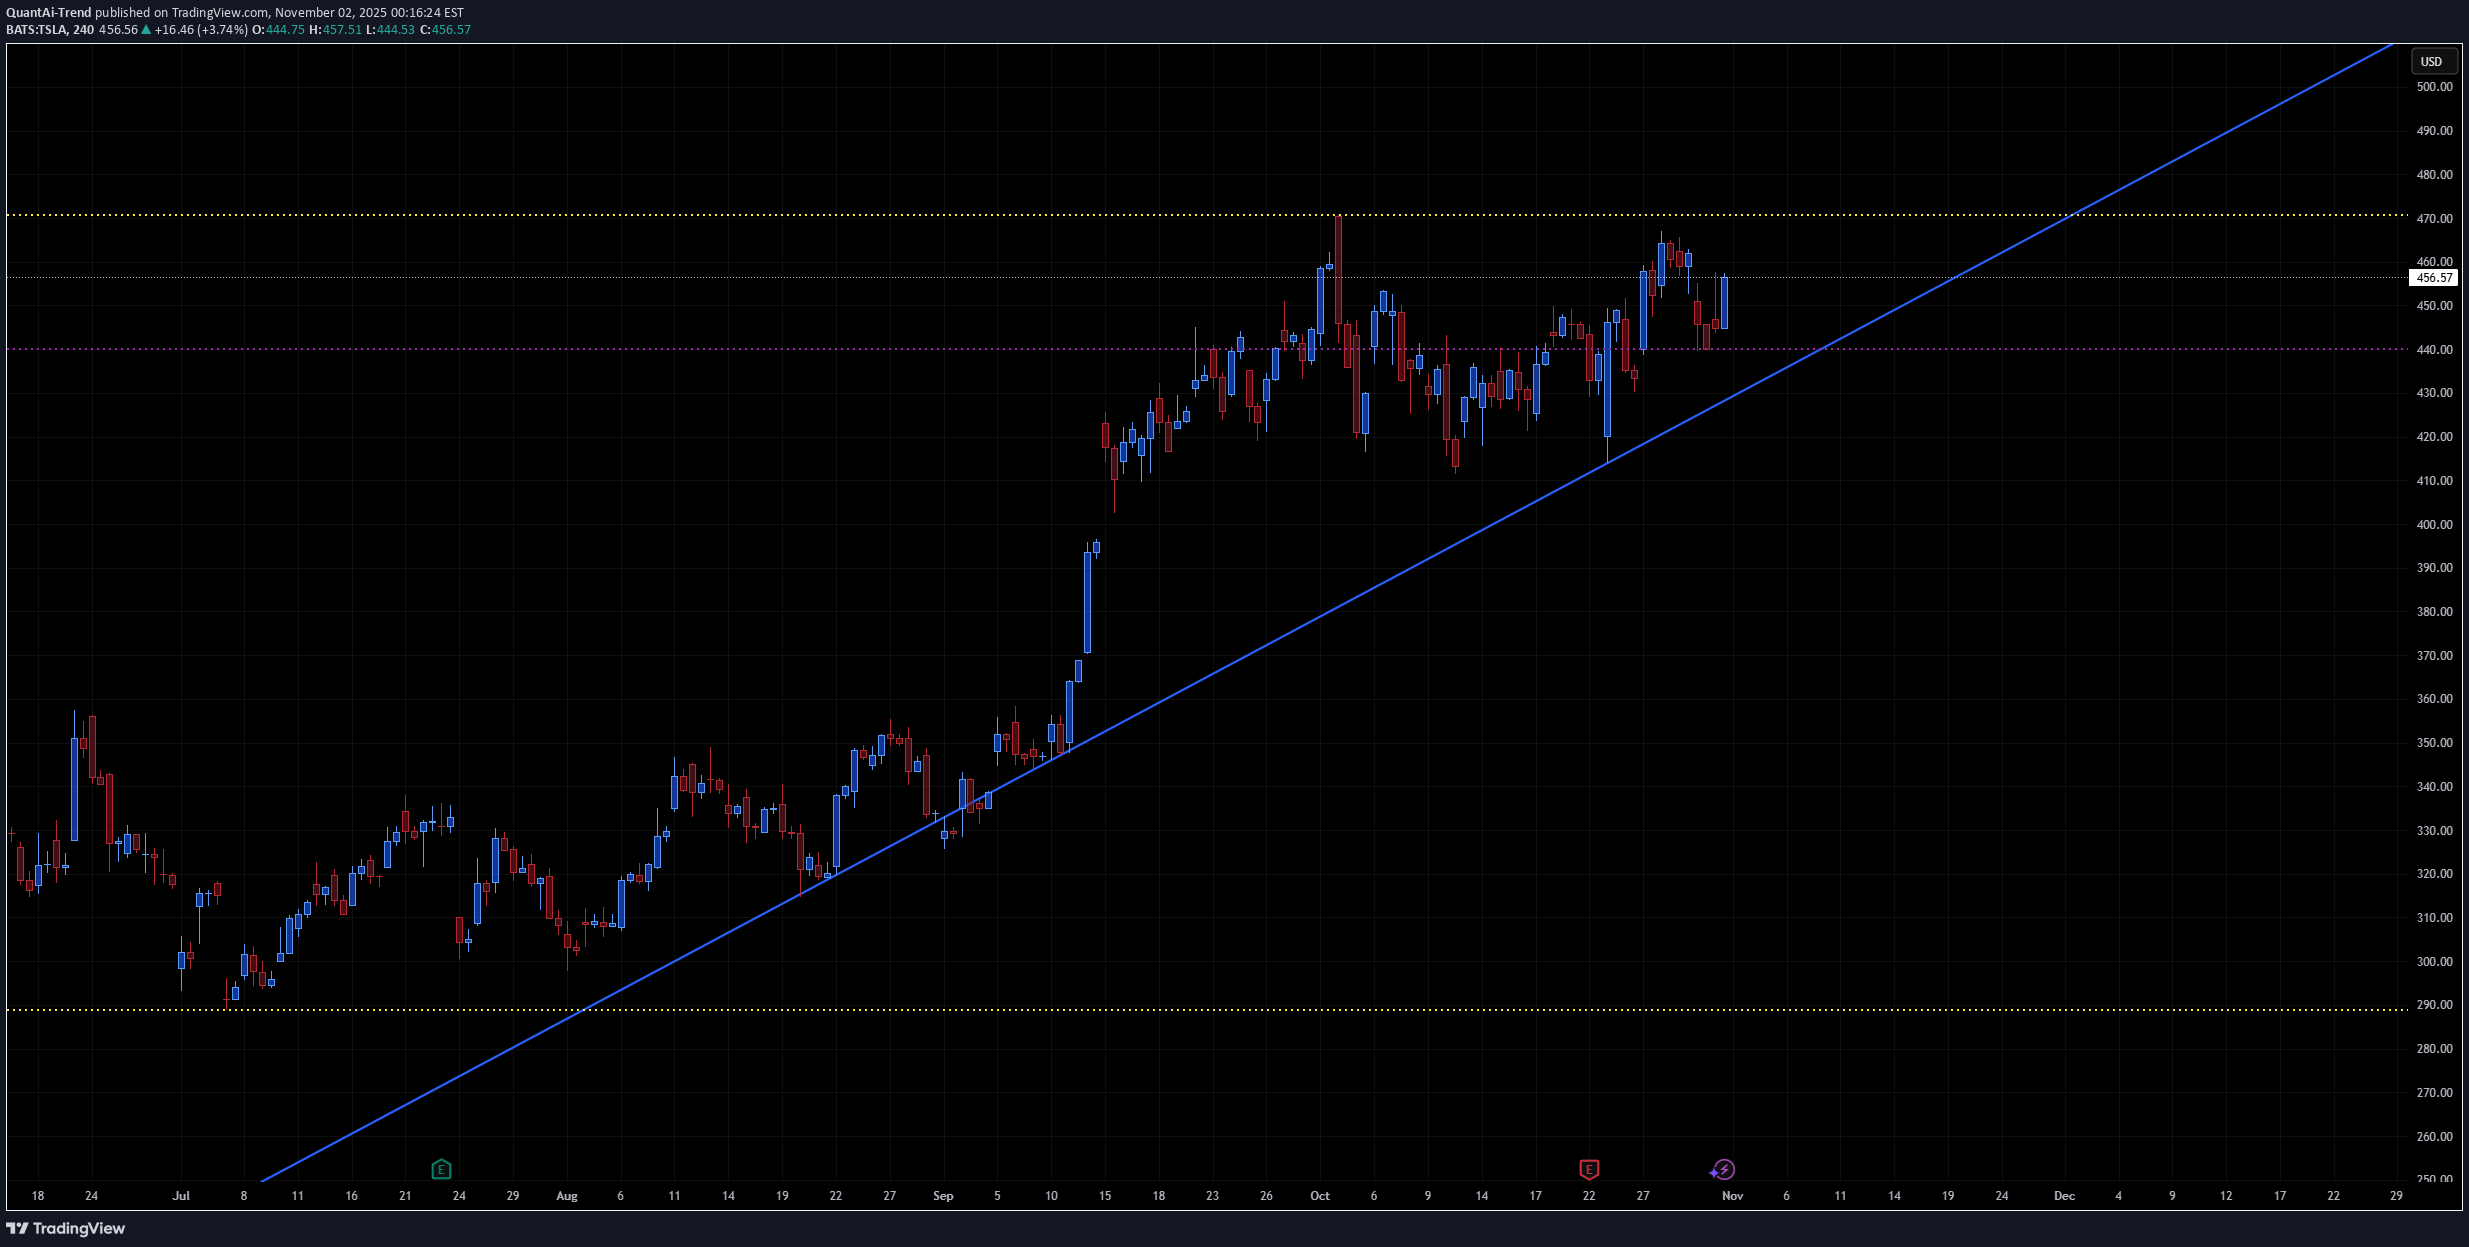
A rising trendline acting as strong dynamic support from the August lows. Resistance zone near $470–475 (yellow line, recent double-top area). Current price at $456, holding above trendline support. Support floor near $290, far below current levels — indicating we’re in a mid-term uptrend phase, not deep correction. This pattern fits a rising channel consolidation near resistance — the next move depends on whether the trendline holds. 📈 Bullish Scenario Setup: TSLA is holding the ascending trendline while consolidating just below resistance — a classic bullish continuation structure. Confirmation Triggers: Break and daily close above $470–475 (clear breakout). Follow-through volume or a strong gap-up session confirming momentum. Short-Term Targets: $490–495 → initial breakout target (projected move from last swing). $510–520 → extended target if buyers sustain momentum. Catalysts: Broader tech strength (QQQ, NASDAQ rally). Positive EV demand data or production updates. Institutional accumulation at the breakout level. Invalidation: Break and close below $445, violating trendline support. Probability: ~60% (uptrend intact, momentum favors bulls). 📉 Bearish Scenario Setup: If TSLA fails to break $470 again and loses the $445 trendline, momentum could unwind toward prior support. Confirmation Triggers: Close below $445 with increased volume. Failed retest near $450–455 forming lower high. Short-Term Targets: $420–425 → first support zone from early October. $390–400 → deeper correction toward base of last breakout. Catalysts: Weak market sentiment or NASDAQ pullback. Negative headlines on delivery numbers or margins. Broader EV sector weakness. Invalidation: Breakout above $475 with strong follow-through. Probability: ~40% (depends on strength of support at $445). ⚖️ Neutral / Sideways If TSLA oscillates between $445–475, expect continued range consolidation along the trendline — typically preceding a directional breakout in 1–2 weeks. 🧩 Summary Table BiasConfirmationTarget ZoneInvalidationNotes BullishClose > $475$490 → $520< $445Continuation of uptrend BearishClose < $445$425 → $400> $475Trendline break NeutralRange $445–475——Coiling near apex 🕒 2–3 Week Projection Bullish path: Hold $450–455 → breakout above $475 → reach $495–500 by mid-Nov. Bearish path: Reject $470 → break below $445 → pull back to $420 by late Nov.
QuantAi-Trend
MSTR در نقطه حساس: آیا جهش میکند یا سقوط ادامه مییابد؟ (تحلیل تکنیکال کلیدی)

A long-term descending trendline (yellow dashed line) acting as dynamic resistance since July highs. Major horizontal support around 265 USD (recent low and yellow dotted line). Resistance levels near 325 USD and 395–400 USD. Overall pattern: extended downtrend with lower highs and lower lows, but price nearing a strong confluence zone (trendline + horizontal support). This setup suggests MSTR is in a make-or-break area — either a short-term reversal bounce or continuation to new lows. 📈 Bullish Scenario Setup: Price has reached oversold levels near 265, aligning with historical support. A technical bounce is possible if Bitcoin stabilizes or rallies, given MSTR’s correlation. Confirmation Triggers: Close above 280–285 USD (short-term confirmation). Break and close above descending trendline (~295–300). Short-Term Targets: 325 USD — former support turned resistance. 395–400 USD — key horizontal level and top of prior range. Bullish Catalysts: Bitcoin recovery or strength toward $70K+. Institutional or ETF-related flows benefiting BTC proxies. Technical short-covering rally. Invalidation: Daily close below 260 USD with strong volume. Probability: Moderate (~40%), as reversal setups often require confirmation after long downtrends. 📉 Bearish Scenario Setup: Price continues to respect descending resistance and fails to reclaim 285–295 zone, maintaining downward momentum. Confirmation Triggers: Breakdown below 265 USD support. Expansion in sell volume below that level. Short-Term Targets: 250–255 USD → minor horizontal level (recent pivot area). 230–235 USD → next structural support. 210–215 USD → measured move from current descending channel. Bearish Catalysts: Bitcoin correction below $65K. Continued macro tightening or risk-off environment. Market rejection of BTC-linked equities. Invalidation: Breakout above 300 USD with sustained buying pressure. Probability: Slightly higher (~60%) as trend remains clearly bearish. ⚖️ Neutral / Accumulation View If MSTR remains range-bound between 265 and 300, this indicates accumulation before next major move. Expect choppy price action with short squeezes and weak rallies until a breakout direction emerges. 🧩 Summary Table BiasConfirmationTarget ZoneInvalidationNotes BullishClose > 300325 → 395<260Trendline breakout BearishClose < 265250 → 230>300Trend continuation NeutralRange 265–300——Sideways accumulation 🕒 2–3 Week Projection Bullish path: Bounce from 265 → breakout above 300 → target 325–330 by mid-November. Bearish path: Fail at 285–295 → breakdown below 265 → slide to 235 by mid/late November.
QuantAi-Trend
نزدک 100 در آستانه انفجار: صعود یا سقوط قریبالوقوع؟
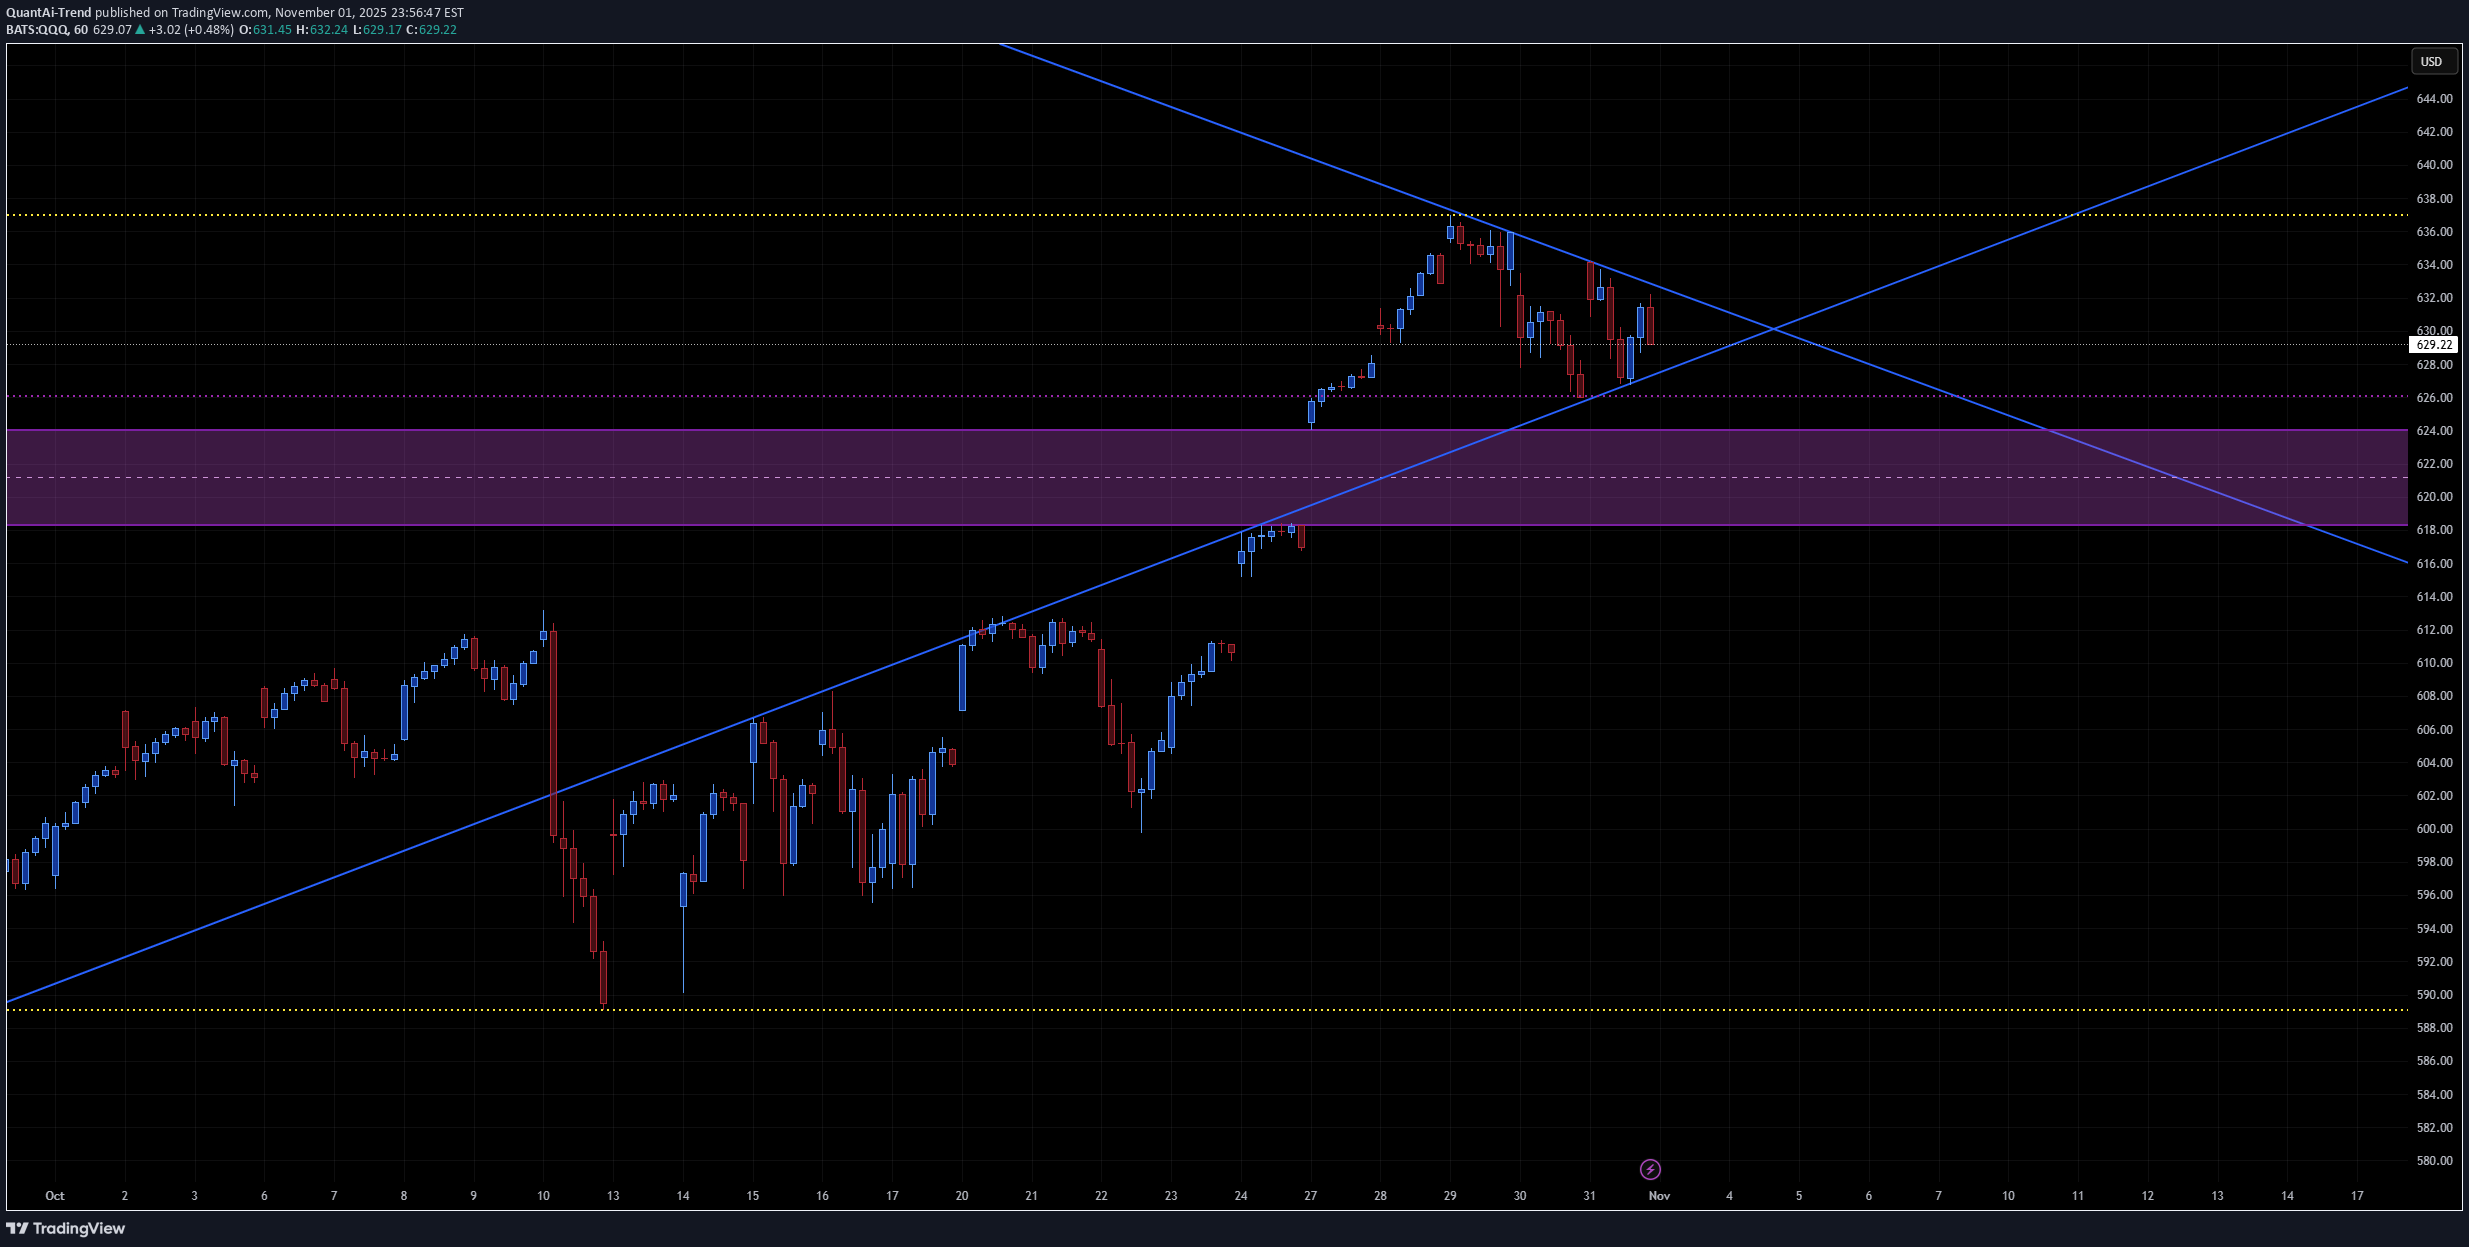
The chart for QQQ (NASDAQ 100 ETF) shows: Converging trendlines forming a symmetrical triangle (lower rising trendline from mid-October and upper descending from recent highs). Primary support zone in 618–626 range (highlighted purple region). Key horizontal resistances near 629–632 and 638–640. This structure signals an upcoming volatility squeeze — likely breakout or breakdown soon (within 1–2 weeks). 📈 Bullish Case Setup: QQQ is currently near 629, just below the descending resistance line. Bulls will want a clean breakout and hold above it. Confirmation Triggers: Break and daily close above 632–634 (above triangle and resistance). Follow-through volume expansion confirming institutional buying. Short-term Targets: 638–642 → First resistance zone (top of recent swing highs). 650–654 → Measured move from the triangle (~+3–4%). 660–664 → Extended move if macro tailwinds continue (NVDA/MSFT strength, yields drop, etc.). Bullish Catalysts: Softer inflation or dovish Fed signals. Tech-led earnings beats. Breadth improvement in NASDAQ components. Invalidation: Rejection from 632 with breakdown under 624 (back into purple zone). 📉 Bearish Case Setup: Rejection from upper triangle boundary near 630–632, followed by a breakdown through rising trendline support. Confirmation Triggers: Break and daily close below 622–620 (support zone and ascending trendline). Weak rebound attempts with lower highs near 626–628. Short-term Targets: 610–614 → Initial drop target (bottom of structure). 595–598 → Major prior demand zone (matches yellow dotted horizontal line). 582–585 → Extended bearish target if broader market correction accelerates. Bearish Catalysts: Sticky inflation, higher yields, or hawkish Fed tone. Tech sector profit-taking. Risk-off sentiment spillover from macro headlines. Invalidation: Sustained breakout above 634–636 with heavy volume. ⚖️ Neutral Scenario Currently, QQQ is consolidating between 620 and 632, forming higher lows but lower highs. Until one side breaks decisively, expect range trading and false breakouts within this triangle. The apex of the triangle sits around Nov 5–7, implying a move should materialize within ~1–2 weeks. 🧩 Summary Table BiasConfirmationShort-Term TargetStop / InvalidationNotes BullishClose > 632–634638 → 650< 624Breakout from triangle BearishClose < 620–622610 → 595> 634Breakdown from wedge NeutralRange 620–632——Coil ahead of breakout 🕒 2–3 Week Projection Bullish Path: Consolidate 626–632 → Breakout mid-next week → Rally to 640–650 by mid-Nov. Bearish Path: Fail at 630 → Breakdown below 620 → Slide toward 600 by mid-Nov.
QuantAi-Trend
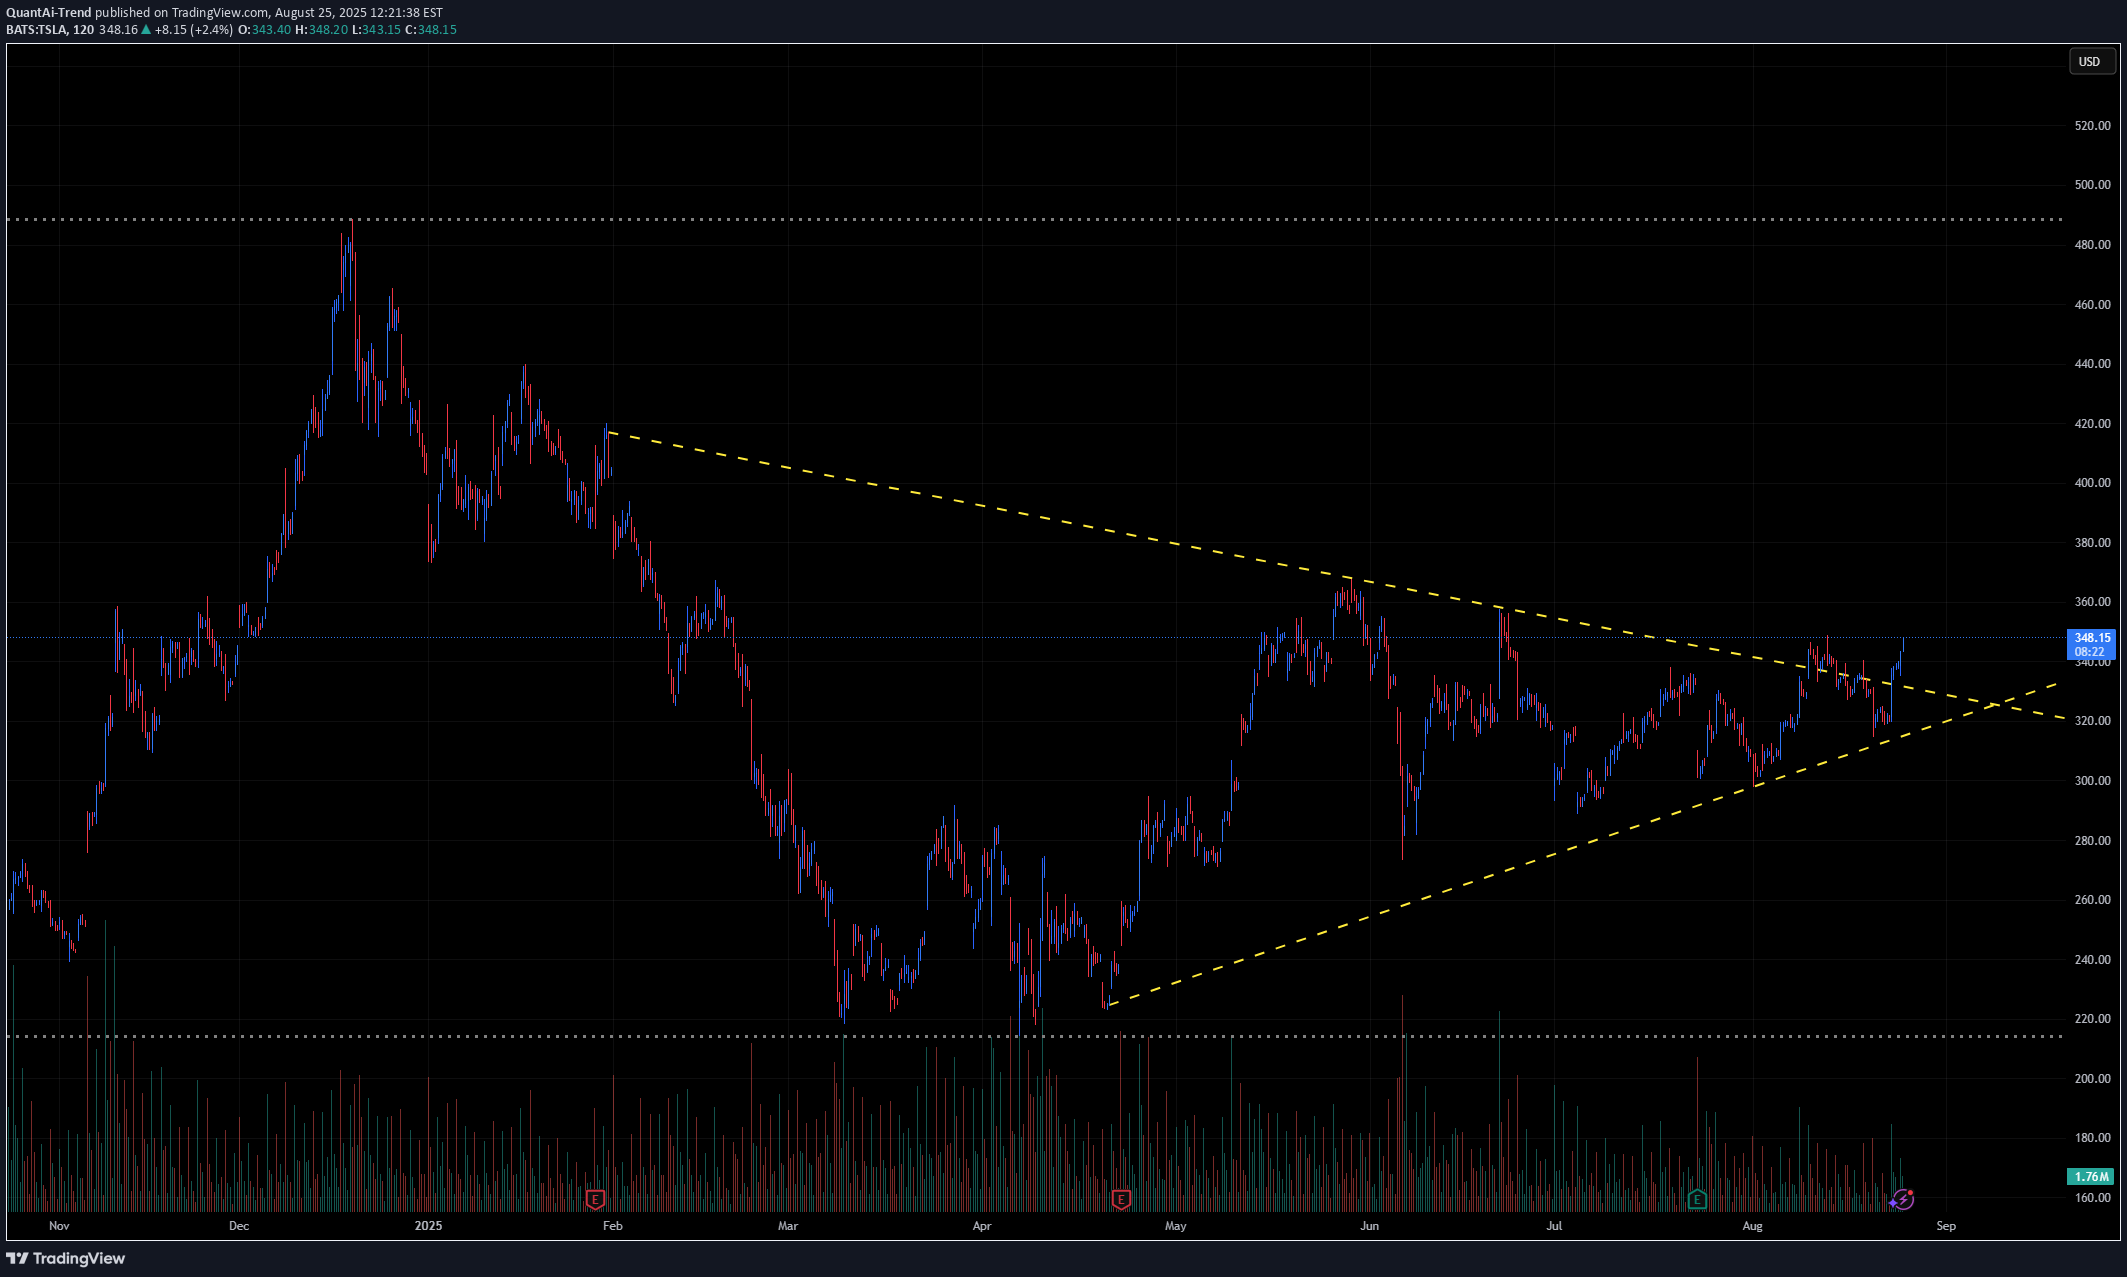
🚗 TSLA Technical Outlook – Symmetrical Triangle Breakout Watch Ticker: TSLA (Tesla, Inc.) Timeframe: 30-minute candles 🔍 Current Setup TSLA has been consolidating for months inside a large symmetrical triangle, marked by: Descending resistance: from ~380 down to ~347. Ascending support: from April lows near ~240, now rising toward ~320. Current price: ~348, testing the upper boundary of the triangle. This structure signals compression after a major downtrend, and the breakout direction will likely define TSLA’s next big move. 📊 Breakout Levels 🚀 Upside (Bullish Scenario) Trigger: Break and close above 350–355. Intermediate Targets: 370–380 → First resistance zone. 400–420 → Extension levels. Measured Move Target: ~450+ (based on the triangle height projection). 🔻 Downside (Bearish Scenario) Trigger: Failure at resistance and break below 320, confirmation under 310. Intermediate Supports: 300 → Psychological level. 280–260 → Stronger support zone. Measured Move Target: ~250 (triangle projection downward). 📈 Volume Analysis Volume has been contracting steadily during the triangle’s formation. A major volume spike will be key to confirming whichever direction TSLA chooses. ⚖️ Probability Bias TSLA is at the make-or-break resistance zone (~350). A breakout above 355 would strongly favor bulls, targeting 380 → 400+. But a rejection here and break below 320 would shift momentum bearish, sending TSLA back toward 280–260. ✅ Takeaway TSLA is at a critical inflection point inside a long-term triangle: Bullish Break > 355: Targets 370 → 400 → 450+ Bearish Break < 320: Targets 300 → 280 → 250 Watch for volume-backed confirmation, as this move could define Tesla’s next multi-week trend.MASSIVE WIN OVER $420 TODAY
QuantAi-Trend
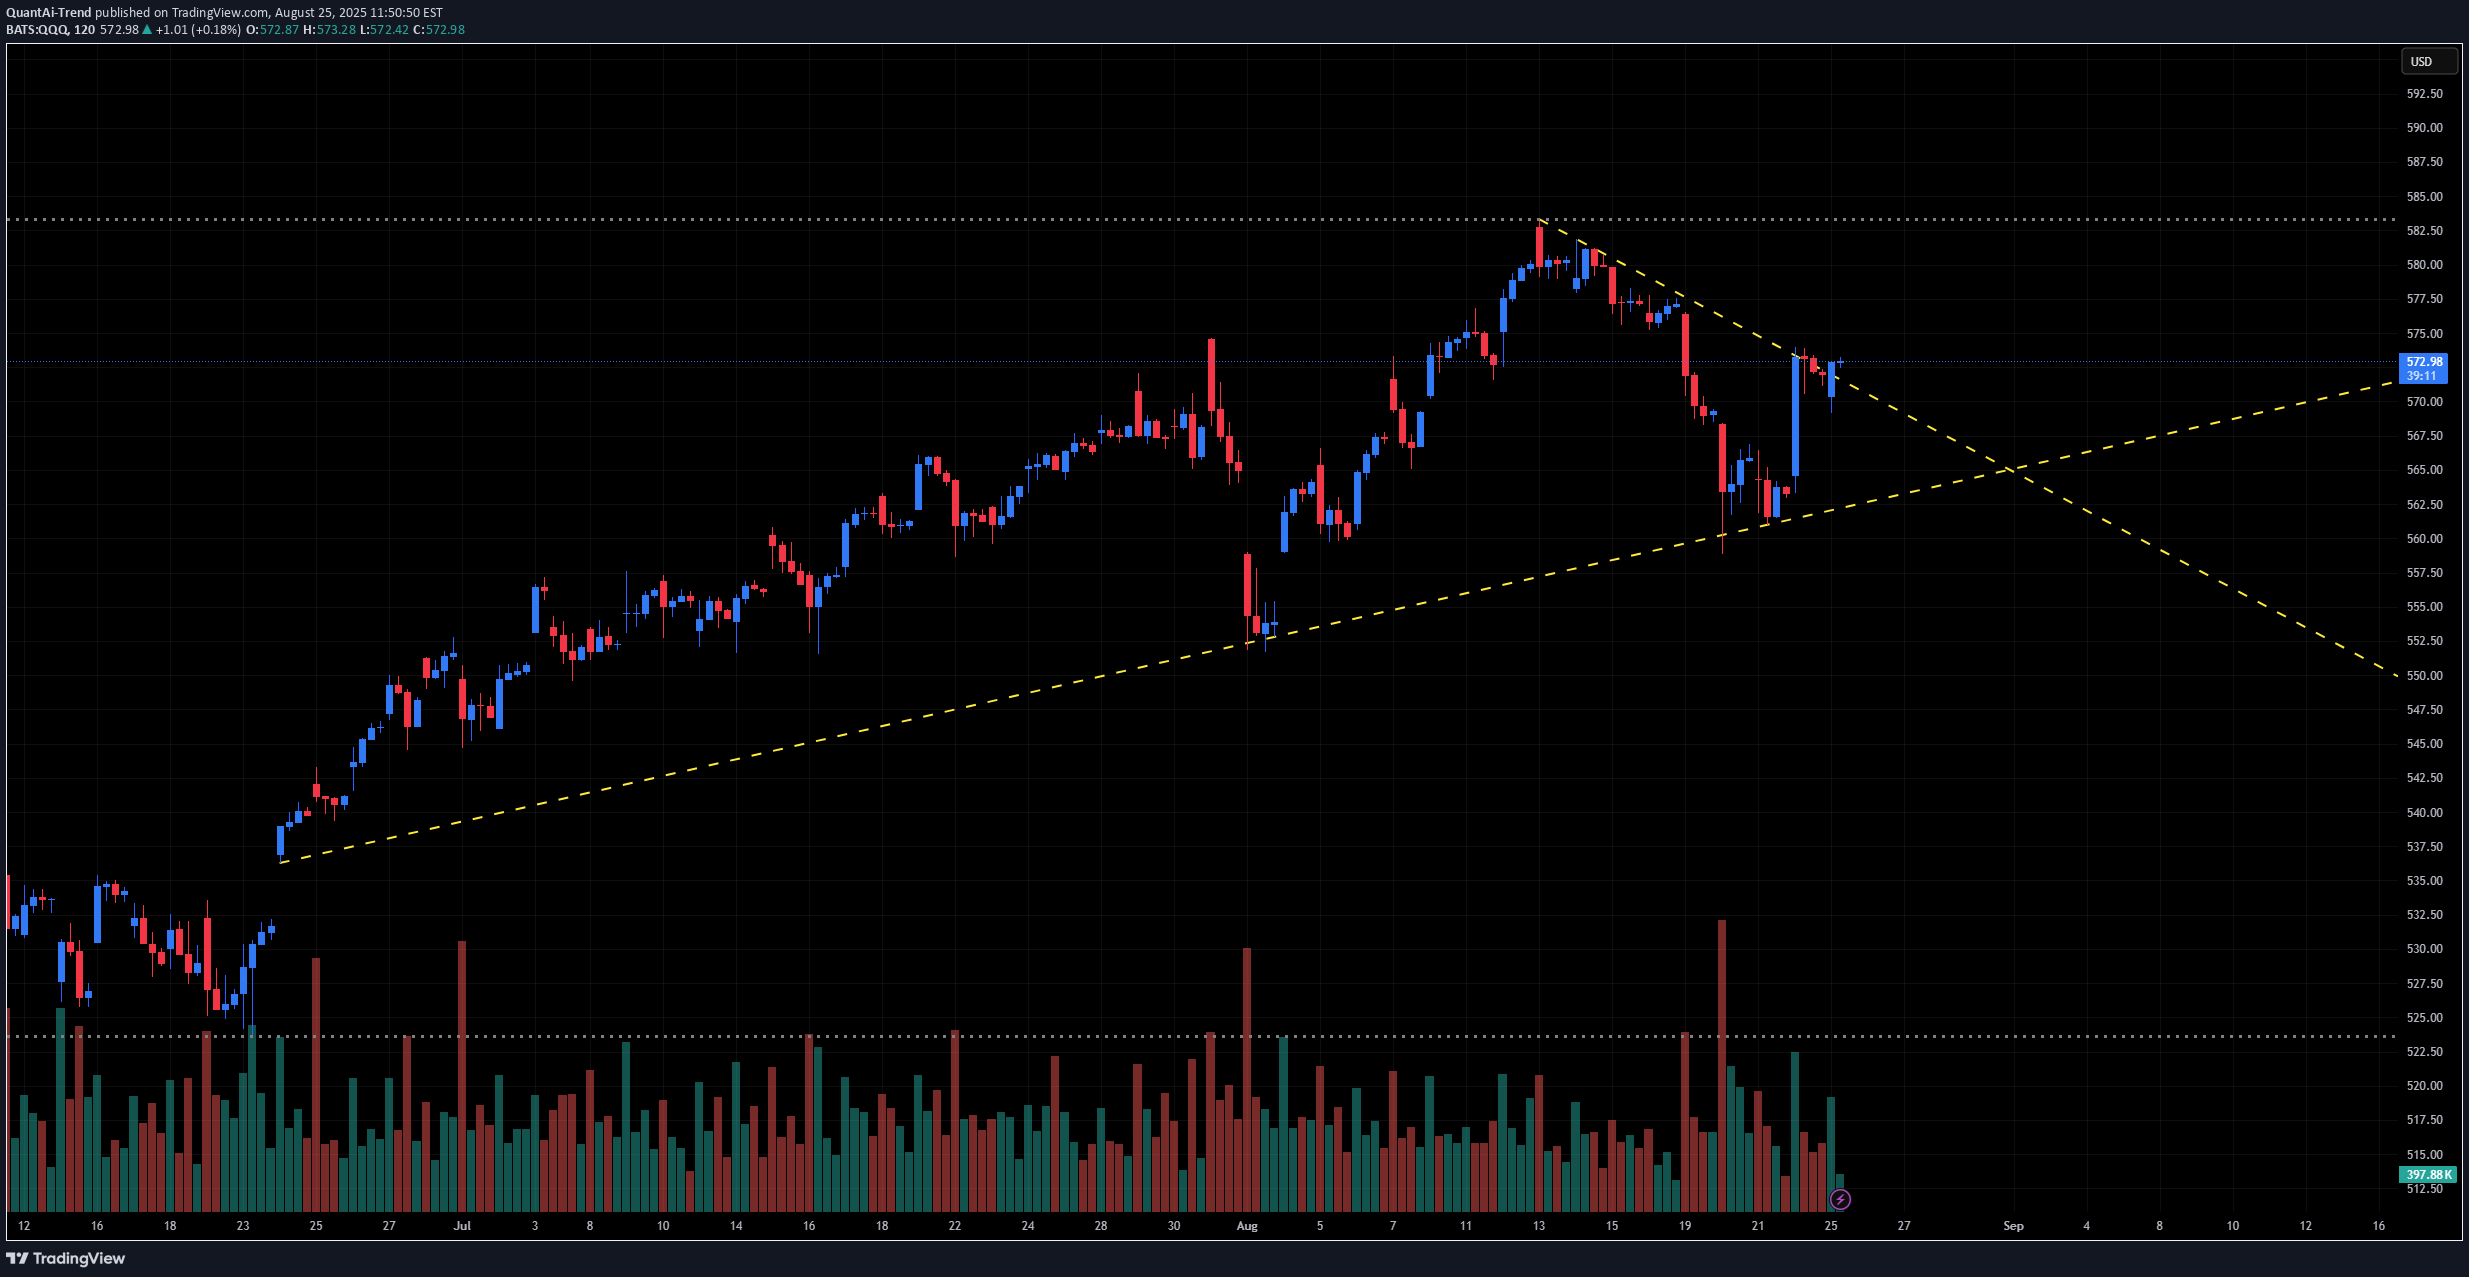
📊 QQQ Technical Outlook – Symmetrical Triangle After Pullback Ticker: QQQ (Invesco Nasdaq-100 ETF) Timeframe: 30-minute candles 🔍 Current Setup QQQ has been in a strong uptrend since June, peaking around ~582 before pulling back. Price is now consolidating into a symmetrical triangle, with: Descending resistance: from ~582 down toward current ~572. Ascending support: from June lows, now near 563–565. Current price: ~572, sitting right near the apex. This structure suggests compression ahead of a breakout move. 📊 Breakout Levels 🚀 Upside (Bullish Scenario) Trigger: Break and close above 575–577. Intermediate Targets: 582–585 → Prior highs. 590 → Extension zone. Measured Move Target: ~600 (triangle height projection). 🔻 Downside (Bearish Scenario) Trigger: Break below 565, with confirmation under 563. Intermediate Supports: 555–552 → First demand zone. 540–542 → Stronger support. Measured Move Target: ~545 (triangle height projection downward). 📈 Volume Analysis Volume has contracted during this triangle — classic consolidation behavior. Expect a volume expansion to confirm the breakout direction. ⚖️ Probability Bias The trend into the pattern was bullish, favoring continuation higher. Still, failure to defend 565 could quickly open downside risk toward 552–545. ✅ Takeaway QQQ is at a major decision point inside a symmetrical triangle: Bullish Break > 577: Targets 582 → 590 → 600 Bearish Break < 565: Targets 555 → 545HUGE WIN TO $590
QuantAi-Trend
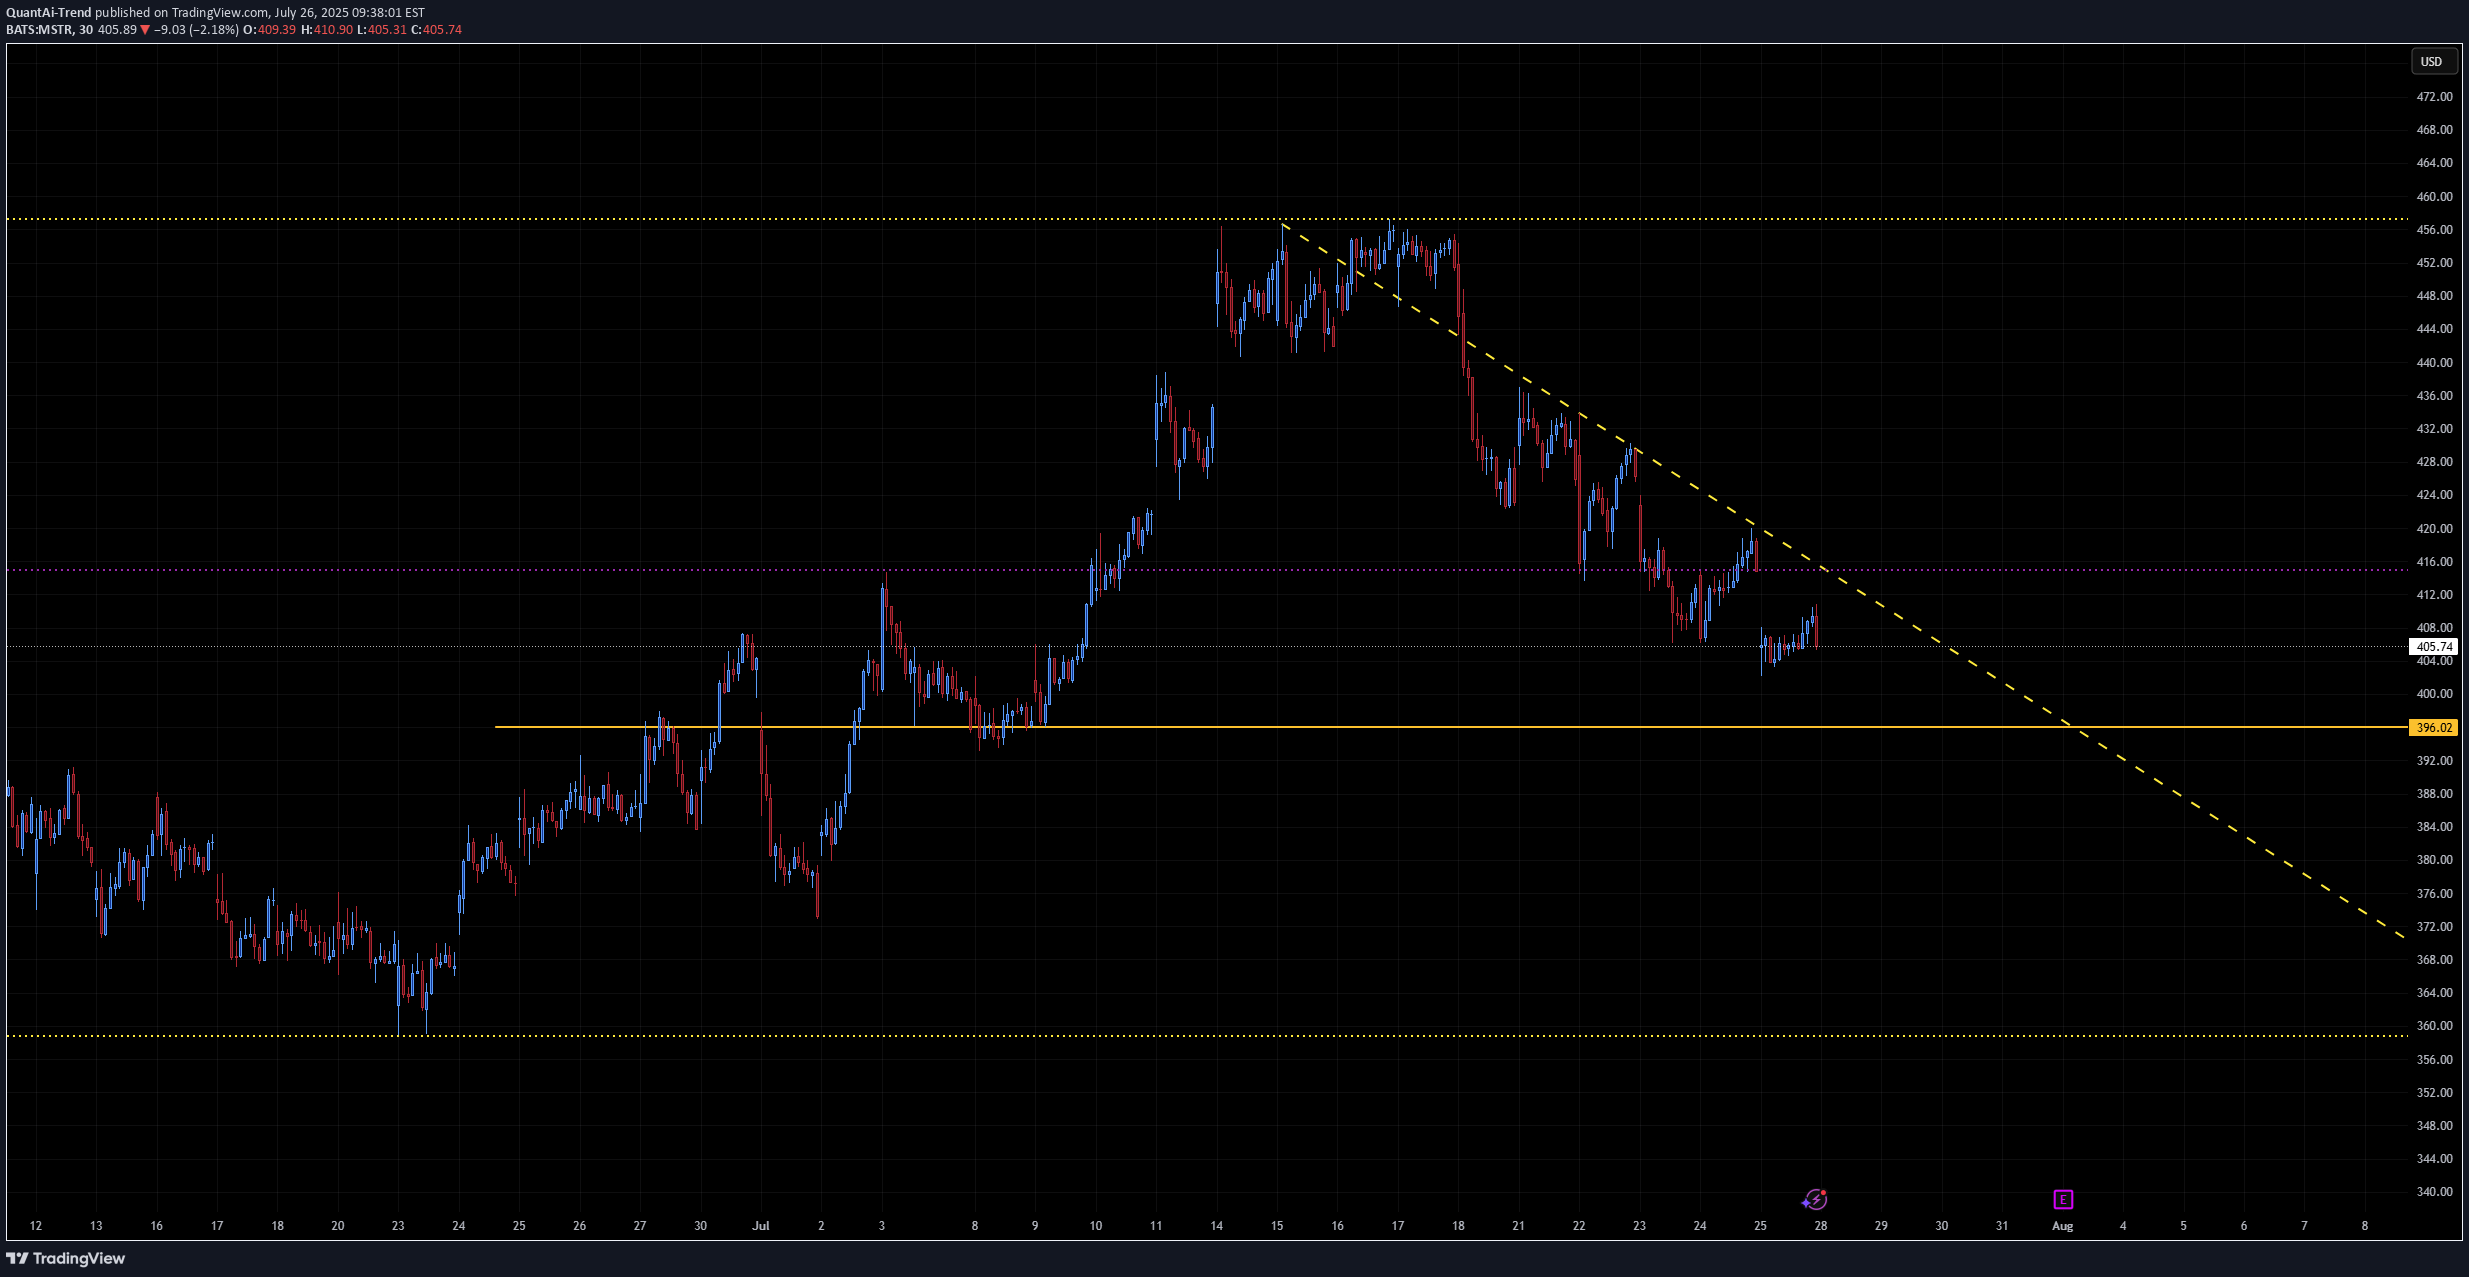
📊 MSTR – MicroStrategy Technical & Bitcoin Correlation Ticker: MSTR | Sector: Bitcoin Treasury Proxy / Enterprise Software Date: July 26, 2025 Current MSTR Price: ~$405.89 Current Bitcoin Price: ~$118,127 🔍 Chart & Price Structure Recent Action: MSTR declined from the ~$430–450 range and has consolidated around the $405 level, forming a tight base. Support Zone: $395–$400 — prior volume cluster, recent dip buyers stepped in. Weak Resistance: $415–$420 — a shallow supply zone; bigger resistance lies at ~$430. Volume & Candles: Mixed volume, with small-bodied candles showing indecision near $405. Buyers are attempting to hold. 📈 Bitcoin Outlook & Influence MicroStrategy remains tethered to Bitcoin’s trajectory. Recent BTC consolidation around $118K closely influences MSTR sentiment. BTC Projections From Citi (Jul 25): Base Case: $135K by year-end Bull Case: $199K Bear Case: $64K if equities falter or ETF flows wane Other Views: Hashdex sees BTC reaching up to $140K in 2025 Omni Ekonomi Global X ETF-based models anticipate $200K within 12 months The Australian Kiyosaki warns of potential crash despite optimism These imply a possible 25–70% upside in BTC, which could drive MSTR toward $500–$600+ if holdings are stable. ⏱️ Short-Term Outlook (1–2 Weeks) ✅ Bullish Scenario Trigger: Hold above support at $400, reclaim $415–$420 Immediate Upside Targets: First: $430 Break above $430 → $450 Drivers: Bitcoin breaking back above recent highs, ETF inflows, favorable regulatory headlines ❌ Bearish Scenario Trigger: Break below $395 Downside Targets: $380 → $360 → $350 Drivers: BTC weakness → below $110K, altcoin rotation, broader equity weakness 🔭 Long-Term Outlook (H2 2025 / beyond) 🚀 Bull Case If Bitcoin reaches $135K–$200K (Citi bull case, institutional demand, ETF momentum), MSTR could rally alongside to $550–$650. MicroStrategy’s business fundamentals (data analytics/AI) may contribute optionality beyond BTC. 🐻 Bear Case If Bitcoin retraces toward $64K or below due to risk-off sentiment or regulatory changes, MSTR could fall back toward $300–$350. 📊 Summary Table ViewTrigger LevelTargetsBitcoin ScenarioConfidence Short-Term BullAbove $405 and reclaim $415–420$430 → $450BTC > $118K and flat-to-upModerate Short-Term BearBelow $395$380 → $360 → $350BTC dips < $115KModerate Long-Term BullBTC to $135K–$200K$550 → $600+ETF inflows + adoption accelerationHigh (if BTC strength) Long-Term BearBTC drops below $110K$350 → $300Sentiment collapse or regulationModerate 🧠 Conclusion MicroStrategy’s stock remains inherently tethered to Bitcoin performance. The $395–$405 zone acts as critical support, while a push above $415–$430 could signal renewed upside. Longer-term, BTC strength into the $135K–200K range would propel MSTR toward $600+ levels; a BTC pullback could drag it toward $300 or lower. Watch Bitcoin flows, ETF updates, and pillar crypto adoption trends—these are likely to dictate MSTR’s next leg.
QuantAi-Trend
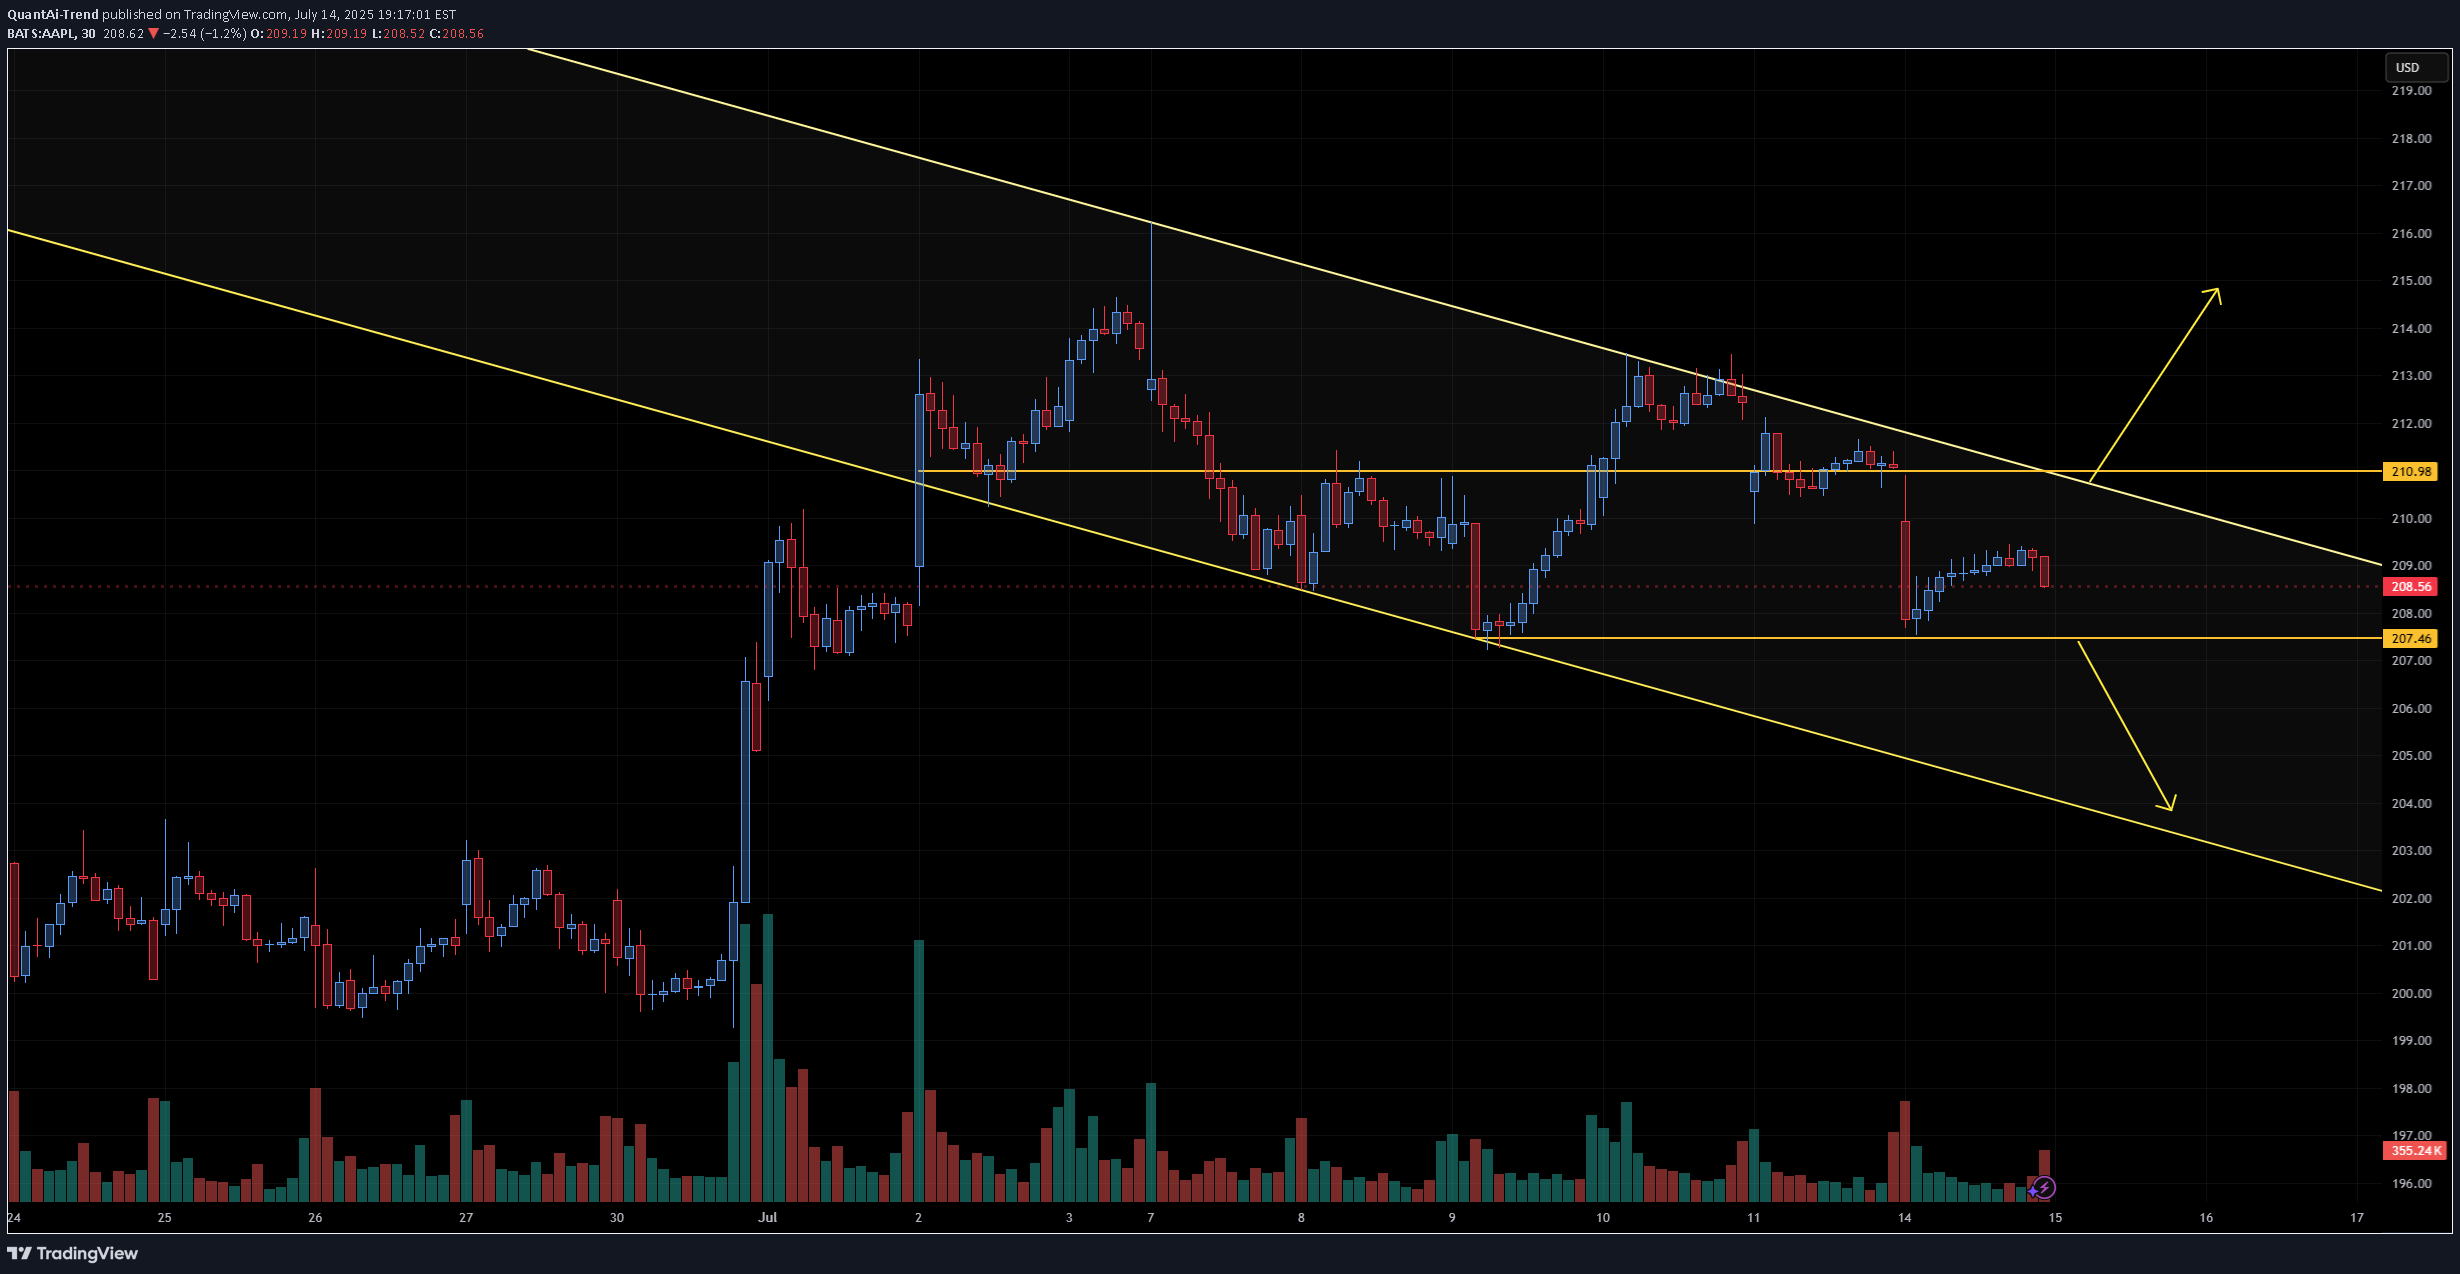
AAPL clearly shows a descending channel pattern, marked by two parallel downward-sloping yellow trendlines. Within that broader structure, the price is currently consolidating in a narrow range between two horizontal yellow lines: Resistance around $210.98 Support around $207.46 🔍 Current Technical Setup Consolidation Range AAPL is moving sideways in a tight range between $207.46 and $210.98. This narrow trading zone within a broader descending channel is typical of compression before a breakout. Descending Channel Context The channel suggests a longer-term downtrend bias, but the compression at these levels can lead to a breakout in either direction, especially when volume starts to increase. Support Zone ($207.46) This level has been tested and held, making it a key line to watch. A breakdown below this support would likely trigger a sharper selloff toward the lower channel boundary, near $203–$204. Resistance Zone ($210.98) This level lines up with the upper boundary of the current consolidation and the midline of the descending channel. A breakout above would invalidate the local downtrend and could send price to test the top of the channel (~$214+). Volume Clues Volume is relatively low during this sideways movement, which often precedes a high-volume breakout as indecision resolves. 📈 Scenarios to Watch Bullish Breakout Above $210.98 and the descending trendline. Likely target: $214–$216 Confirmation: Volume spike + strong bullish candle Bearish Breakdown Below $207.46 support. Target: $203 or lower, testing channel support. Confirmation: Increasing red volume + bearish momentum 🧠 Summary AAPL is in a compressed state, with a tight horizontal range forming inside a broader downward-sloping channel. This often sets the stage for a powerful directional move. Traders should closely monitor breaks of $210.98 or $207.46 to catch the next leg — either a reversal toward higher levels or continuation of the downtrend.
QuantAi-Trend
AlphaTrend is an advanced trading indicator that leverages proprietary tools, real-time data, and custom metrics to give traders a competitive edge. Designed for all experience levels, it works instantly—no advanced charting skills required. ADVANCED and PRO versions are available. (See below) 🔍 How It Works At the core of AlphaTrend is Dynamic Reversion Bands — a sophisticated real-time system that adapts to price action by automatically adjusting to evolving market conditions. These bands act like a roadmap, helping traders identify: Mean reversion trade opportunities Trend strength Emotion-driven market conditions (like FOMO) The system is rooted in Mean Reversion Theory: If an asset's price deviates significantly from its historical average, it tends to “revert” back to that average over time. Traders can use this behavior to spot potential buying or selling opportunities: Overbought Conditions: If the price moves too far above the mean, it may signal a pullback—traders might sell or short. Oversold Conditions: If the price drops well below the mean, it may be undervalued—traders might buy in anticipation of a bounce. ⚪🟡🔴🟡⚪ Dynamic DOTS AlphaTrend visualizes market overextension through dynamic DOTS: White DOTS = Average conditions Yellow DOTS = Above average conditions Red DOTS = Extreme conditions The DOTS update in real time as the candle is forming—appearing, disappearing, and shifting color based on current intensity levels. Once the candle closes, however, the DOTS do not repaint. This ensures clarity and confidence in every signal. This is crucial, as many indicators repaint and revise data after the fact, undermining traders’ trust. With AlphaTrend, once a candle closes, the data remains permanently fixed. 📊 Adaptability and Market Insight AlphaTrend adapts to any timeframe, but performs best on longer-duration candles, where signals are fewer but more reliable. Multi-interval displays (e.g., 1hr, 4hr, Daily) are highly recommended. That being said it does tend to give strong signals on all time frames even down to 1 min candles. The tool also integrates several intuitive market overlays: Auto-generated support and resistance levels Real-time supply and demand zones Money flow tracking from institutions and banks
QuantAi-Trend
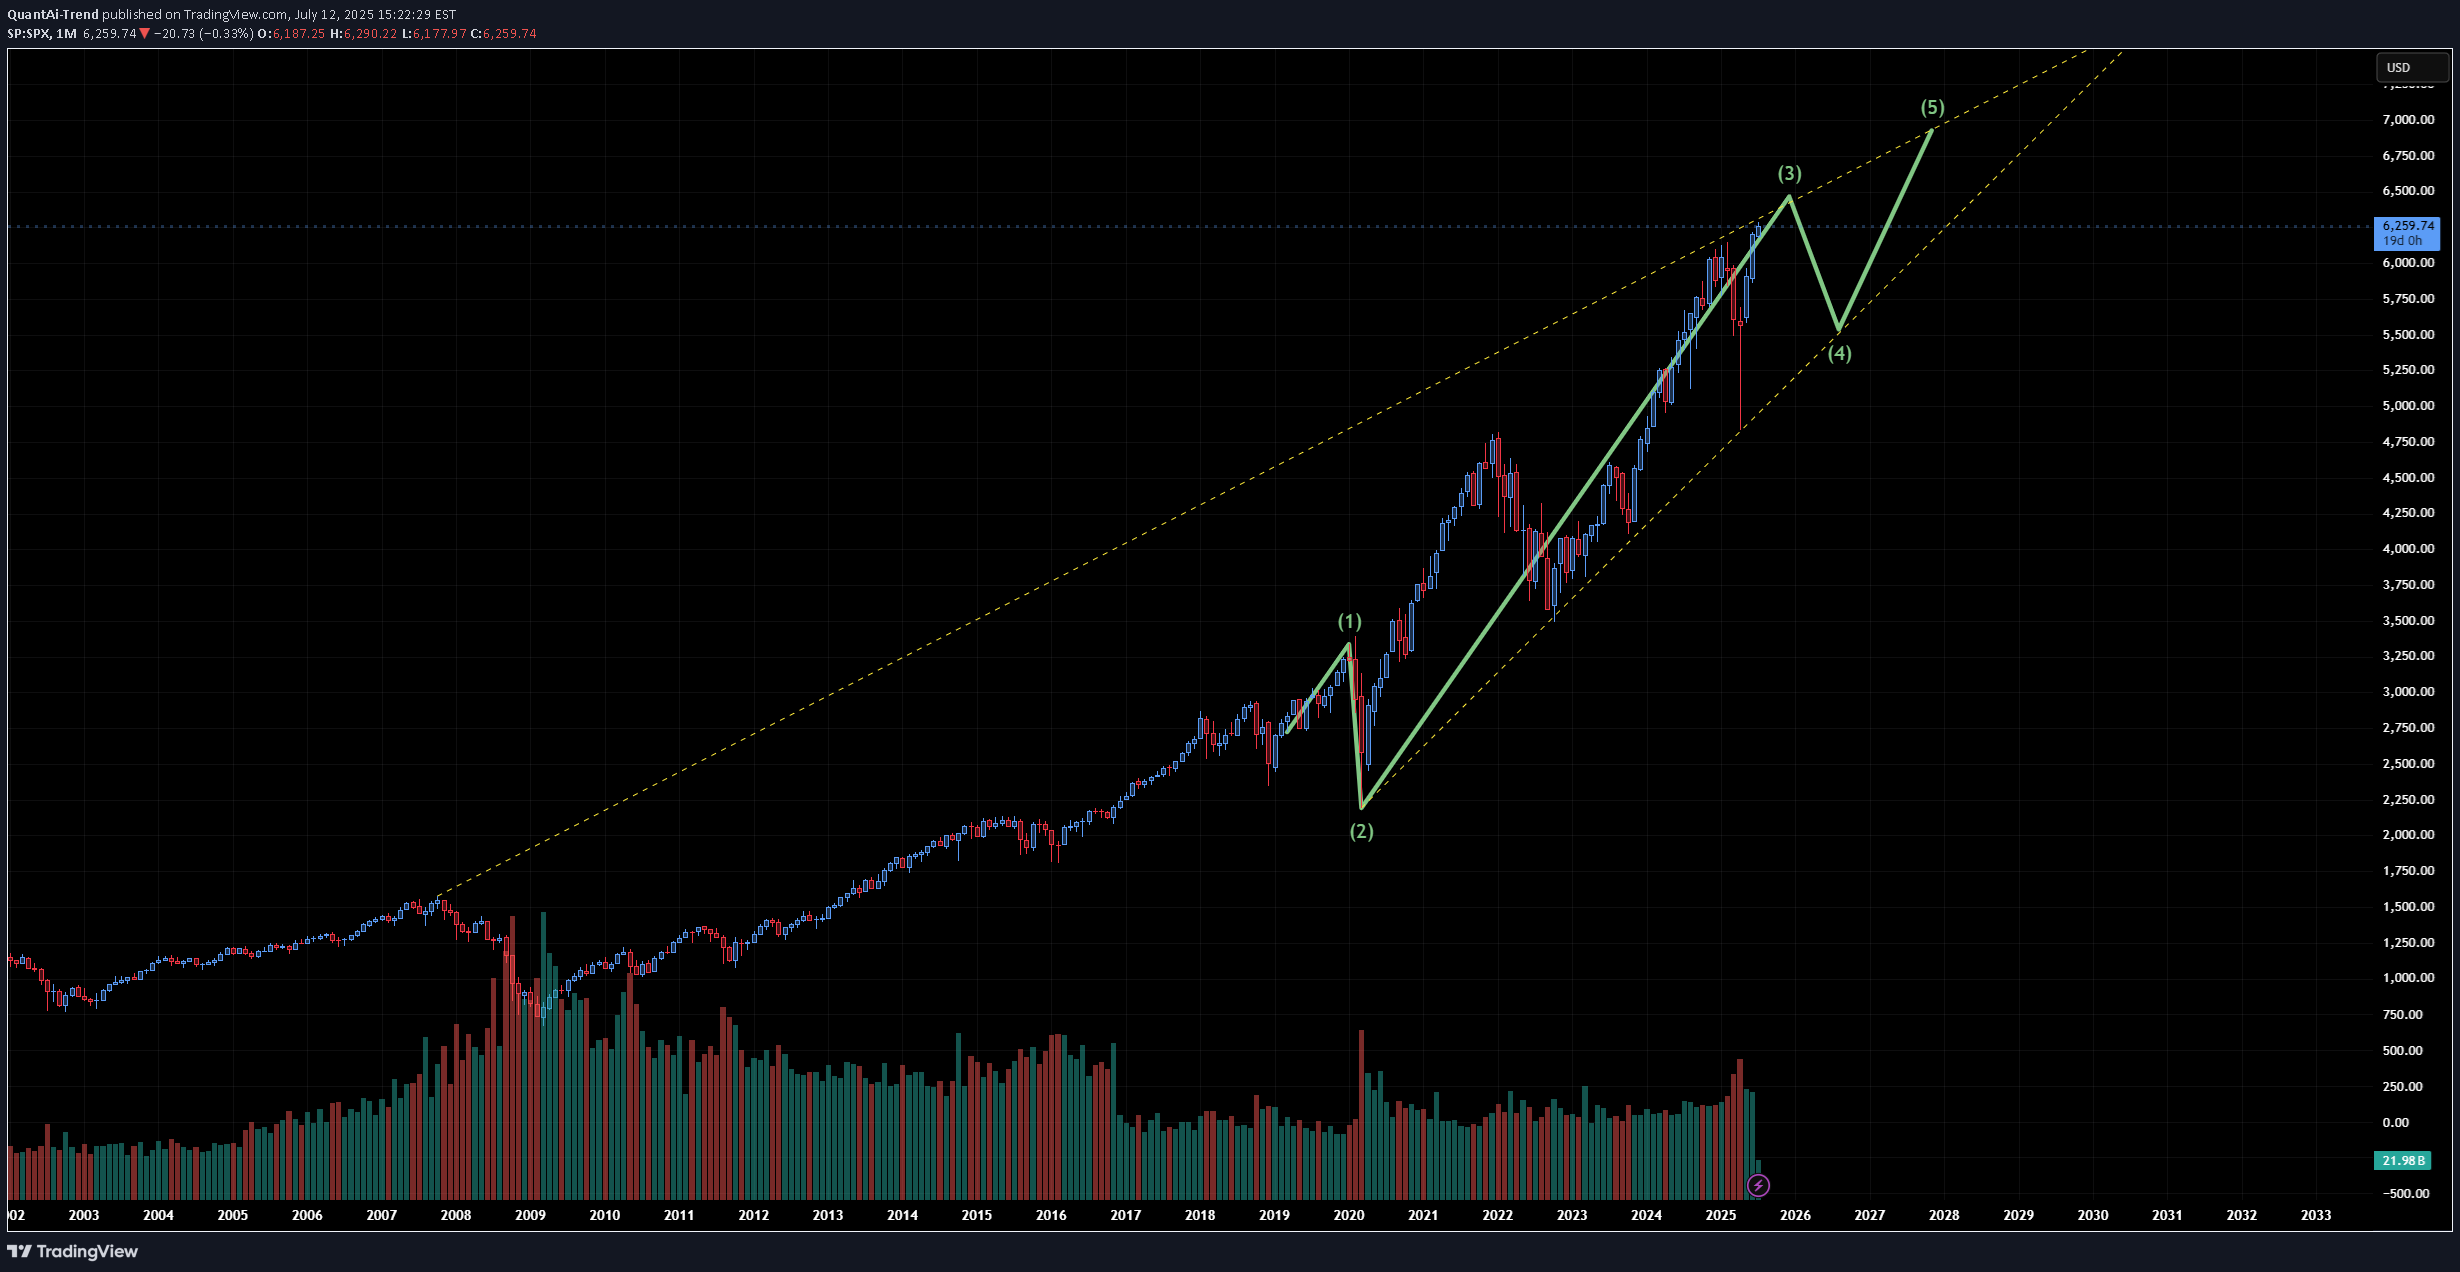
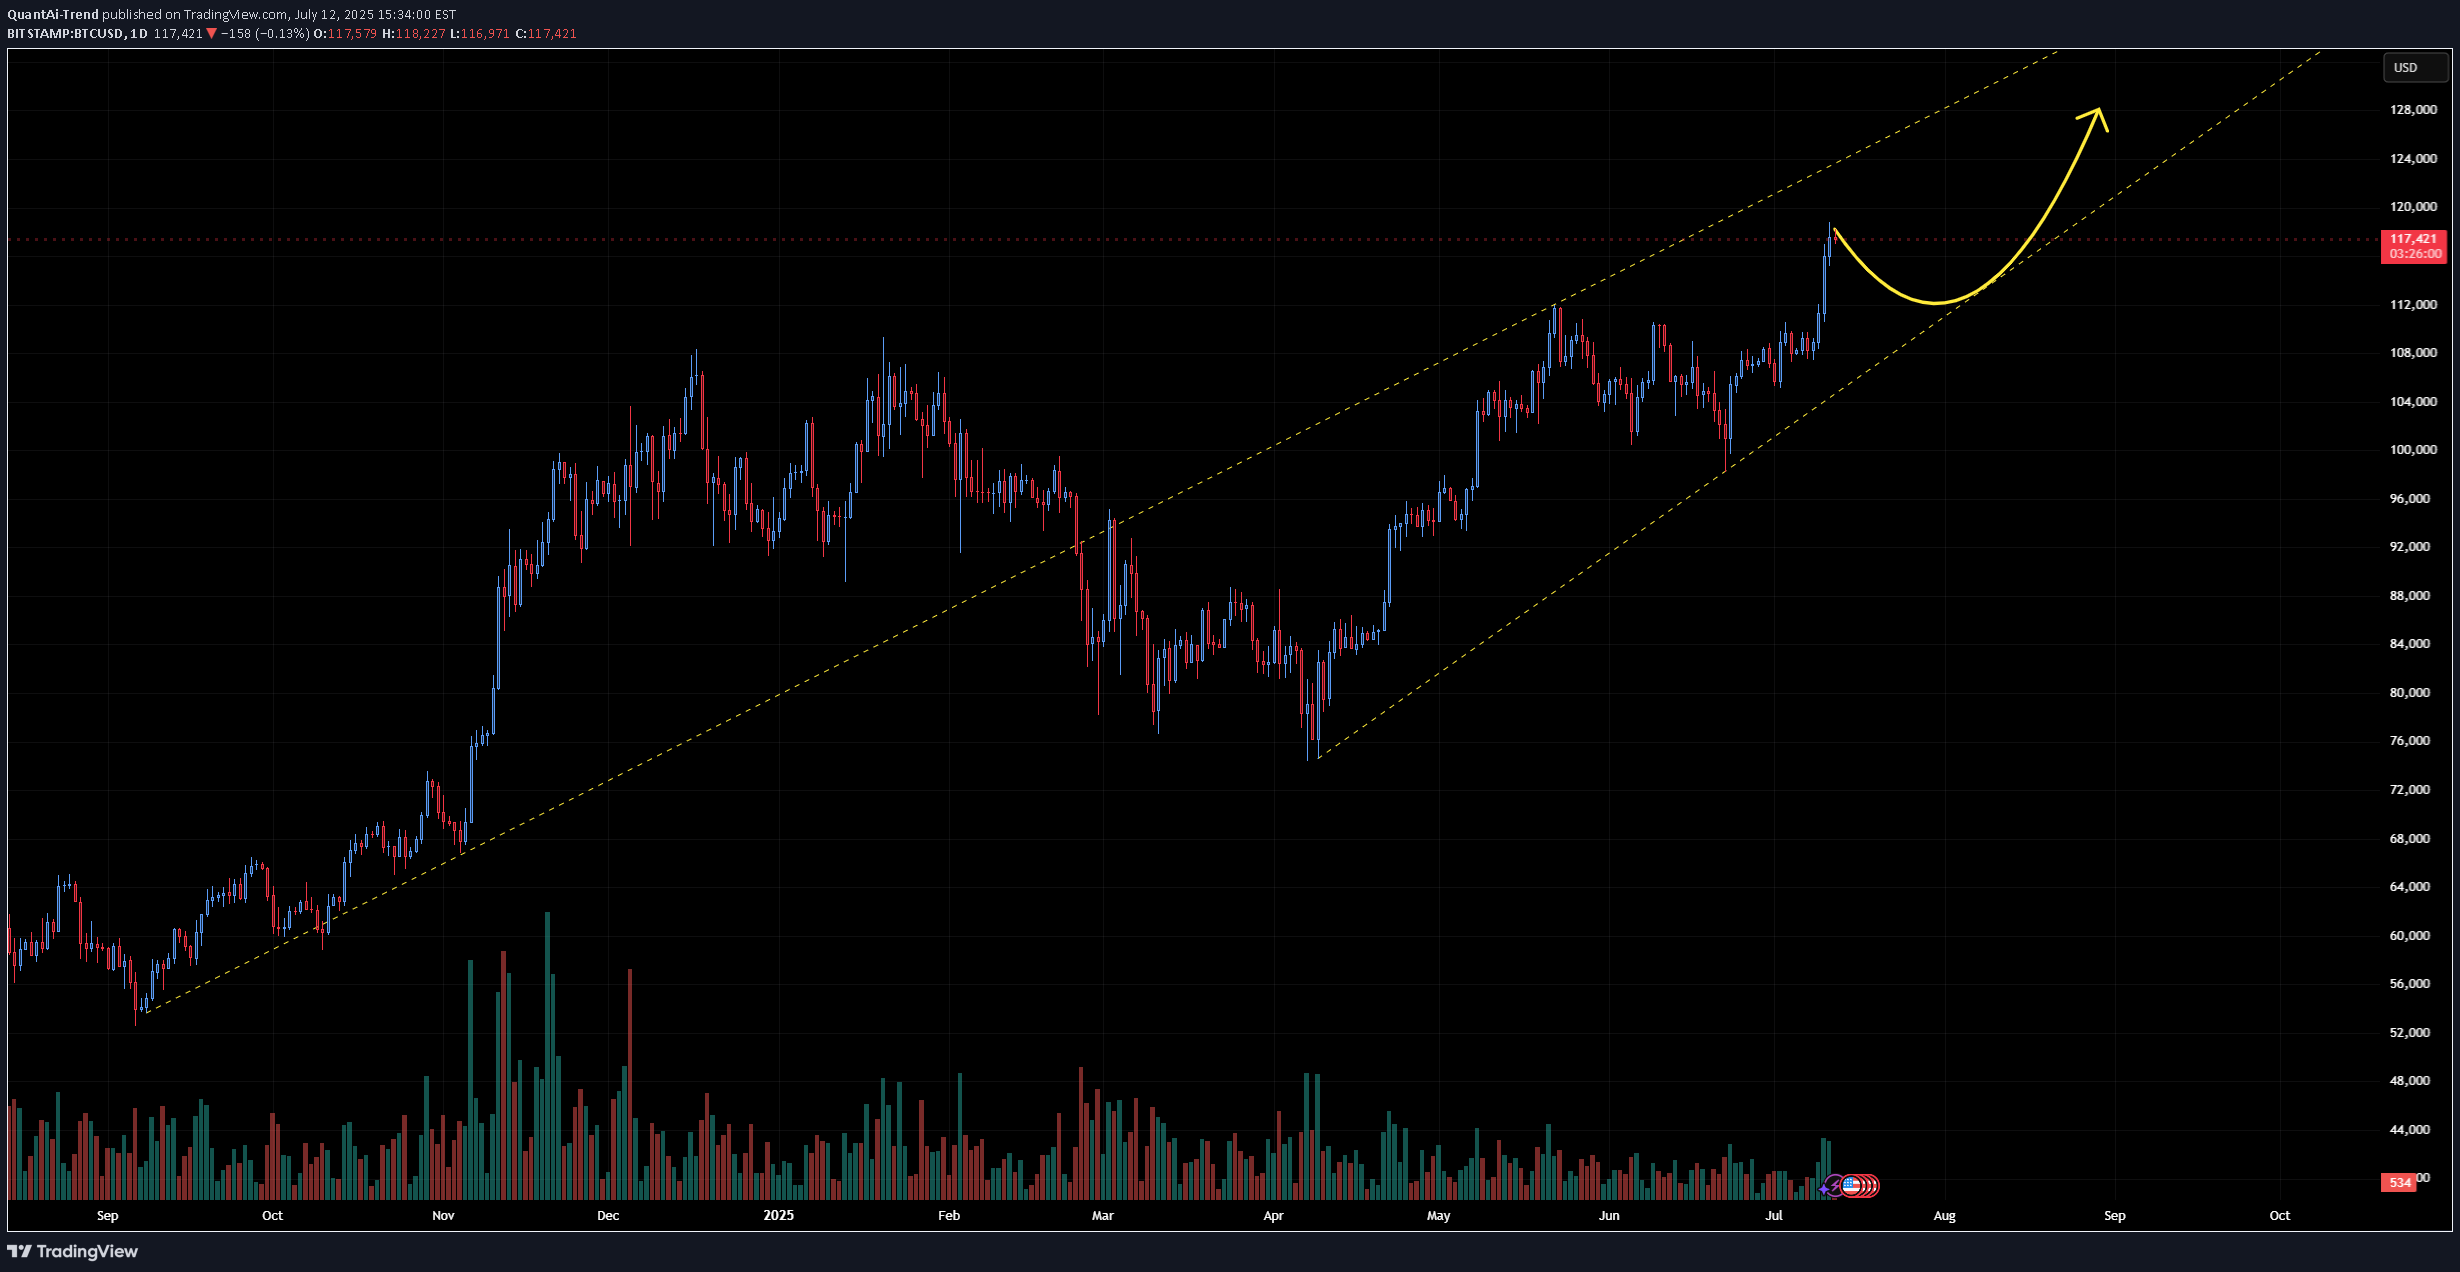
The WAVE 3 extension can go further but it seems likely that coinciding with earnings this month we will have the potential for the start of WAVE 4 retracement. The possible resignation of Jerome Powell could further intensify the charts. AlphaTrend is an advanced trading indicator that leverages proprietary tools, real-time data, and custom metrics to give traders a competitive edge. Designed for all experience levels, it works instantly—no advanced charting skills required. ADVANCED and PRO versions are available. (See below) 🔍 How It Works At the core of AlphaTrend is Dynamic Reversion Bands — a sophisticated real-time system that adapts to price action by automatically adjusting to evolving market conditions. These bands act like a roadmap, helping traders identify: Mean reversion trade opportunities Trend strength Emotion-driven market conditions (like FOMO) The system is rooted in Mean Reversion Theory: If an asset's price deviates significantly from its historical average, it tends to “revert” back to that average over time. Traders can use this behavior to spot potential buying or selling opportunities: Overbought Conditions: If the price moves too far above the mean, it may signal a pullback—traders might sell or short. Oversold Conditions: If the price drops well below the mean, it may be undervalued—traders might buy in anticipation of a bounce. ⚪🟡🔴🟡⚪ Dynamic DOTS AlphaTrend visualizes market overextension through dynamic DOTS: White DOTS = Average conditions Yellow DOTS = Above average conditions Red DOTS = Extreme conditions The DOTS update in real time as the candle is forming—appearing, disappearing, and shifting color based on current intensity levels. Once the candle closes, however, the DOTS do not repaint. This ensures clarity and confidence in every signal. This is crucial, as many indicators repaint and revise data after the fact, undermining traders’ trust. With AlphaTrend, once a candle closes, the data remains permanently fixed. 📊 Adaptability and Market Insight AlphaTrend adapts to any timeframe, but performs best on longer-duration candles, where signals are fewer but more reliable. Multi-interval displays (e.g., 1hr, 4hr, Daily) are highly recommended. That being said it does tend to give strong signals on all time frames even down to 1 min candles.
Disclaimer
Any content and materials included in Sahmeto's website and official communication channels are a compilation of personal opinions and analyses and are not binding. They do not constitute any recommendation for buying, selling, entering or exiting the stock market and cryptocurrency market. Also, all news and analyses included in the website and channels are merely republished information from official and unofficial domestic and foreign sources, and it is obvious that users of the said content are responsible for following up and ensuring the authenticity and accuracy of the materials. Therefore, while disclaiming responsibility, it is declared that the responsibility for any decision-making, action, and potential profit and loss in the capital market and cryptocurrency market lies with the trader.