Technical analysis by QuantAi-Trend about Symbol TSLAX on 11/2/2025

QuantAi-Trend
خطر بزرگ برای خریداران: تسلا در آستانه انفجار قیمتی یا سقوط؟
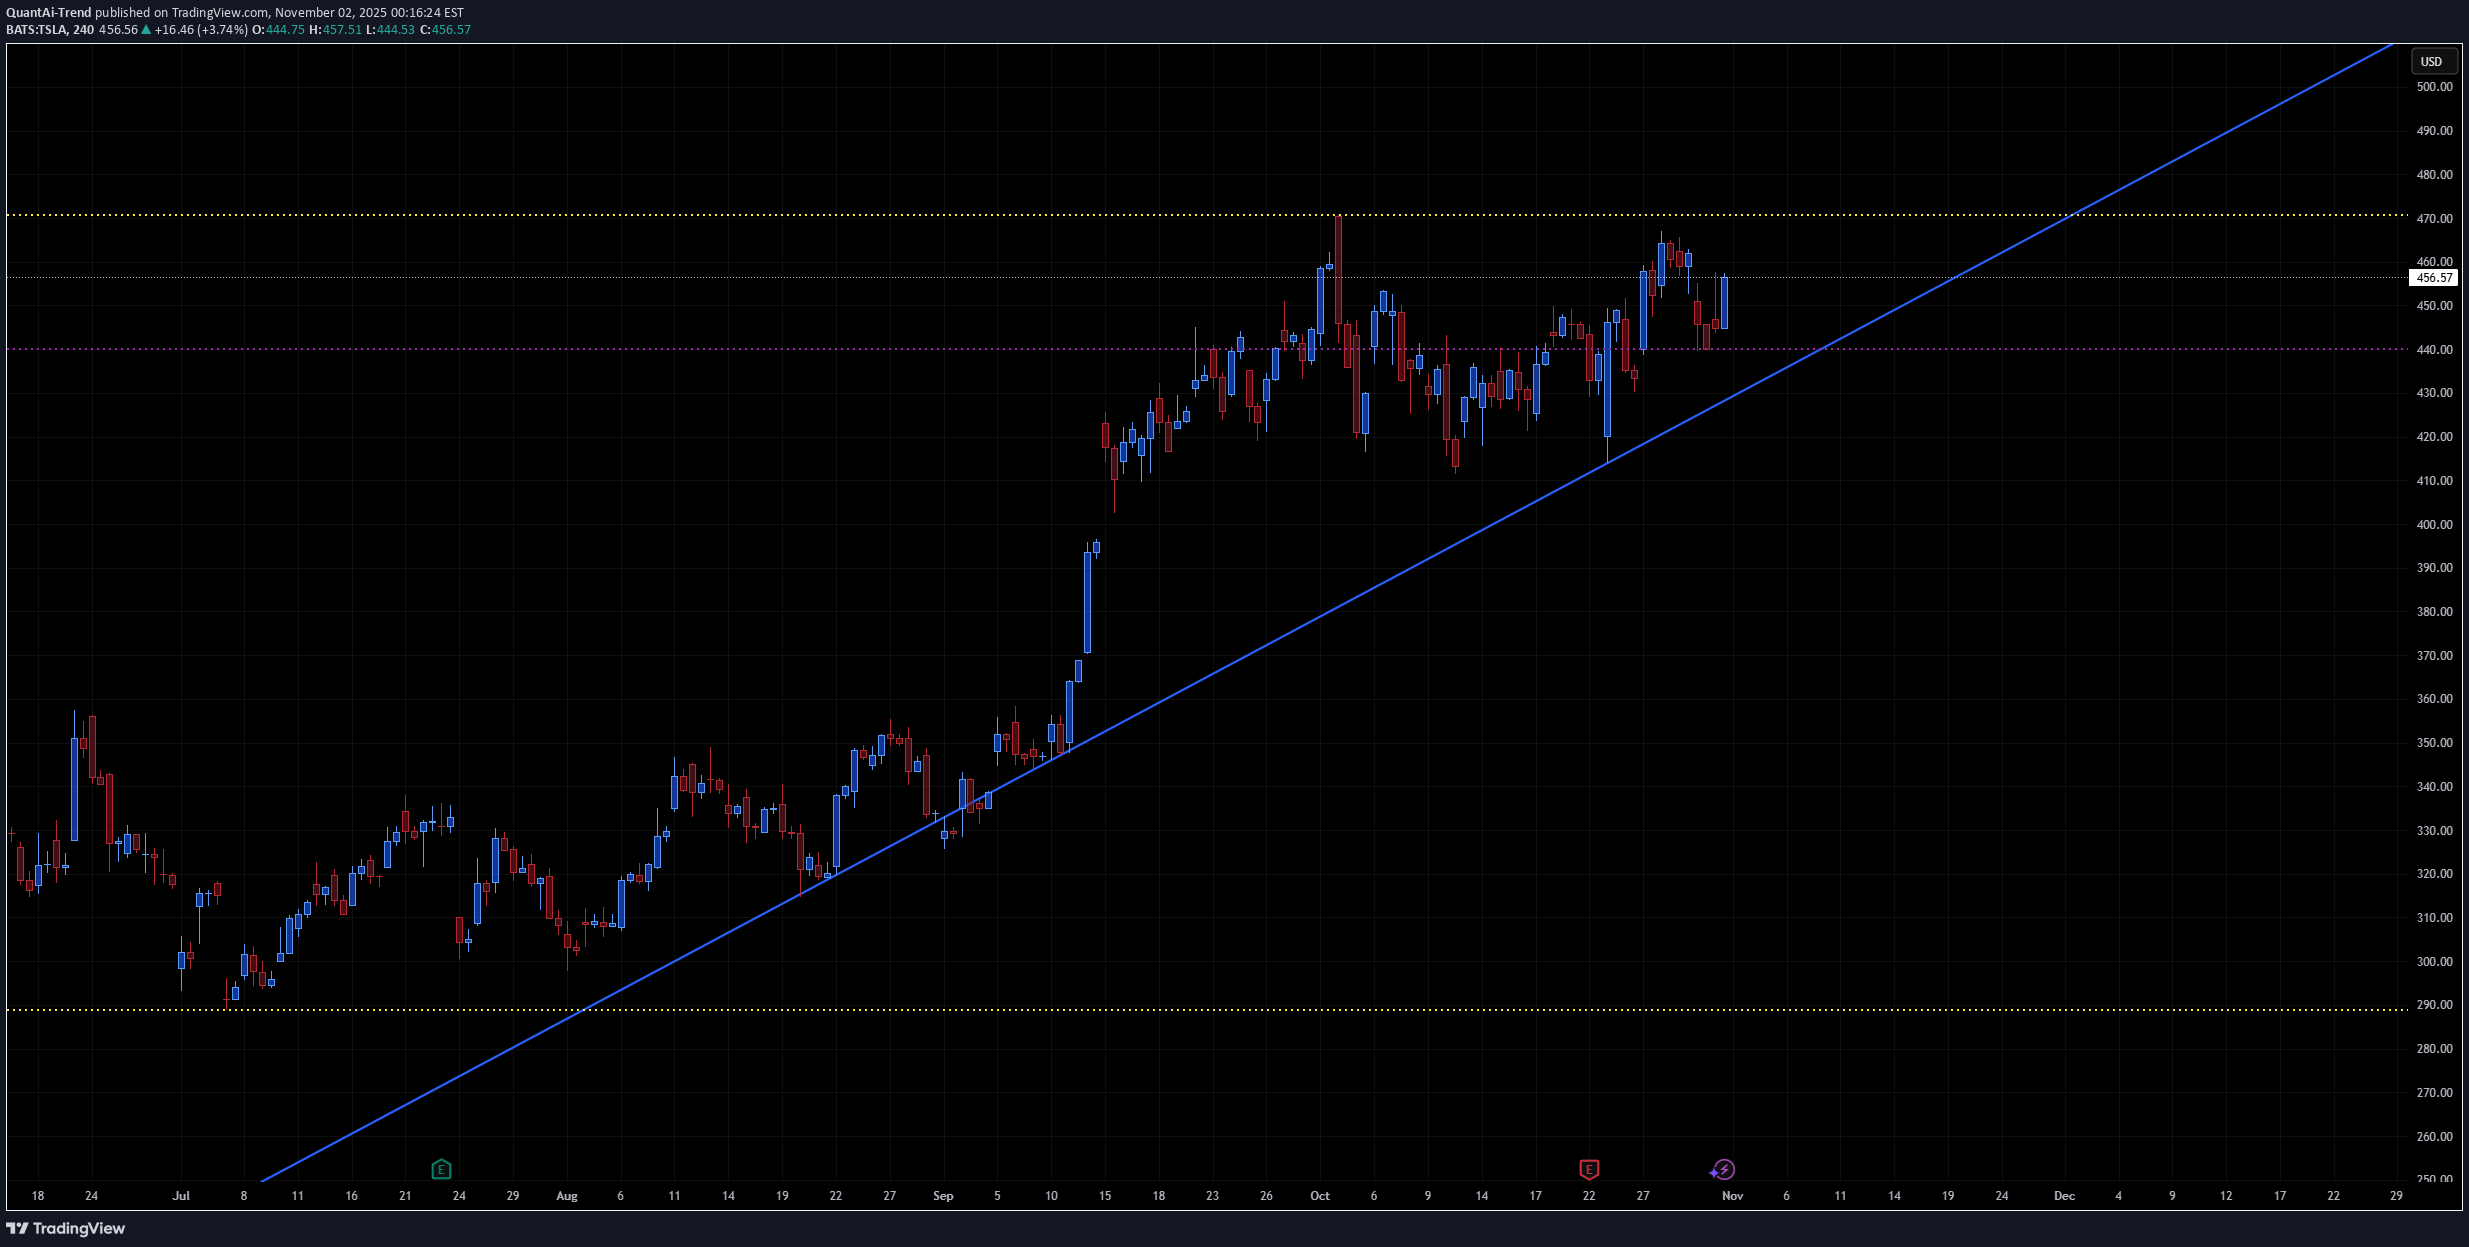
A rising trendline acting as strong dynamic support from the August lows. Resistance zone near $470–475 (yellow line, recent double-top area). Current price at $456, holding above trendline support. Support floor near $290, far below current levels — indicating we’re in a mid-term uptrend phase, not deep correction. This pattern fits a rising channel consolidation near resistance — the next move depends on whether the trendline holds. 📈 Bullish Scenario Setup: TSLA is holding the ascending trendline while consolidating just below resistance — a classic bullish continuation structure. Confirmation Triggers: Break and daily close above $470–475 (clear breakout). Follow-through volume or a strong gap-up session confirming momentum. Short-Term Targets: $490–495 → initial breakout target (projected move from last swing). $510–520 → extended target if buyers sustain momentum. Catalysts: Broader tech strength (QQQ, NASDAQ rally). Positive EV demand data or production updates. Institutional accumulation at the breakout level. Invalidation: Break and close below $445, violating trendline support. Probability: ~60% (uptrend intact, momentum favors bulls). 📉 Bearish Scenario Setup: If TSLA fails to break $470 again and loses the $445 trendline, momentum could unwind toward prior support. Confirmation Triggers: Close below $445 with increased volume. Failed retest near $450–455 forming lower high. Short-Term Targets: $420–425 → first support zone from early October. $390–400 → deeper correction toward base of last breakout. Catalysts: Weak market sentiment or NASDAQ pullback. Negative headlines on delivery numbers or margins. Broader EV sector weakness. Invalidation: Breakout above $475 with strong follow-through. Probability: ~40% (depends on strength of support at $445). ⚖️ Neutral / Sideways If TSLA oscillates between $445–475, expect continued range consolidation along the trendline — typically preceding a directional breakout in 1–2 weeks. 🧩 Summary Table BiasConfirmationTarget ZoneInvalidationNotes BullishClose > $475$490 → $520< $445Continuation of uptrend BearishClose < $445$425 → $400> $475Trendline break NeutralRange $445–475——Coiling near apex 🕒 2–3 Week Projection Bullish path: Hold $450–455 → breakout above $475 → reach $495–500 by mid-Nov. Bearish path: Reject $470 → break below $445 → pull back to $420 by late Nov.