Technical analysis by QuantAi-Trend about Symbol QQQX on 11/2/2025

QuantAi-Trend
نزدک 100 در آستانه انفجار: صعود یا سقوط قریبالوقوع؟
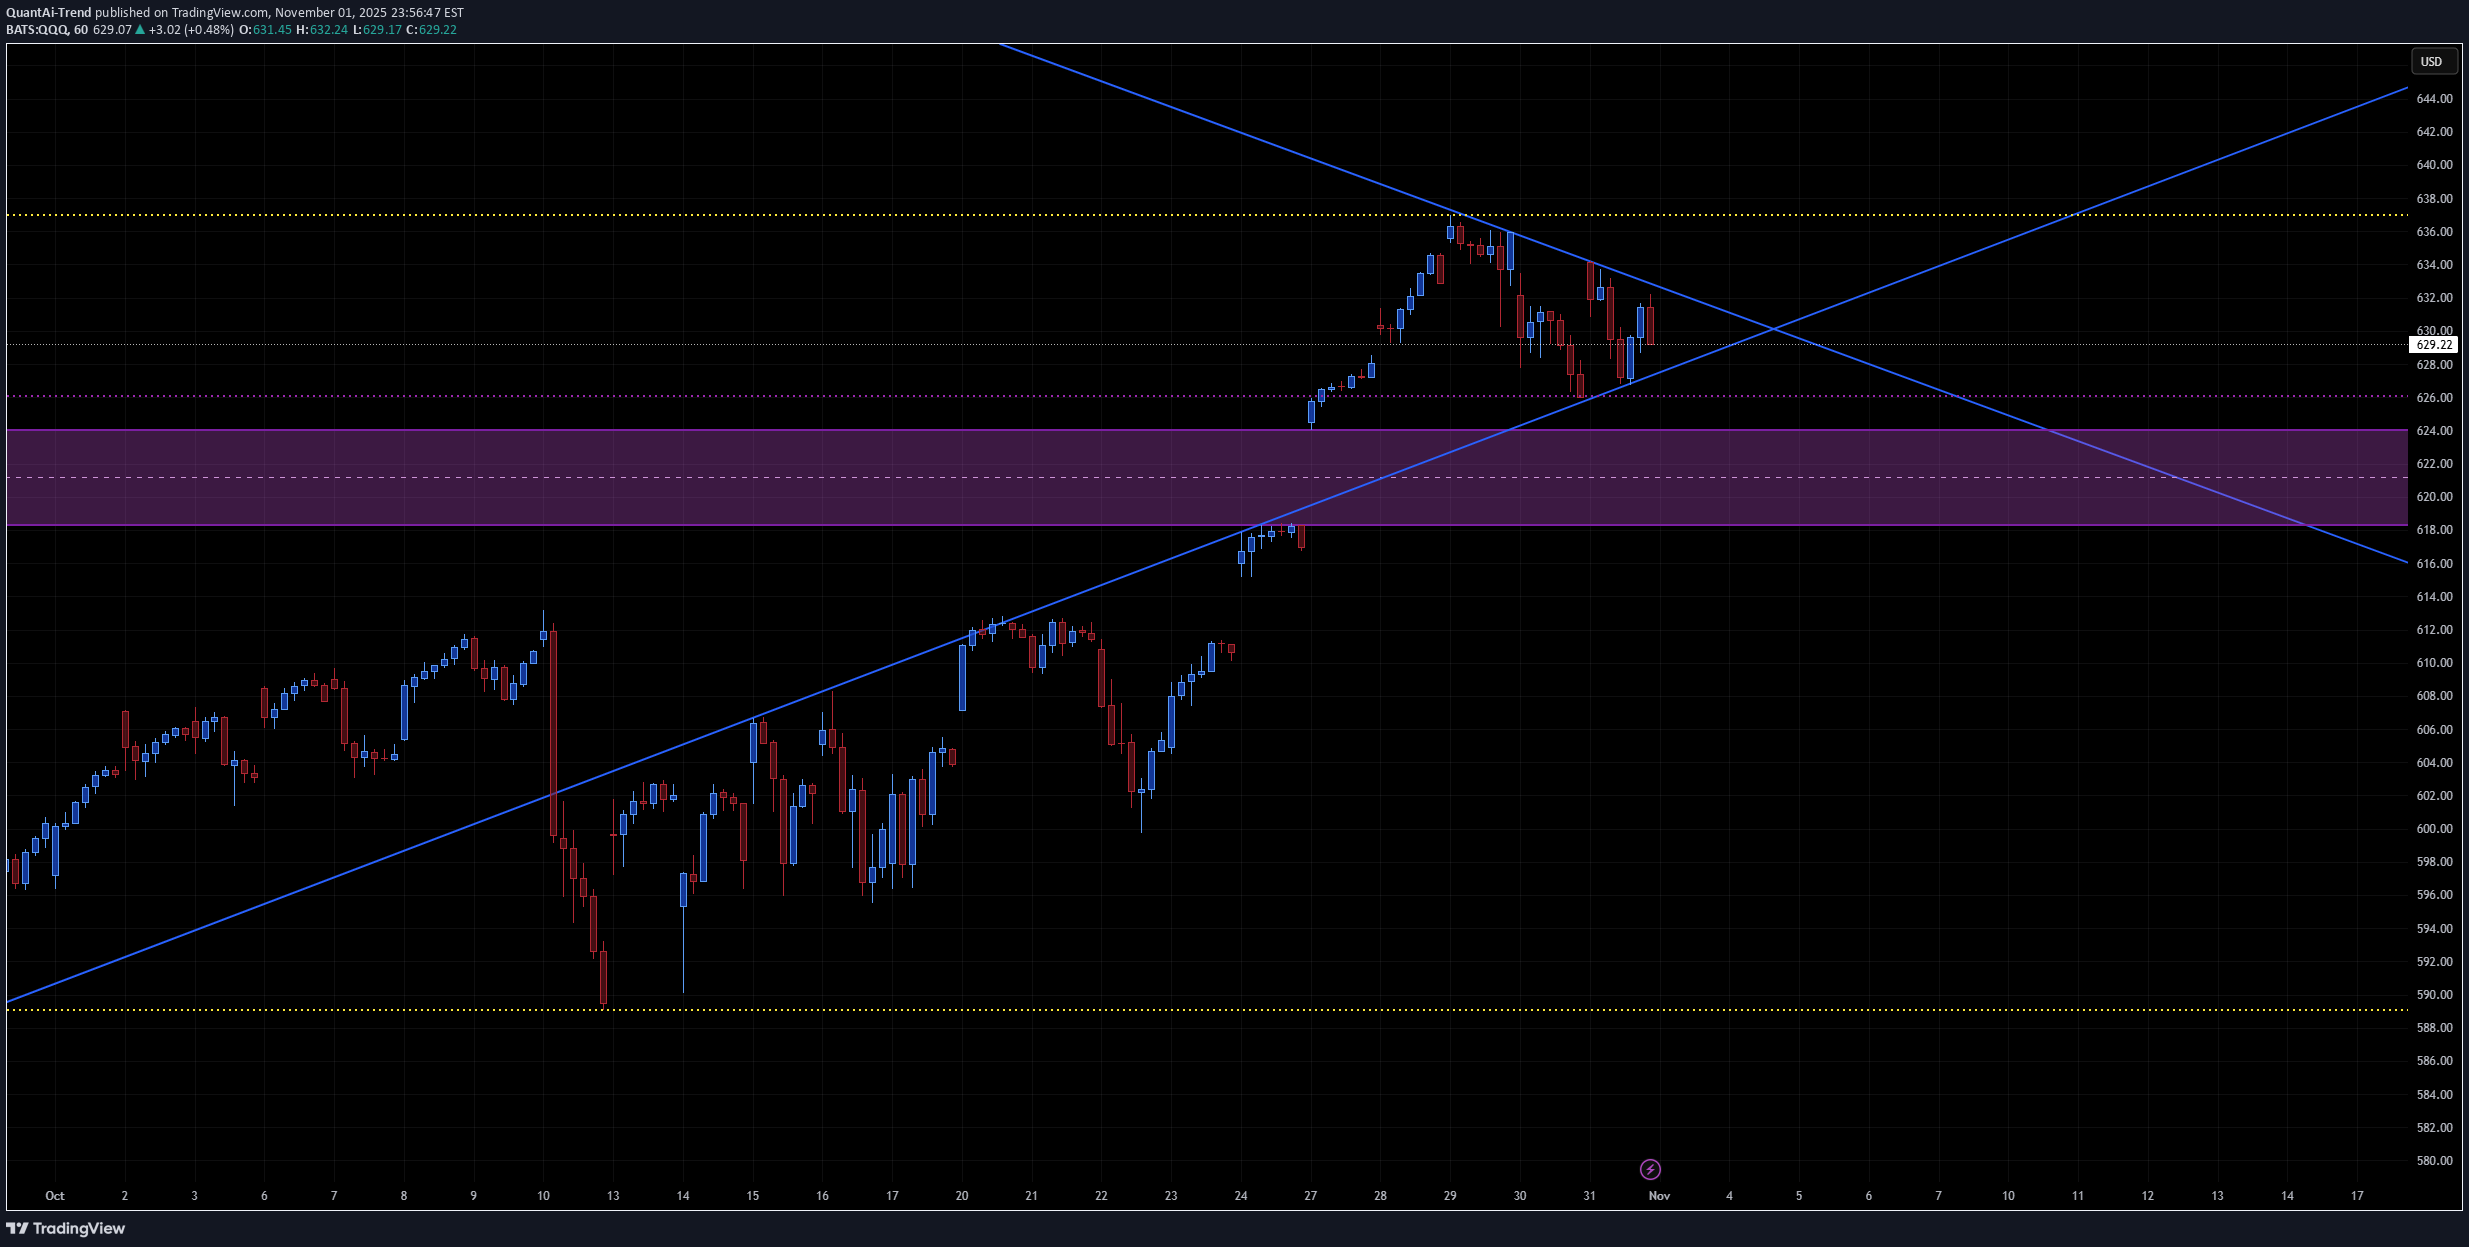
The chart for QQQ (NASDAQ 100 ETF) shows: Converging trendlines forming a symmetrical triangle (lower rising trendline from mid-October and upper descending from recent highs). Primary support zone in 618–626 range (highlighted purple region). Key horizontal resistances near 629–632 and 638–640. This structure signals an upcoming volatility squeeze — likely breakout or breakdown soon (within 1–2 weeks). 📈 Bullish Case Setup: QQQ is currently near 629, just below the descending resistance line. Bulls will want a clean breakout and hold above it. Confirmation Triggers: Break and daily close above 632–634 (above triangle and resistance). Follow-through volume expansion confirming institutional buying. Short-term Targets: 638–642 → First resistance zone (top of recent swing highs). 650–654 → Measured move from the triangle (~+3–4%). 660–664 → Extended move if macro tailwinds continue (NVDA/MSFT strength, yields drop, etc.). Bullish Catalysts: Softer inflation or dovish Fed signals. Tech-led earnings beats. Breadth improvement in NASDAQ components. Invalidation: Rejection from 632 with breakdown under 624 (back into purple zone). 📉 Bearish Case Setup: Rejection from upper triangle boundary near 630–632, followed by a breakdown through rising trendline support. Confirmation Triggers: Break and daily close below 622–620 (support zone and ascending trendline). Weak rebound attempts with lower highs near 626–628. Short-term Targets: 610–614 → Initial drop target (bottom of structure). 595–598 → Major prior demand zone (matches yellow dotted horizontal line). 582–585 → Extended bearish target if broader market correction accelerates. Bearish Catalysts: Sticky inflation, higher yields, or hawkish Fed tone. Tech sector profit-taking. Risk-off sentiment spillover from macro headlines. Invalidation: Sustained breakout above 634–636 with heavy volume. ⚖️ Neutral Scenario Currently, QQQ is consolidating between 620 and 632, forming higher lows but lower highs. Until one side breaks decisively, expect range trading and false breakouts within this triangle. The apex of the triangle sits around Nov 5–7, implying a move should materialize within ~1–2 weeks. 🧩 Summary Table BiasConfirmationShort-Term TargetStop / InvalidationNotes BullishClose > 632–634638 → 650< 624Breakout from triangle BearishClose < 620–622610 → 595> 634Breakdown from wedge NeutralRange 620–632——Coil ahead of breakout 🕒 2–3 Week Projection Bullish Path: Consolidate 626–632 → Breakout mid-next week → Rally to 640–650 by mid-Nov. Bearish Path: Fail at 630 → Breakdown below 620 → Slide toward 600 by mid-Nov.