
Phillipklh
@t_Phillipklh

What symbols does the trader recommend buying?
Purchase History
پیام های تریدر
Filter
Phillipklh
تحلیل هفتگی اتریوم (ETH): آیا تزریق نقدینگی فدرال رزرو به معنای سقوط بزرگ بعدی است؟
The Deutsche Bank expects the Fed to start printing money in the beginning of December. In addition to that, we already saw a liquidity shortage in the past weeks, with the Fed reacting with a $21B liquidity injection into the system to keep the system running and prevent a bank run. After all that, there is also the massive debt of the US, which can't be paid off properly anymore and needs to be monetized by inflation. These factors lead to this point, where liquidity needs to be injected. Funding Rates show local highs, suggesting the local top is in. The liquidity heatmap shows liquidity above us, which leads to the thesis that after this move most traders are entering leveraged short positions now. The bottom could be in when Funding Rates flip negative. The current count as seen on the chart shows that the corrective movement isn't over and this has to reasons: Firstly, the indicators of the superior timeframe and cycle do not show signs of the end of this corrective movement and secondly, the current structure doesn't show the impulsiveness I'd like to see of a first wave. The alternative scenario is invalidated as we break the red market low, but the chances for the alternative scenario already lowered massively because of the big candle facing downwards. My favored position here is definitely a short but the chances getting liquidated or stopped out are very high. Stop loss would be at one peercent above the high of the X and take profit at the low of the Z.
Phillipklh
سولانا در آستانه جهش بزرگ؟ تحلیل هفتگی سرنوشتساز (9 تا 15 نوامبر)
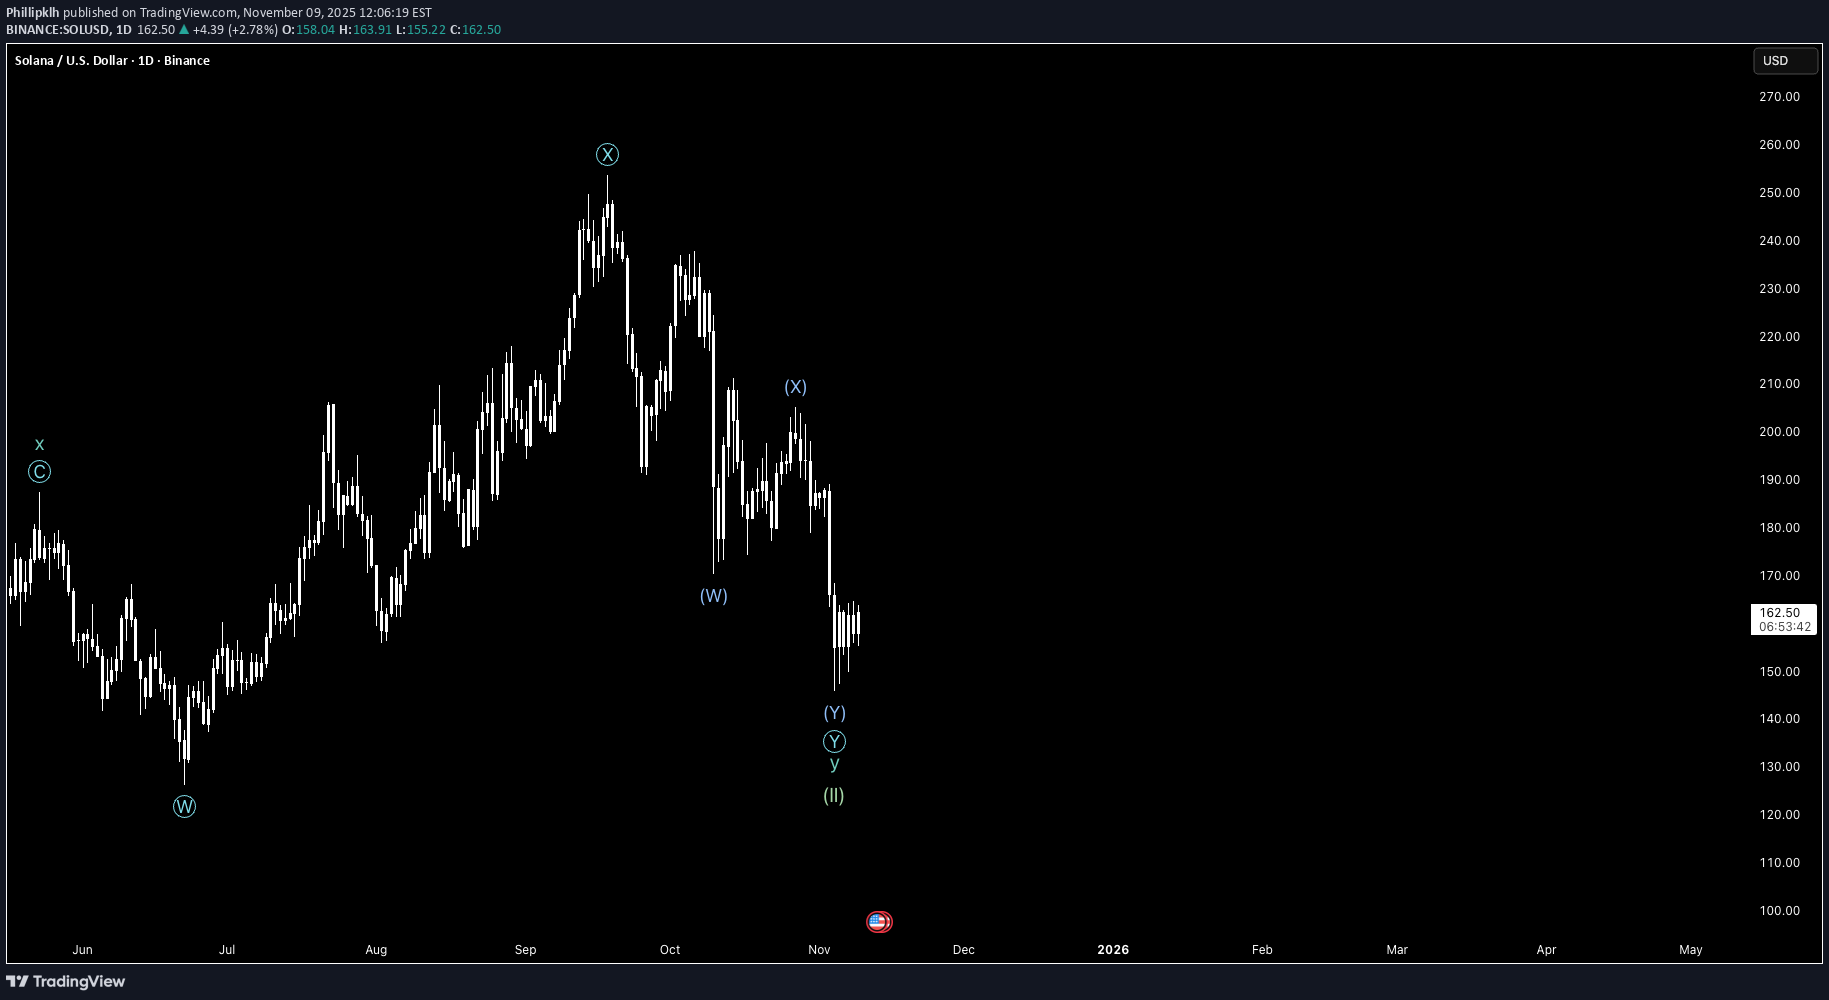
The show must go on - even after my last analysis on Solana failed. In this analysis, I want to rework this and go through the current structure to evaluate where we are and what to expect. So where are we? First coins pumped, most coins show the end of their corrective movement and Ethereum and Solana are standing still although the long desired Altseason seems to start. Meanwhile, ETF flows show inflows over the past weeks. The liquidity heatmap shows massive amounts of liquidity above the current price and funding rates stay low to negative. The current structure suggest an ending of the current corrective movement, or atleast there should be a move upwards in the short-term. Looking at the current macro environment, the Fed ends its quantitative tightening and may be starting quantitative easing in december, as the Deutsche Bank expects. Not only the Deutsche Bank, but also do I expect the Fed to start QE. Not because of weakening economy but because of monetizing the US debt and preventing a liquidity crisis which can lead to a bank run in the future. For short: they don't have a choice but to start pumping liquidity into the market and economy. This is my opinion on Solana and crypto as requested and I do suggest to slowly DCA into several cryptos to save the value of your money and maybe also profit off this cycle.
Phillipklh
تحلیل هفتگی LINK: چرا سقوط ادامه دارد و بهترین زمان خرید کجاست؟
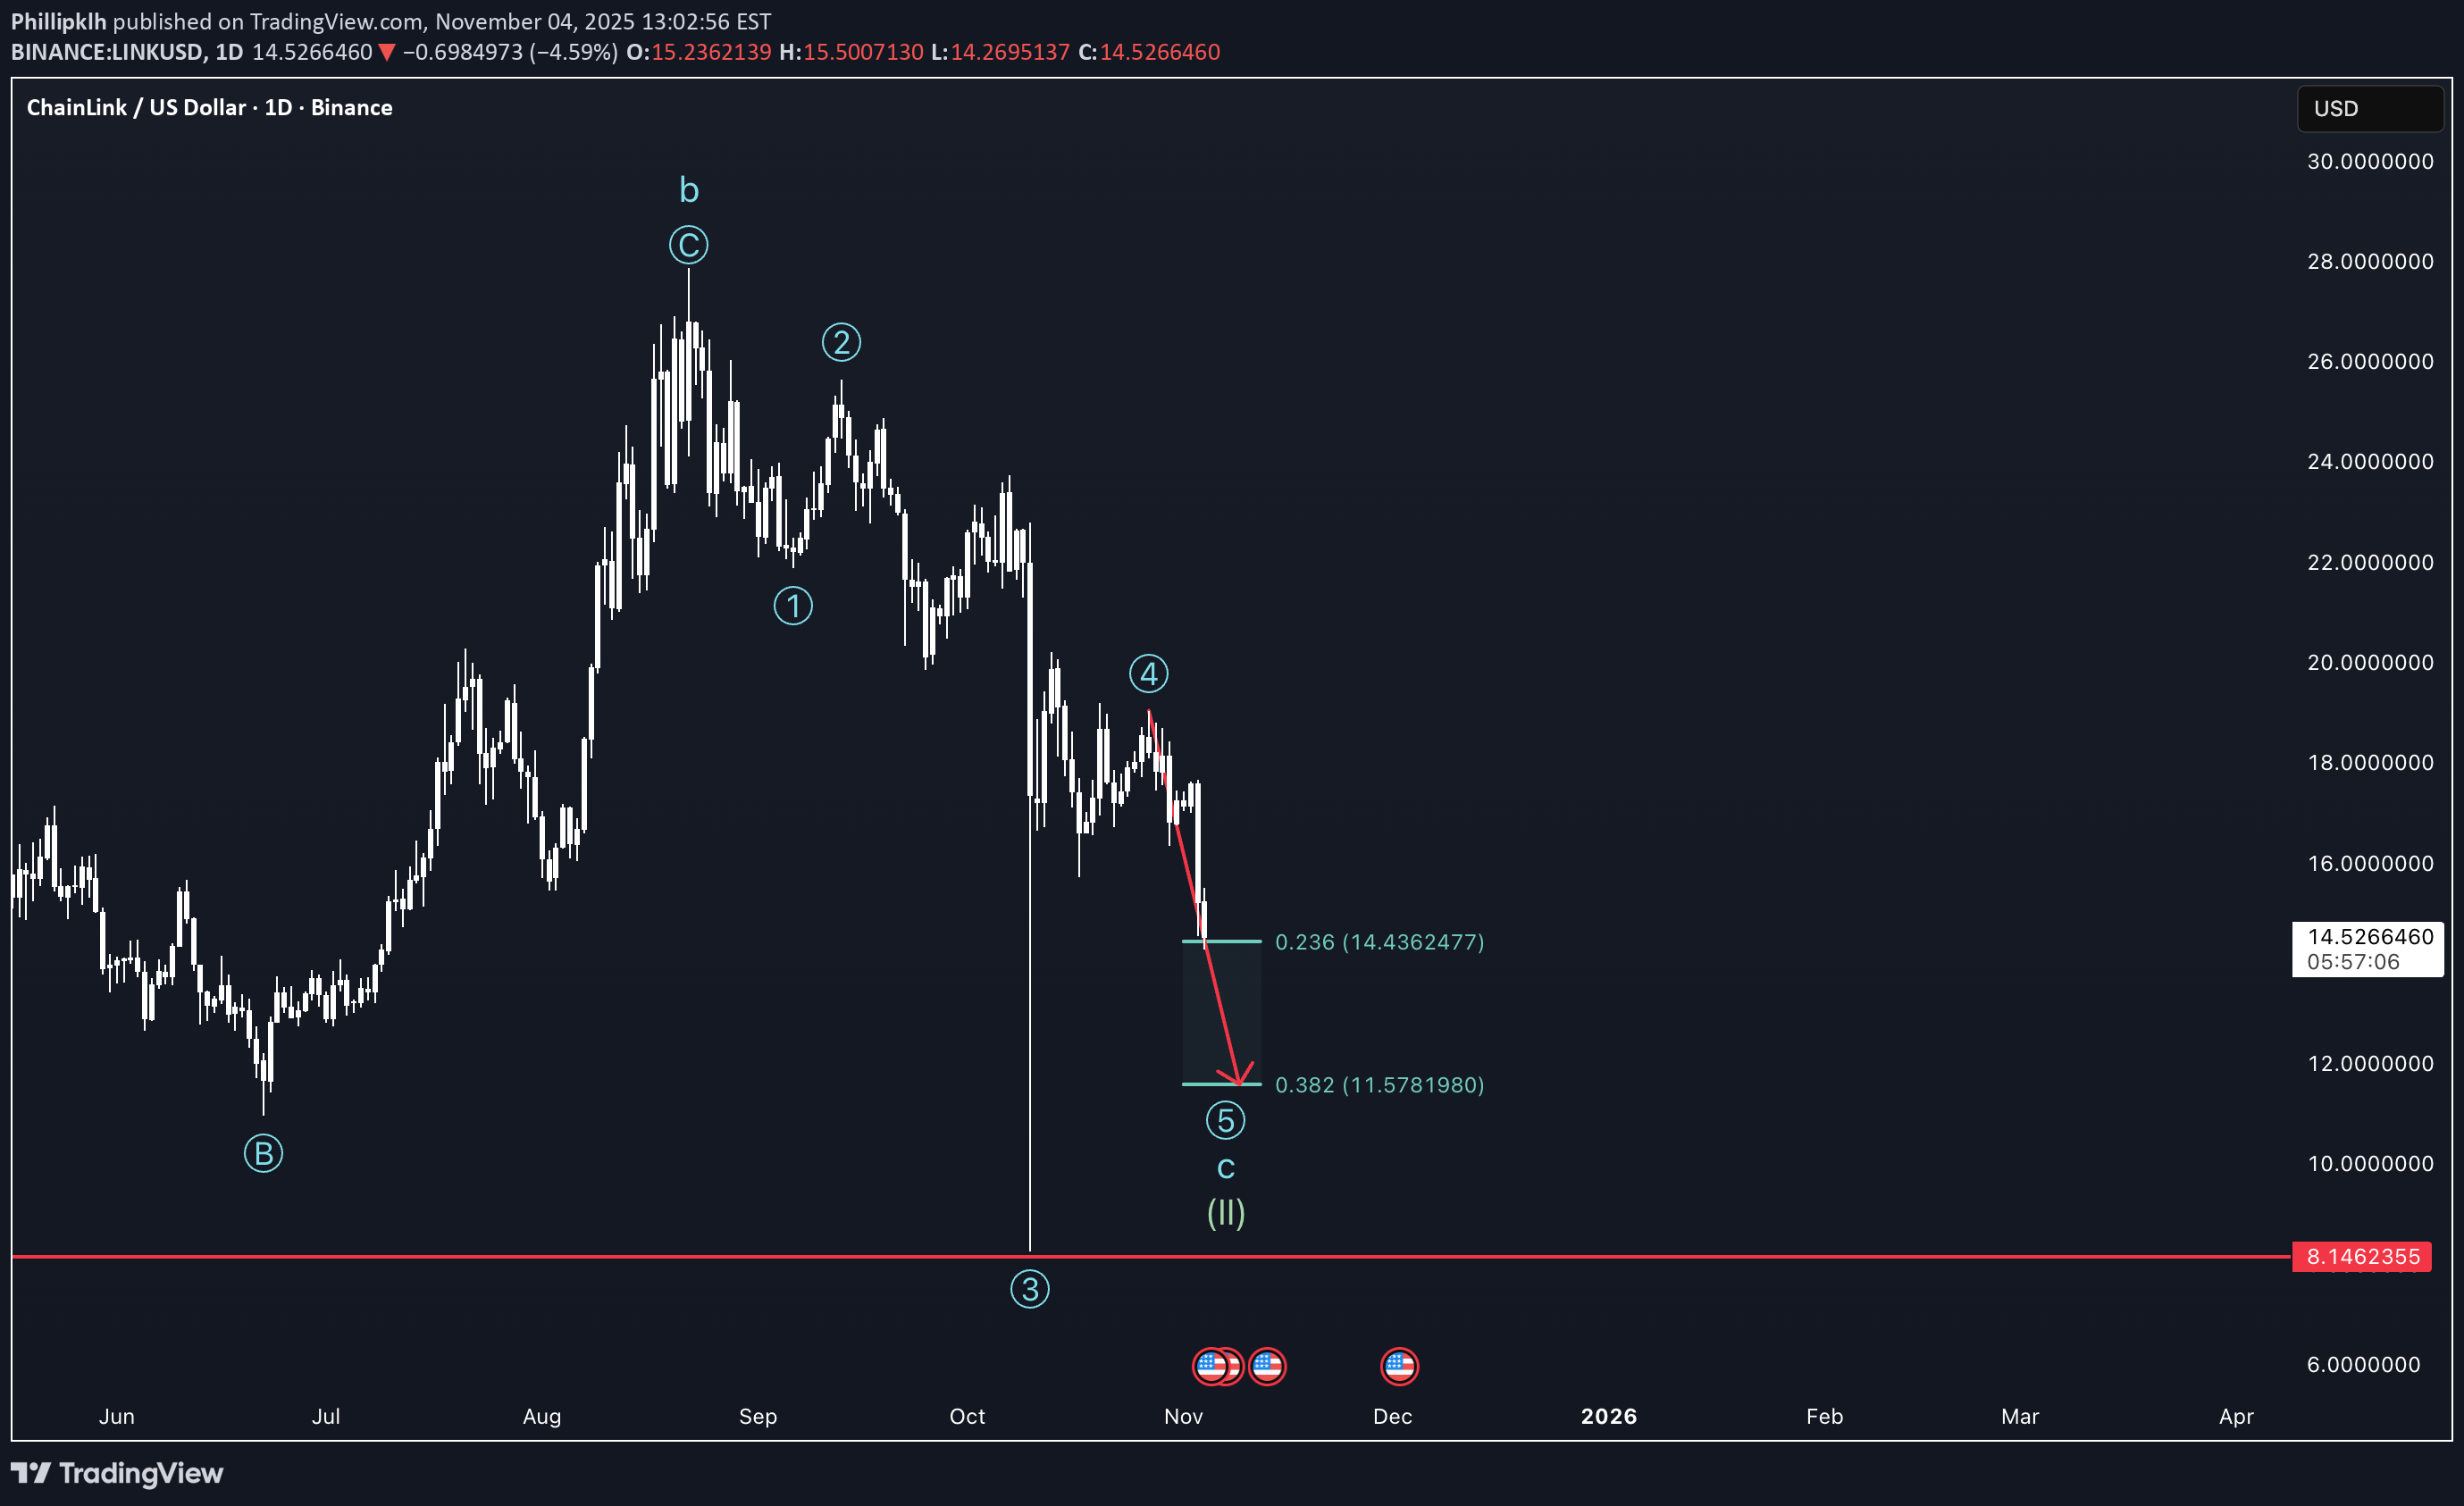
After an astronomical gym session, I am now happy to review Chainlink to you! Due to a negative macro outlook short-term, Altcoins and Bitcoin dropped in the beginning of the week and will be dropping further throughout the week. Looking at the structure I am considering the current movement to be part of a larger correction of the supercycle wave 2, were we are internally at the wave c on the cycle and in the fifth wave in the primary cycle. For now we technically reached the first price target for short fifth waves, but since I expect Ethereum to also go down I believe we are gonna drop to the 0.382 extension level of the fifth wave, at $11.57. On the way there we are going to fill a lot of orders as the orderbook shows a lot of them, also at the price target. As we go down I do not recommend opening short positions because a lot of people will call Altcoins and the Alt-Season dead, leading to a lot of shorts and a gradually increasing chance of short-squeezes. The bottom could be in if funding rates on the daily turn negative, and RSI enters oversold areas on the 2 week chart. This thesis also gets supported by the VIX, which is rising and therefore indicates a risk off sentiment and the USDT dominance chart as it rises also and gets near the top. I urgently need to point out that at this point an ending of the downtrend gets more possible the lower we fall. Buying here is a great opportunity and the lower we get the more the effect of dollar cost averaging comes into play.
Phillipklh
بیت کوین هفته آینده به کجا میرود؟ پیشبینی صعودی تا ۱۱۷ هزار دلار؟
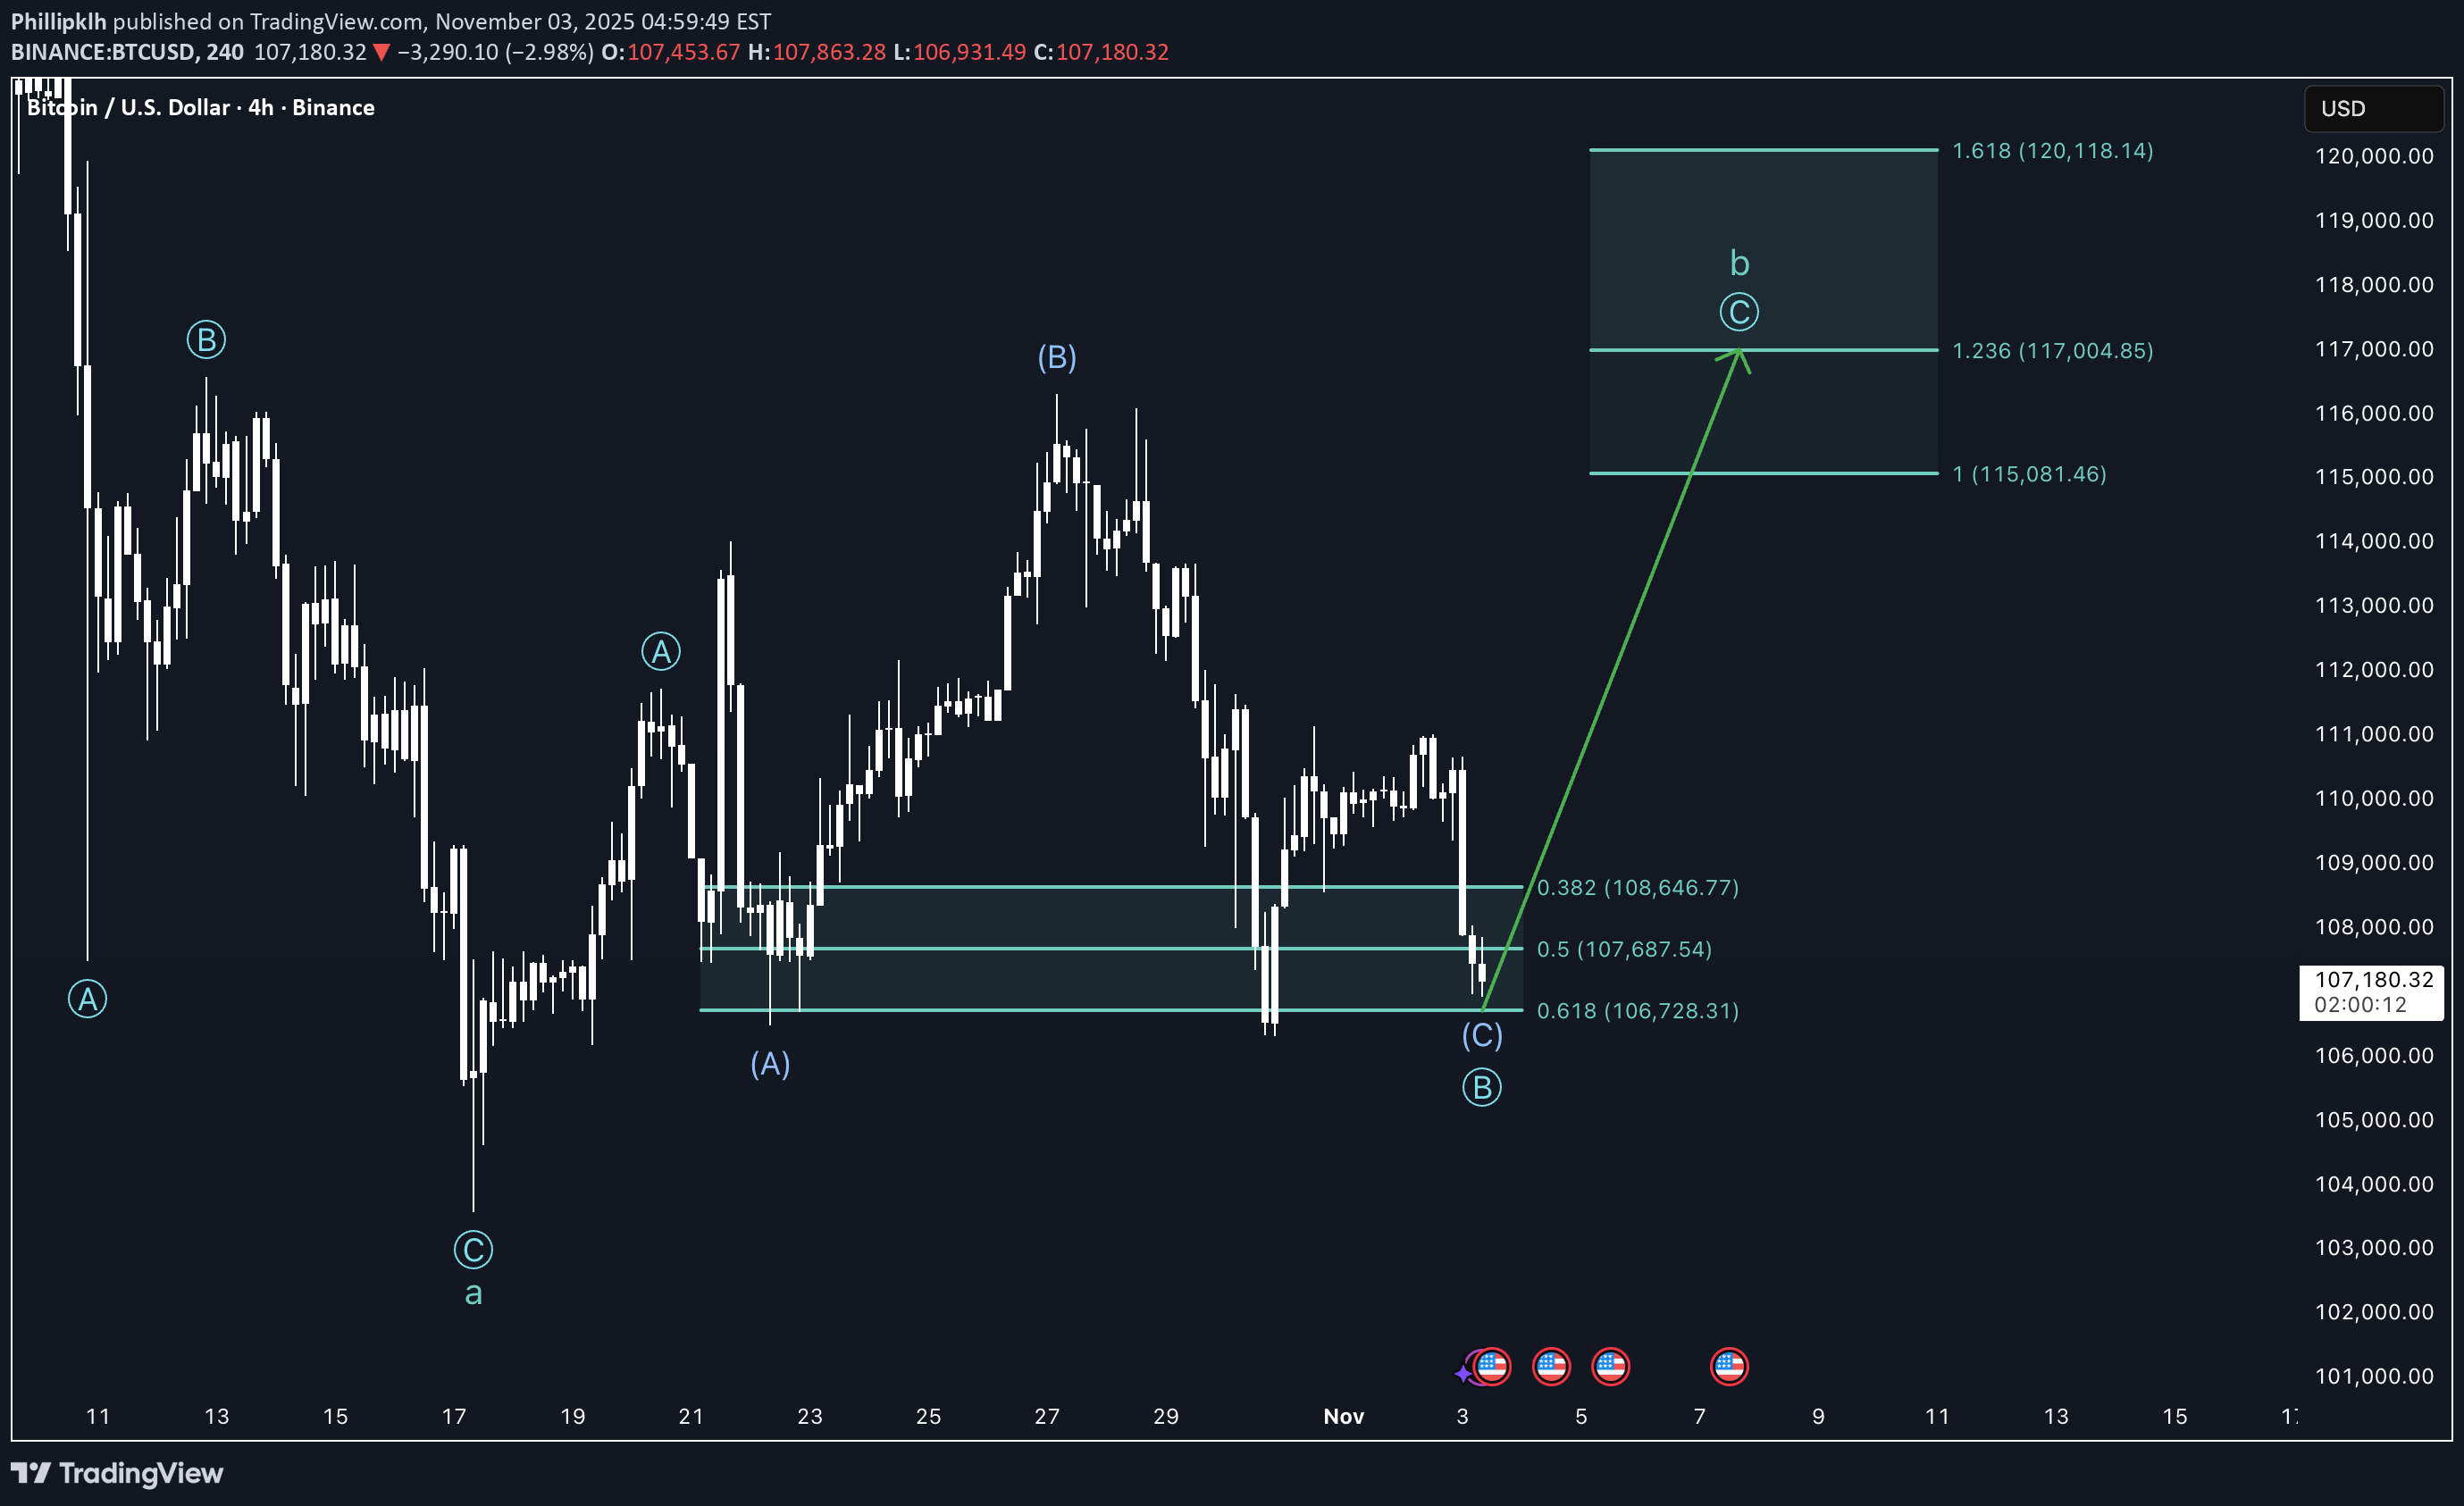
Bitcoin shows a pretty similar structure to the alts, just in another context. The overall picture is that we are now in a larger corrective movement where we could drop to 40k again. The structure in the lower timeframes, as shown on the chart, show that a short-term rise is possible in the next days and weeks. Over the past week and the drop today we completed the flat pattern of the primary wave B with the completion of the intermediate wave C. For now therefore I expect the Bitcoin to perform a turn and a rise to the fibonacci extension levels shown on the chart. This scenario is supported by the correlation with other coins, the liquidation heatmap showing a bunch of liquidity above the current price and funding rates being lower than normal. RSI shows itself also near the oversold range and MACD turned only slightly negative during this drop. Overall this shows us a good environment to rise to 117k. Alternatively a further drop below the low of the intermediate wave A would be possible, but as fibonacci levels of the elliott wave principle do not support these deep niveaus anymore, I think a turn is probable.
Phillipklh
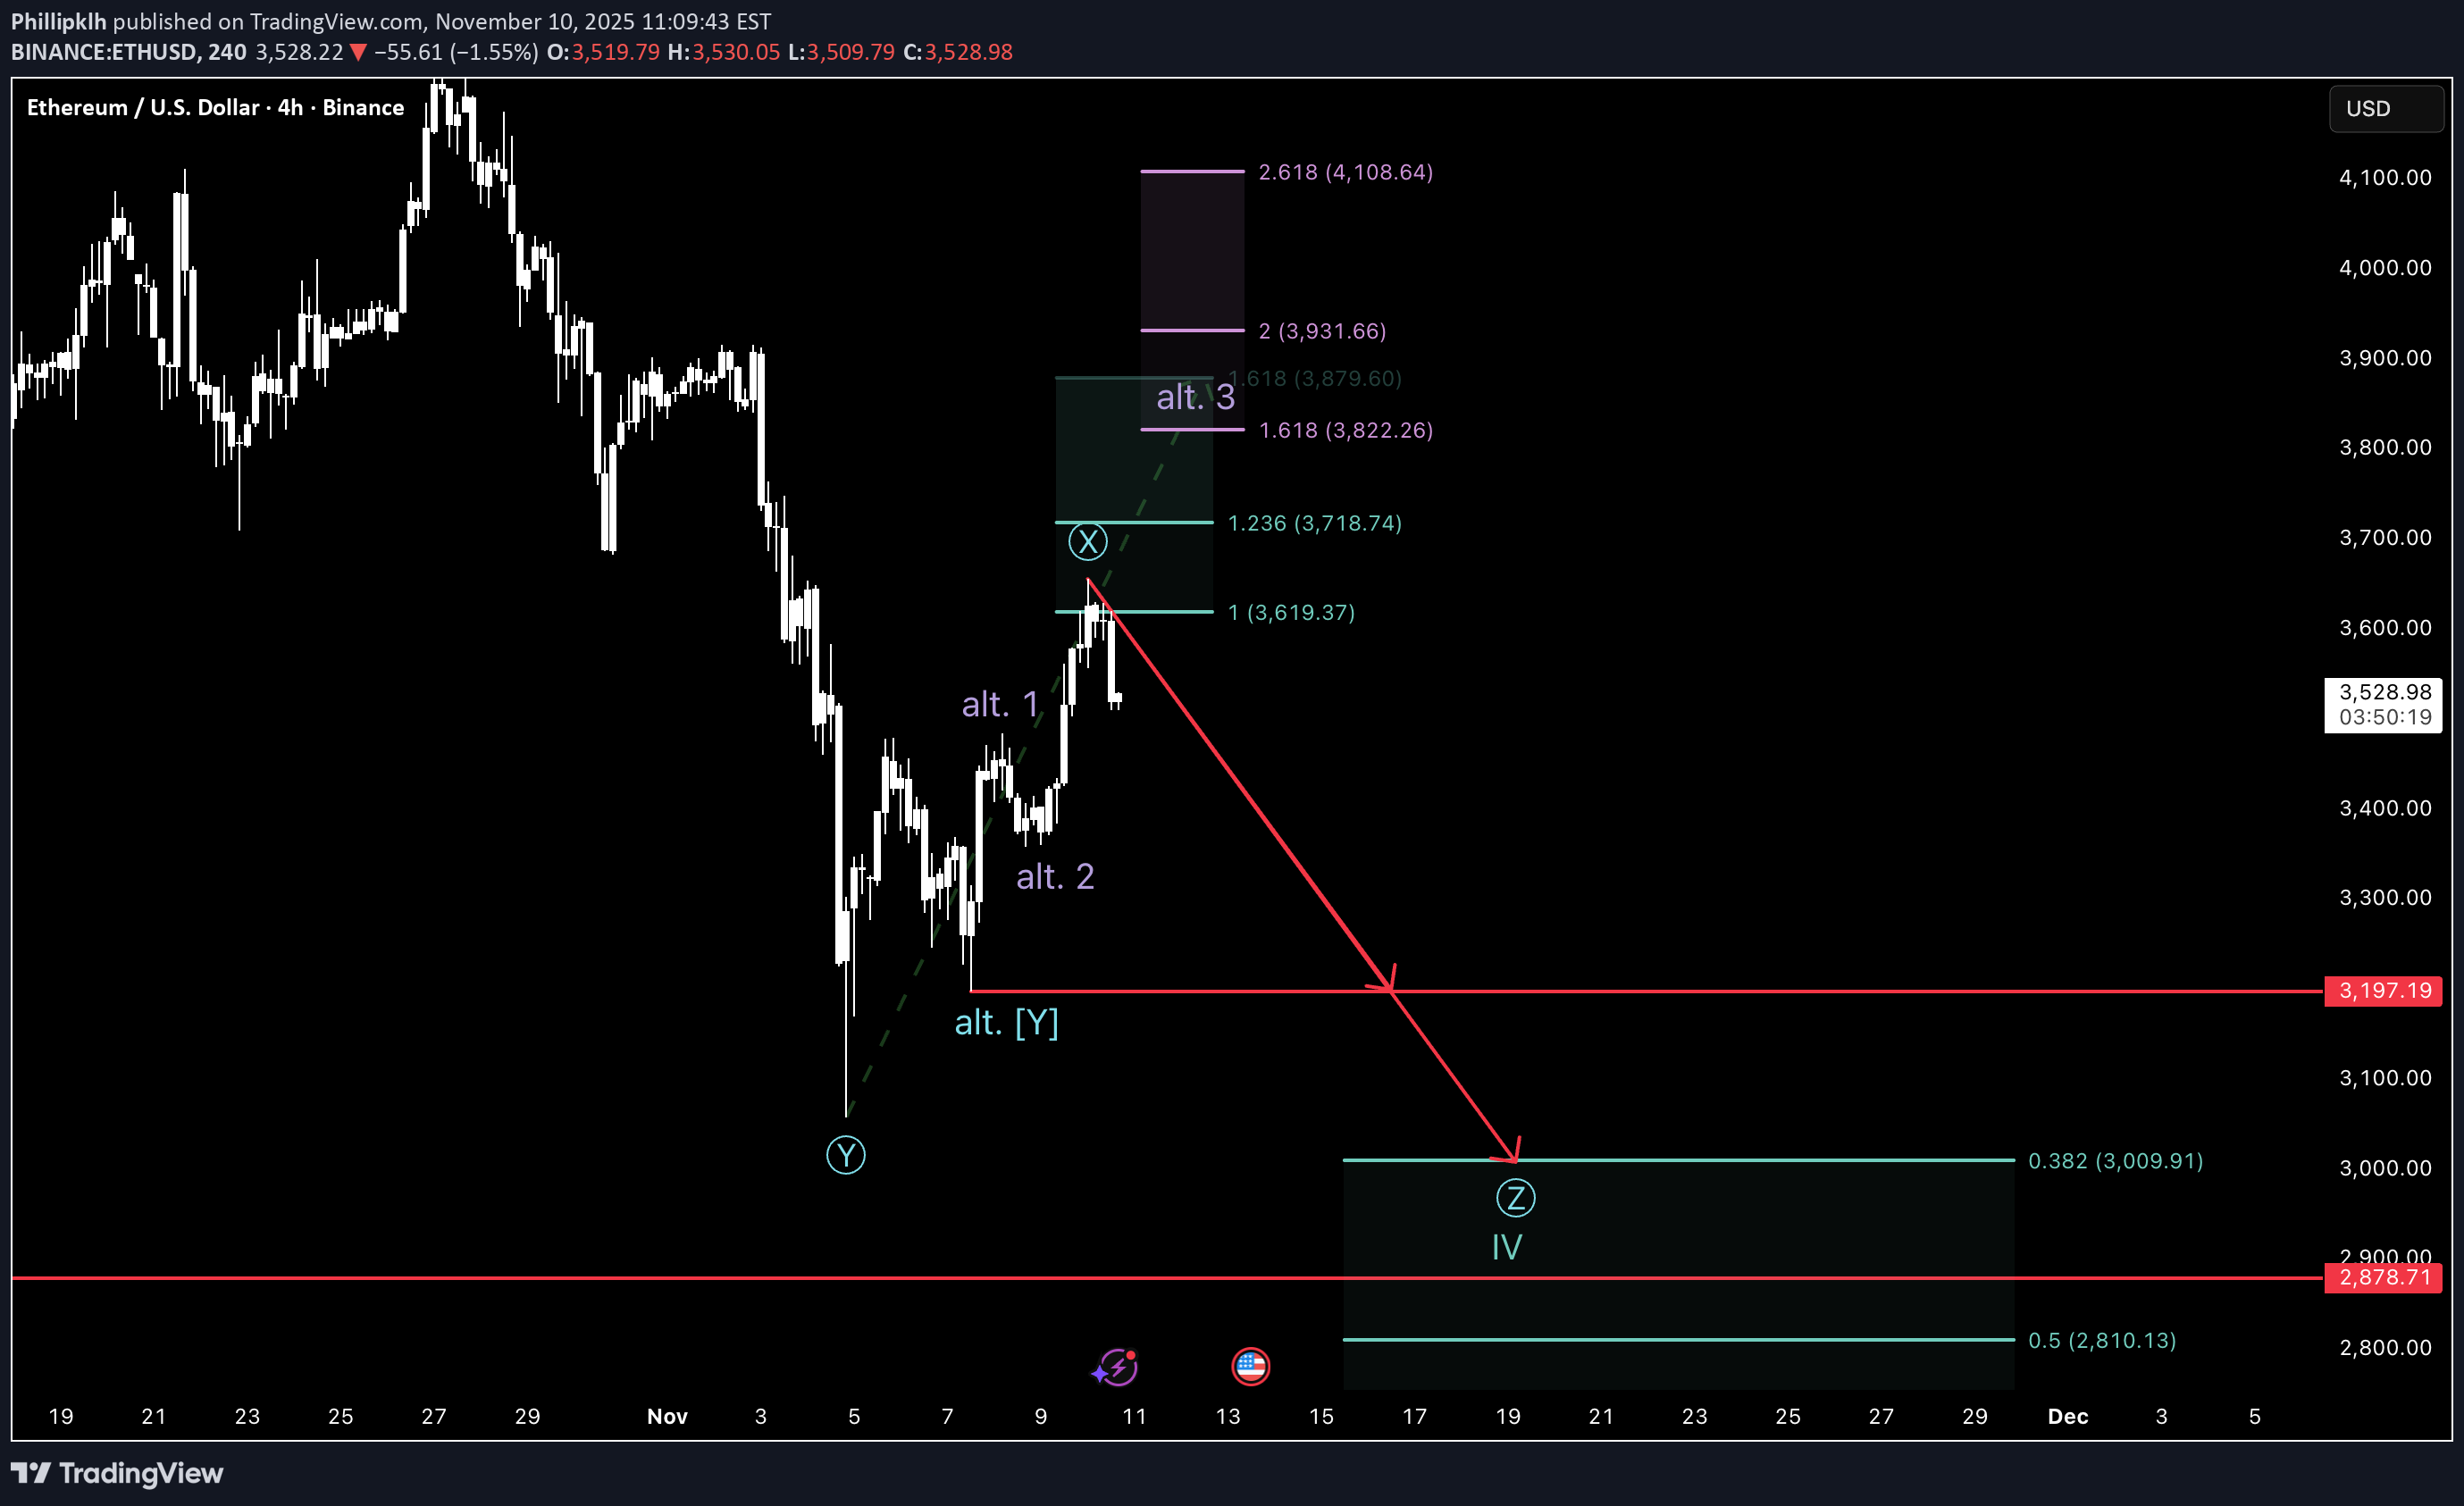
تحلیل هفتگی اتریوم (۳ تا ۹ نوامبر): ریزش ناگهانی، چرا یک سیگنال صعودی بزرگ است؟
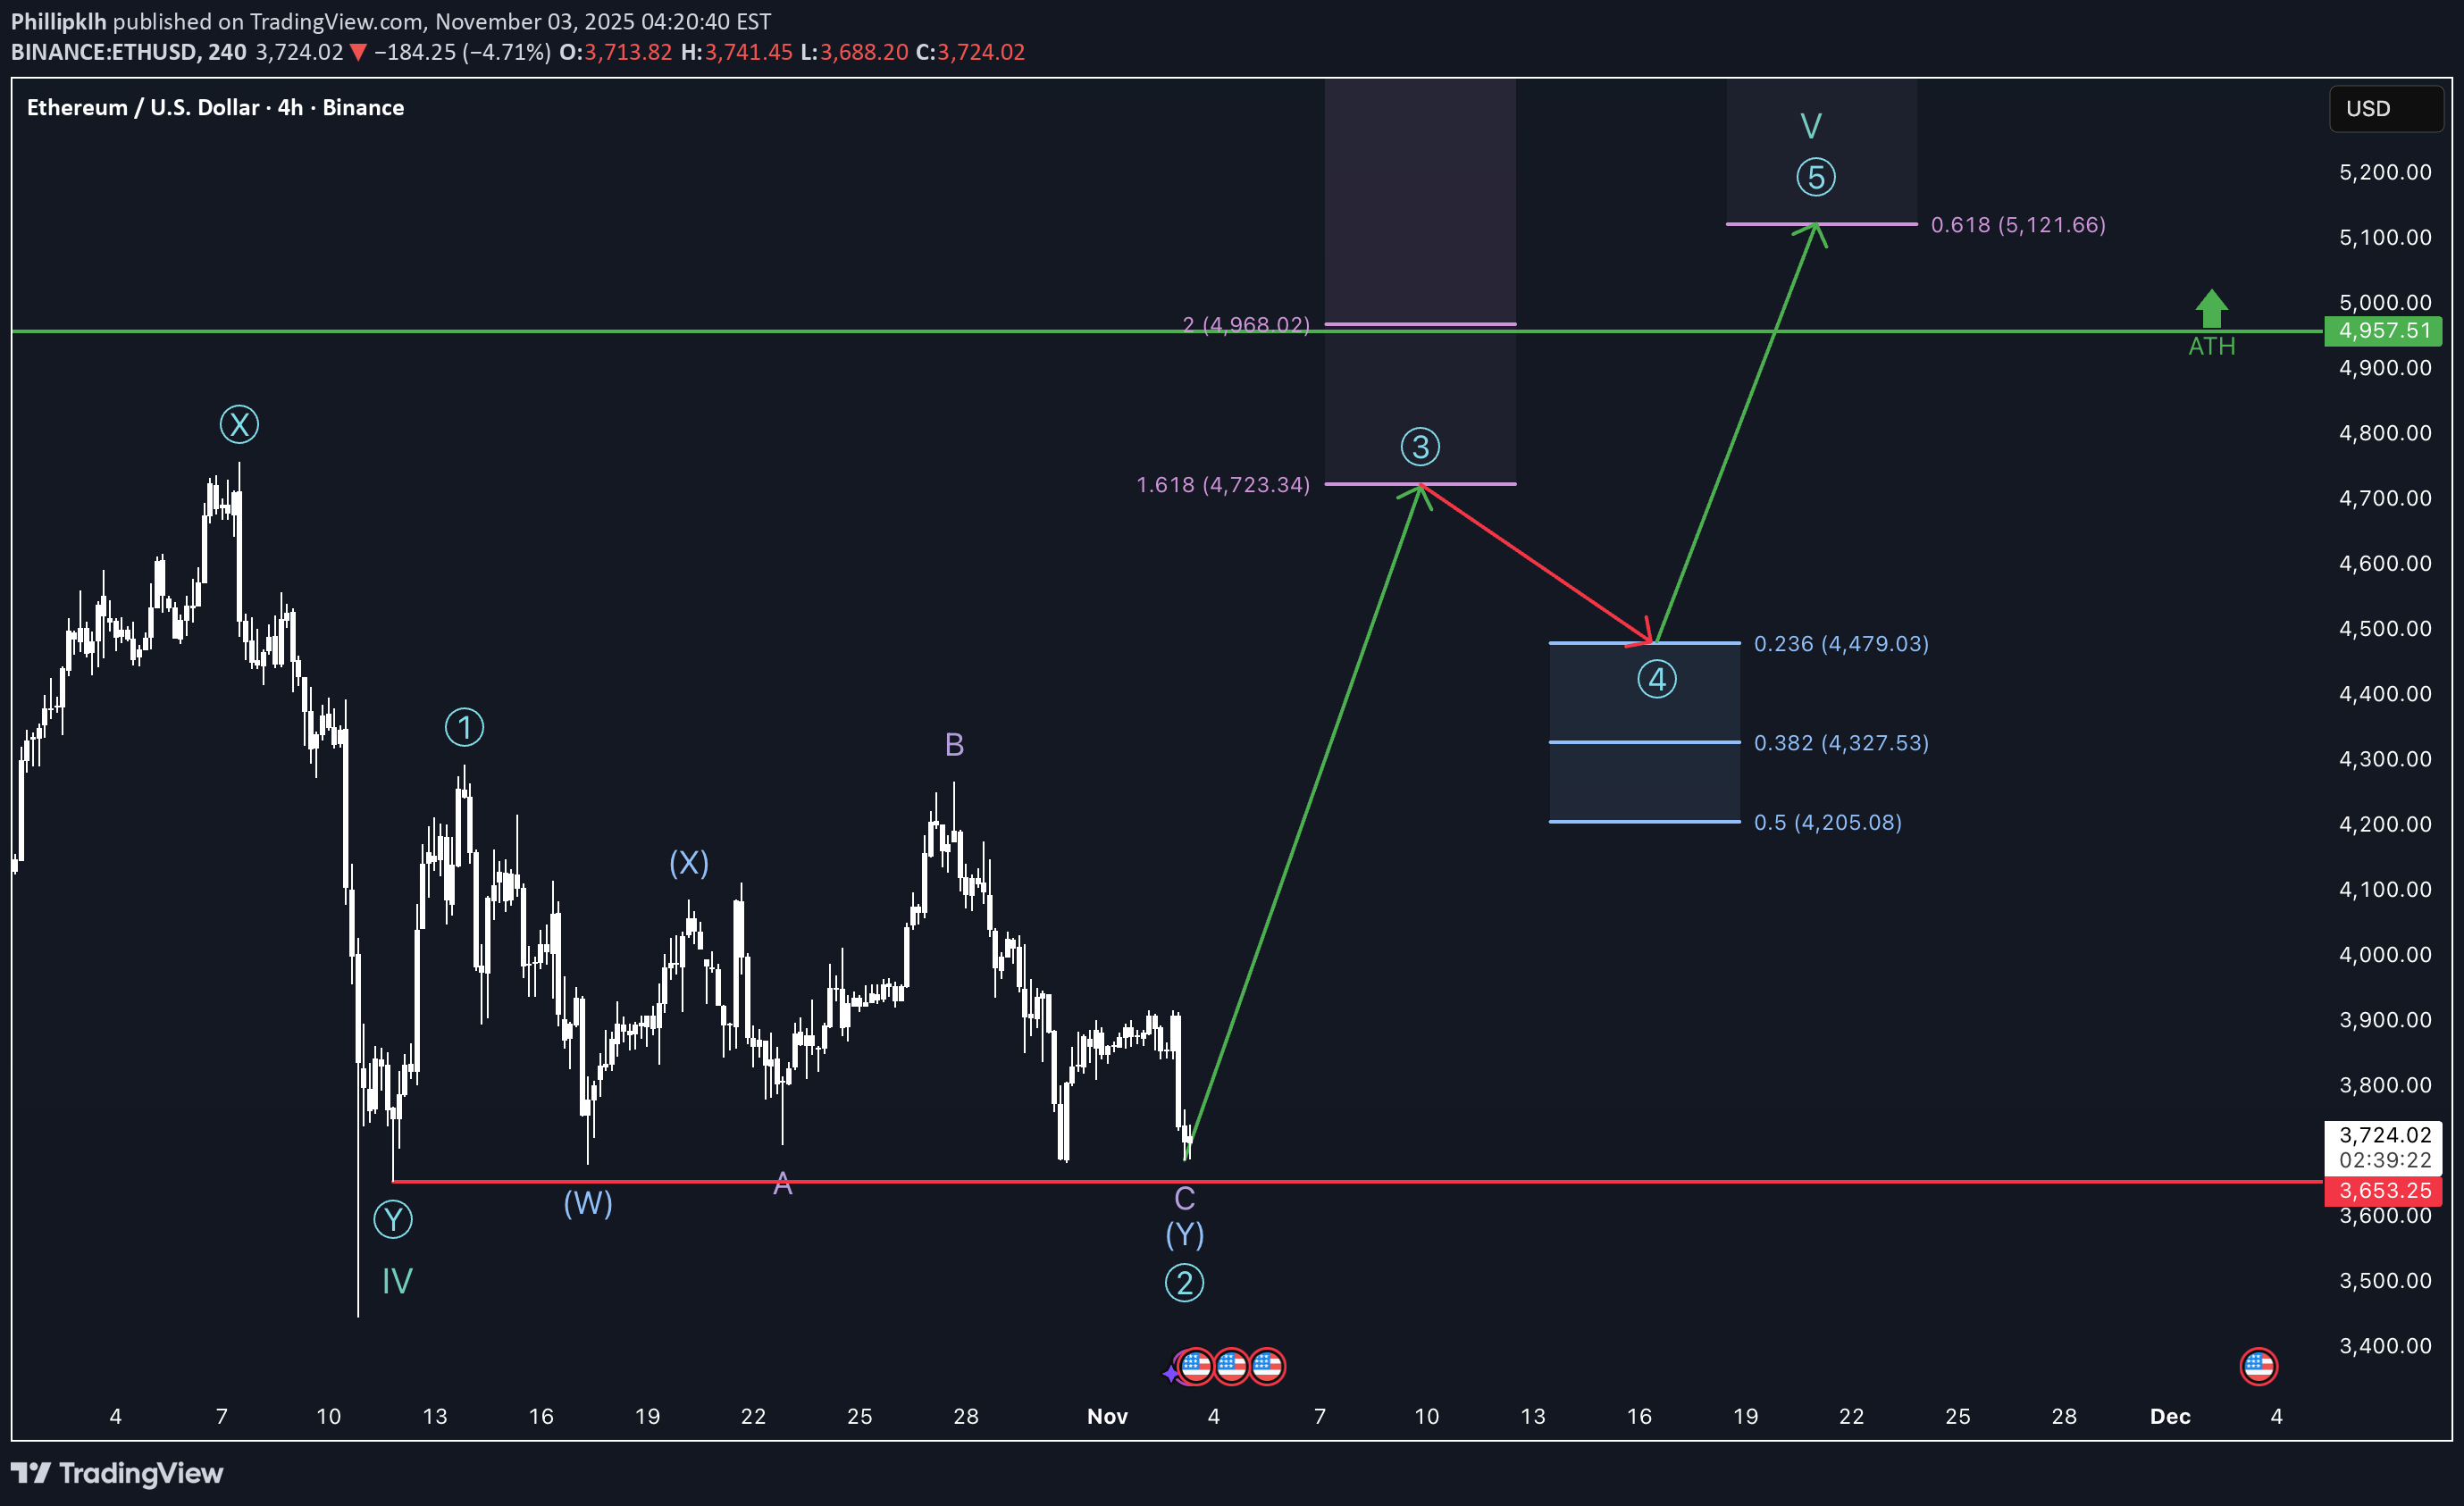
The weekend was pretty quiet as usual and the week starts with a 5% crash basically out of nowhere. Taking a closer look at the current structure it is clear that this drop was necessary to complete the flat structure of the intermediate wave Y. And this, ladies and gentleman, is very bullish. Let's see: As I mentioned, the current drop completed the minor wave C and with that the intermediate wave Y. In this case, the primary wave 2 should also be done, leading to a now starting primary wave 3. For this third wave I currently put the most conservative scenario on the chart, as any other anticipation would be pure gambling. Alternatively, if we drop below the red market low of the first primary wave, the whole current structure would be corrective and we could drop a lot further. I am not going to investigate this scenario any further because the structure of the primary first wave is more than clear and other on-chain insights and indicators look bullish. The third alternative would be that this current corrective pattern is going to continue and would form a WXYXZ pattern in the intermediate cycle. That scenario depends on the impulsiveness of the anticipated move up. Indicators show themselves bullish, as RSI turned low right on the edge to the oversold range again. Additionally the MACD recovered and a squeeze is active. Funding rates turned negative during this drop which is also bullish and a lot of positions got liquidated suggesting a clear environment to rise again. The liquidation heatmap currently only shows liquidity above the current price, being also bullish. ETF flows are currently still negative and grayscale is distributing a lot of their Ethereum, probably because the ETF shows outflows. Blackrock's token balance is currently consolidating with them buying and selling multiple times a week with multi-millions. Bitmine is still accumulating with Tom Lee believing strongly in Ethereum and stating they will buy more. Overall I am positioning myself long again with stop loss at the red market low and take profit at the fist anticipated target for primary wave 3.
Phillipklh
سولانا در آستانه انفجار قیمتی: سیگنال ورود کوتاه مدت (تحلیل هفتگی ۲۸ اکتبر - ۳ نوامبر)
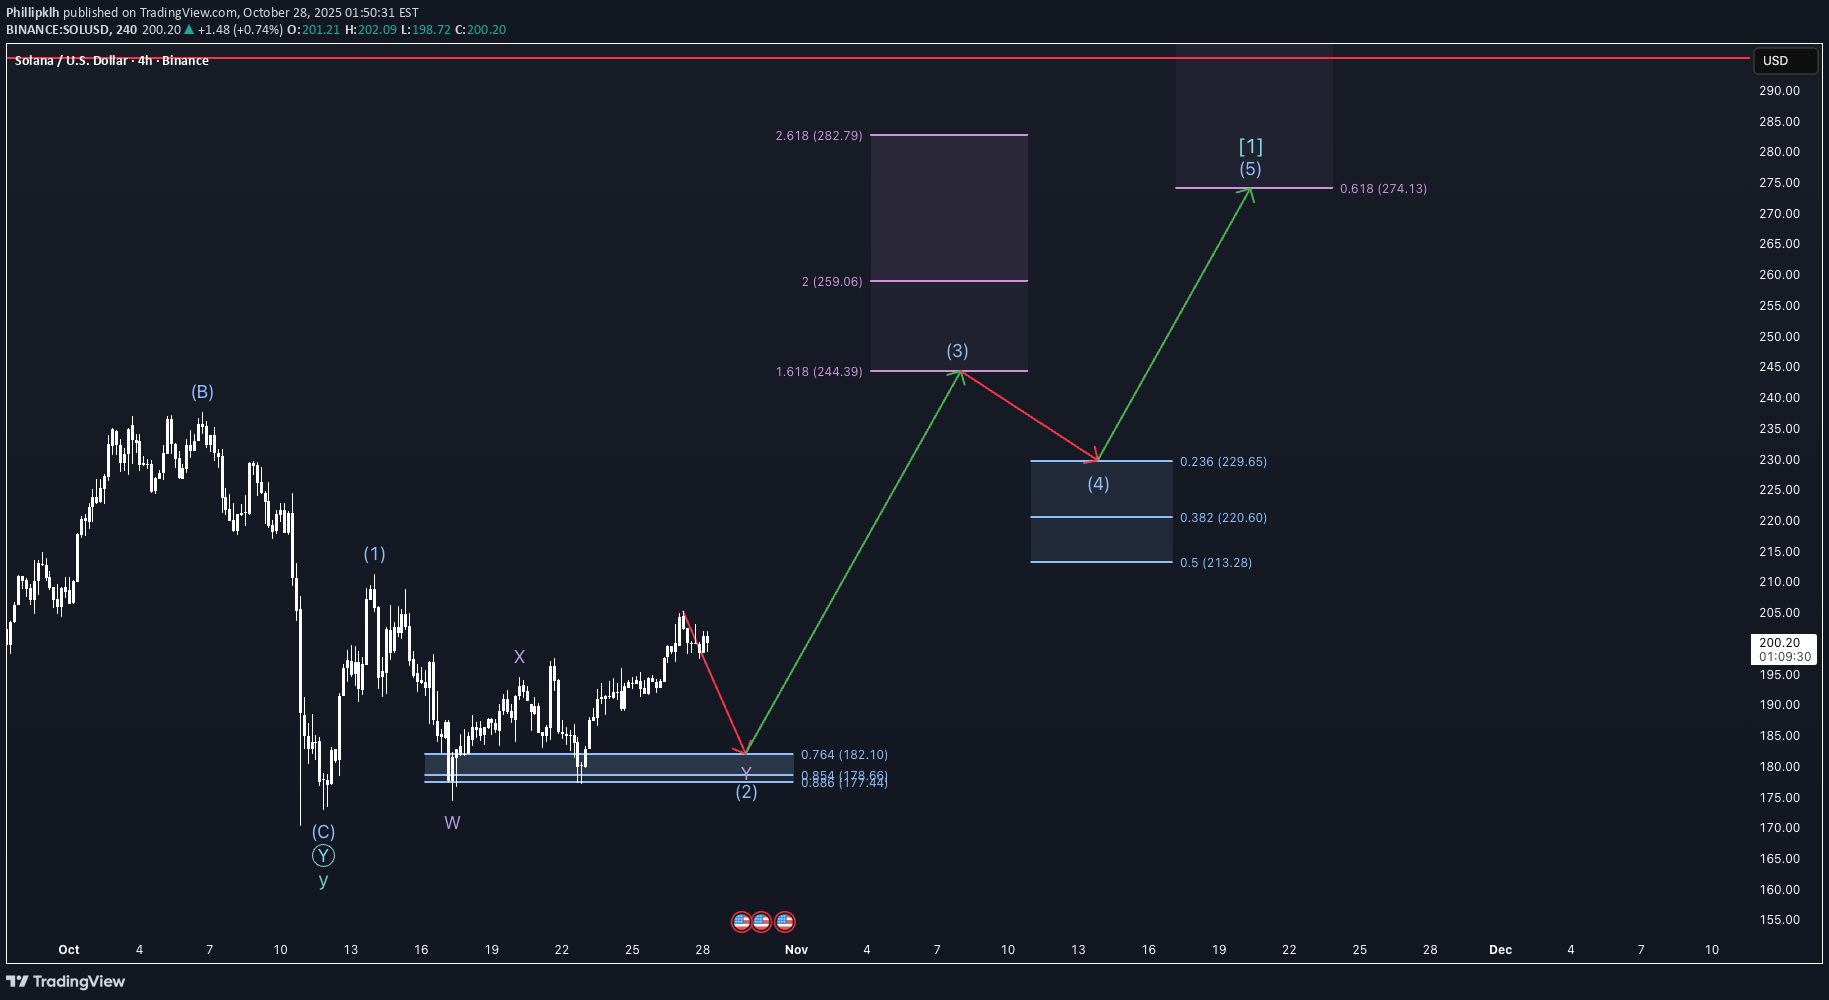
After a pretty enduring phase of complex corrective movement, Solana presents itself with impulsive bullish structure today. As I said in my Ethereum analysis, the macro environment seems to be very bullish with rate cuts and a tariff deal between the United States and China may be incoming. So with that said, I think the upside opportunity in mid- to long-term could be large. But for short-term, the current market structure looks similar to Ethereum as we are unfolding a rather complex intermediate wave 2. For now therefore, I expect Solana to drop to around $182.10. This scenario is supported by the liquidation heatmap as it shows liquidity built up throughout the latest move up. Indicators like the RSI already showed overbought prices by the end of the move up, which is untypical early for a starting third wave. Not to forget the overall structure being rather slow whilst moving up, which also doesn't fit in the impulsive characteristics of the third wave. So the alternative would be, that this is the third wave, but as I said I think this is very unlikely for me. Overall Solana provides us a short setup. If you want to take that trade I recommend putting the stop loss at the latest local high or one percent above if you want to be sure and the take profit at the 0.764 retracement level.
Phillipklh
تحلیل هفتگی اتریوم: فرصت فروش در مقابل پامپ قیمت (۲۷ اکتبر - ۲ نوامبر)
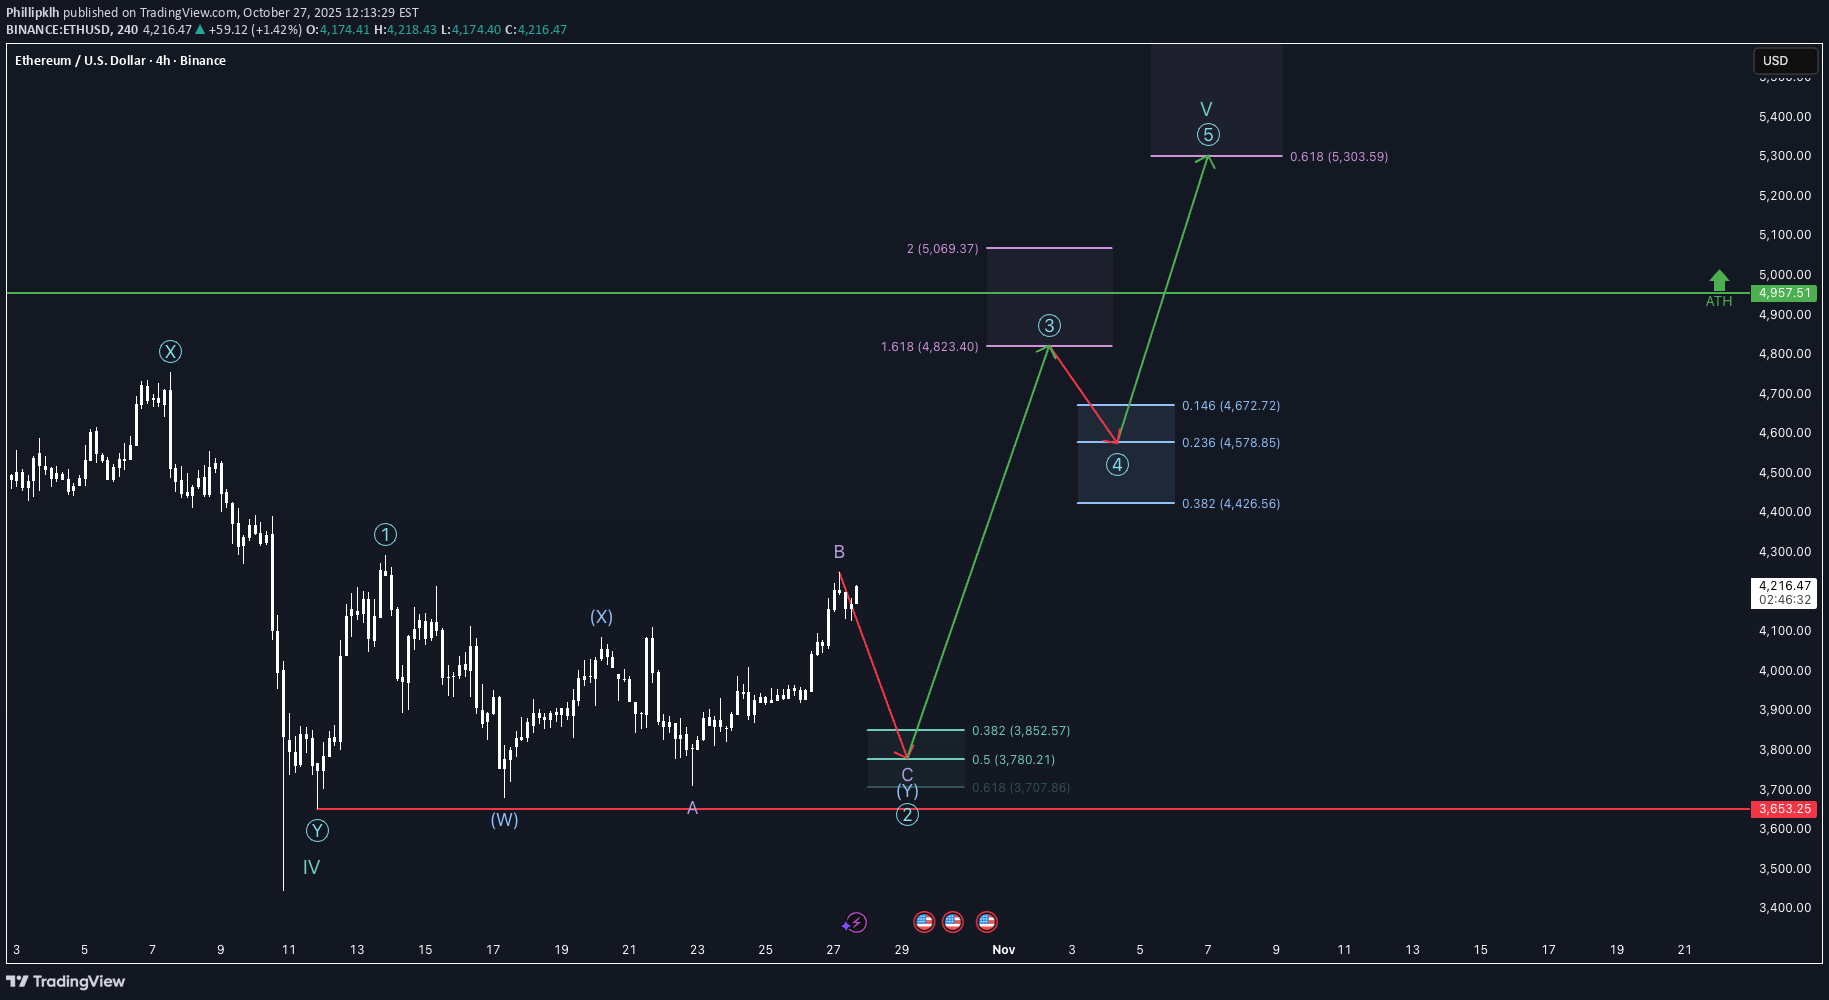
Dear traders and investors, I firstly want to mention that everyone who took that last weeks trade, it is now time to close it or, if you want to take on more risk, you can hold through the next descending phase where you could get stopped out. But lets get into the analysis. As I mentioned in todays Bitcoin analysis, the macro environment is currently bullish. We have a rate cut coming in on Wednesday with a high probability and lower than expected CPI on last Friday, leading to Powell being rather dovish than hawkish but still cautious. Trump is also signaling a tariff deal with China may be coming in soon. I do think this also has to do with his ambitions to lower the rates and tariffs may impact the inflation so he avoids more uncertainty. Looking at the money flows, ETFs are receiving and inflows are looking like they are topping out right now. I think this is a typical behavior for a fifth wave, as institutionals are backing of from the market and using the late retailers as exit liquidity. Moving on to market structure, it seems to be likely that this pump on Sunday was rather a overshooting wave B, than a actual impulsive move of the third wave. There is just to much lethargic in this move. In addition to that, funding rates rose to higher-than-normal highs and there is a bunch of liquidity forming under the current price. Therefore, the odds for longs getting liquidated rise. Alternatively, this is actually the third wave. If so, Ethereum should pump further without hesitation within the next few candles. All in all, I would favor a short postion with stop loss at the high of the minor wave B or one percent above and the take profit at the 0.5 fibonacci extension level. This scenario is also in favored by Bitcoin, as I also anticipate a short-term drop. nonetheless be careful with short positions, we are in a bull market, the upside is overall in favor and shorts being liquidated is really easy right now. For people who look for a opportunity to buy in, the extension levels are all a good trade with stop loss at the low of the primary wave Y and take profit at the anticipated third wave or fifth wave high. I hope i was able to give some value, have an exceptional successful week!Also, if the current move is already the third wave, we should break the high of the first wave very soon sustainably.Nice one!
Phillipklh
تحلیل بیت کوین: آیا ریزش در راه است؟ پیشبینی هفتگی (۲۷ اکتبر - ۲ نوامبر)
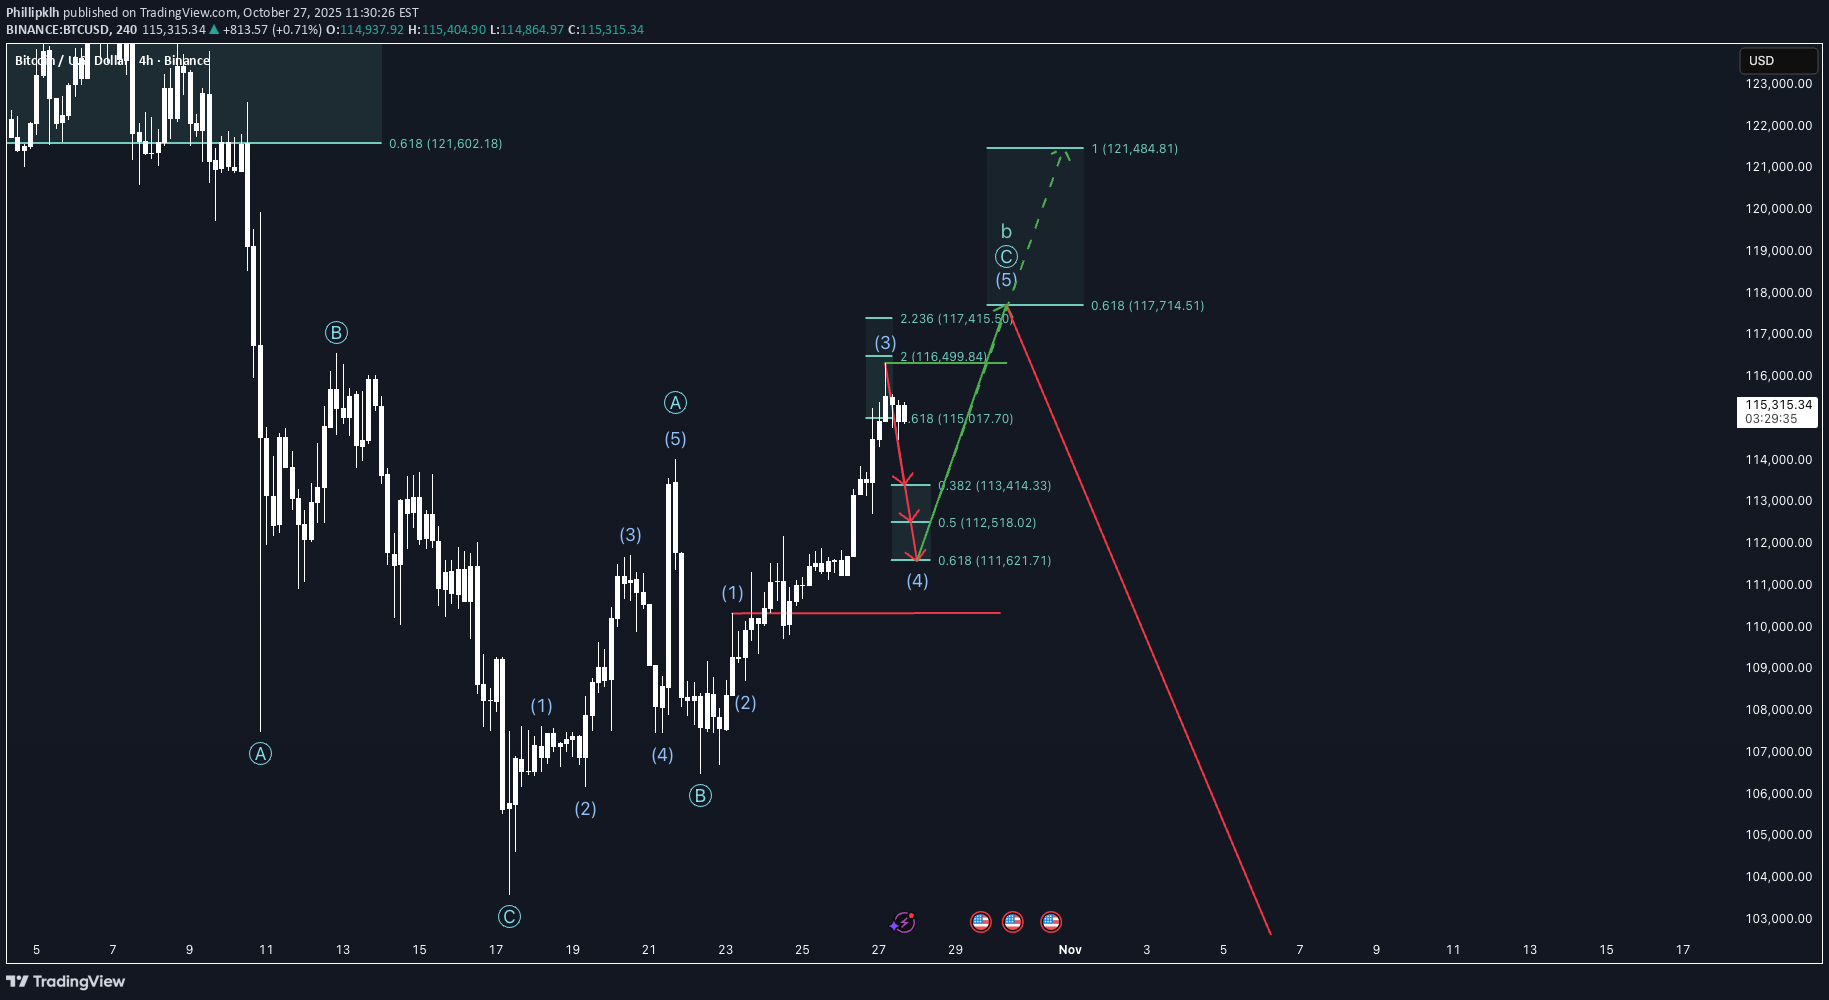
Ladies and Gentleman, I haven't looked at Bitcoin for a while because I prioritized altcoins more but today I want to give you a brief overview what to expect in the future. I also want to mention that my analysis will be available on youtube soon. So first up lets look at this weeks macro events. The week is mostly empty except for Wednesday, expecting us with the Fed rate decision and the following press conference. It is expected for the Fed to lower the rate to 400bps and as CPI came out lower than expected last week I also think Powell is going to be rather dovish than hawkish, highlighting that the fed is watching the current economic situation closely. Another bullish factor right here is that a deal between the United States and China seems to be nearby due to some of Trumps latest statements. In contrast to that, the ETF shows low inflows to actual outflows. The Bitcoin Dominance also stays at around 60% which indicates strength. Nonetheless, the majority of the funds aren't really accumulating more Bitcoins. Maybe they are preparing for the next alt season, as the Fed cuts rates and money becomes cheaper so money flows into more risky assets. The market structure indicates a local top, as we watch an ending intermediate wave 3 and a starting intermediate wave 4. This scenario is also strengthened by a possible reverse head-shoulder formation, which supports the anticipated support levels and also opens up the opportunity for a higher wave 5, as shown on the chart. This scenario is supported by the higher-than-normal funding rates and also higher-than-normal outflows at the top of the third wave indicating retailers trusting more into Bitcoin (exit liquidity). Alternatively, the third wave may not be done and rises a bit higher than now. Important for the confirmation of this alternative scenario is that the high gets broken within the next few candles and the price isn't exploring any of the fibonacci levels. If so, it is pretty clear that we are forming a fourth wave. I expect the fourth wave to drop until the 0.618 retracement, as liquidity lays there. After that it is important to break the local high built out by the third wave and to approach the anticipated niveau. Whilst that, Bitcoin is not allowed to break the high of the first wave (red line), because then this scenario will get invalidated. I do favor short positions right now, but they are also way riskier than long positions so if you enter a short, watch the market very closely. Stop loss for that would be the high of the third wave or, if you want to be sure, one percent above it and several take profits can be set up at the fibonacci retracement levels. Have a great week, I hope I was able to give some value.
Phillipklh
آیا اتریوم به ۵۰۰۰ دلار میرسد؟ تحلیل هفتگی و پیشبینی قیمت ETH
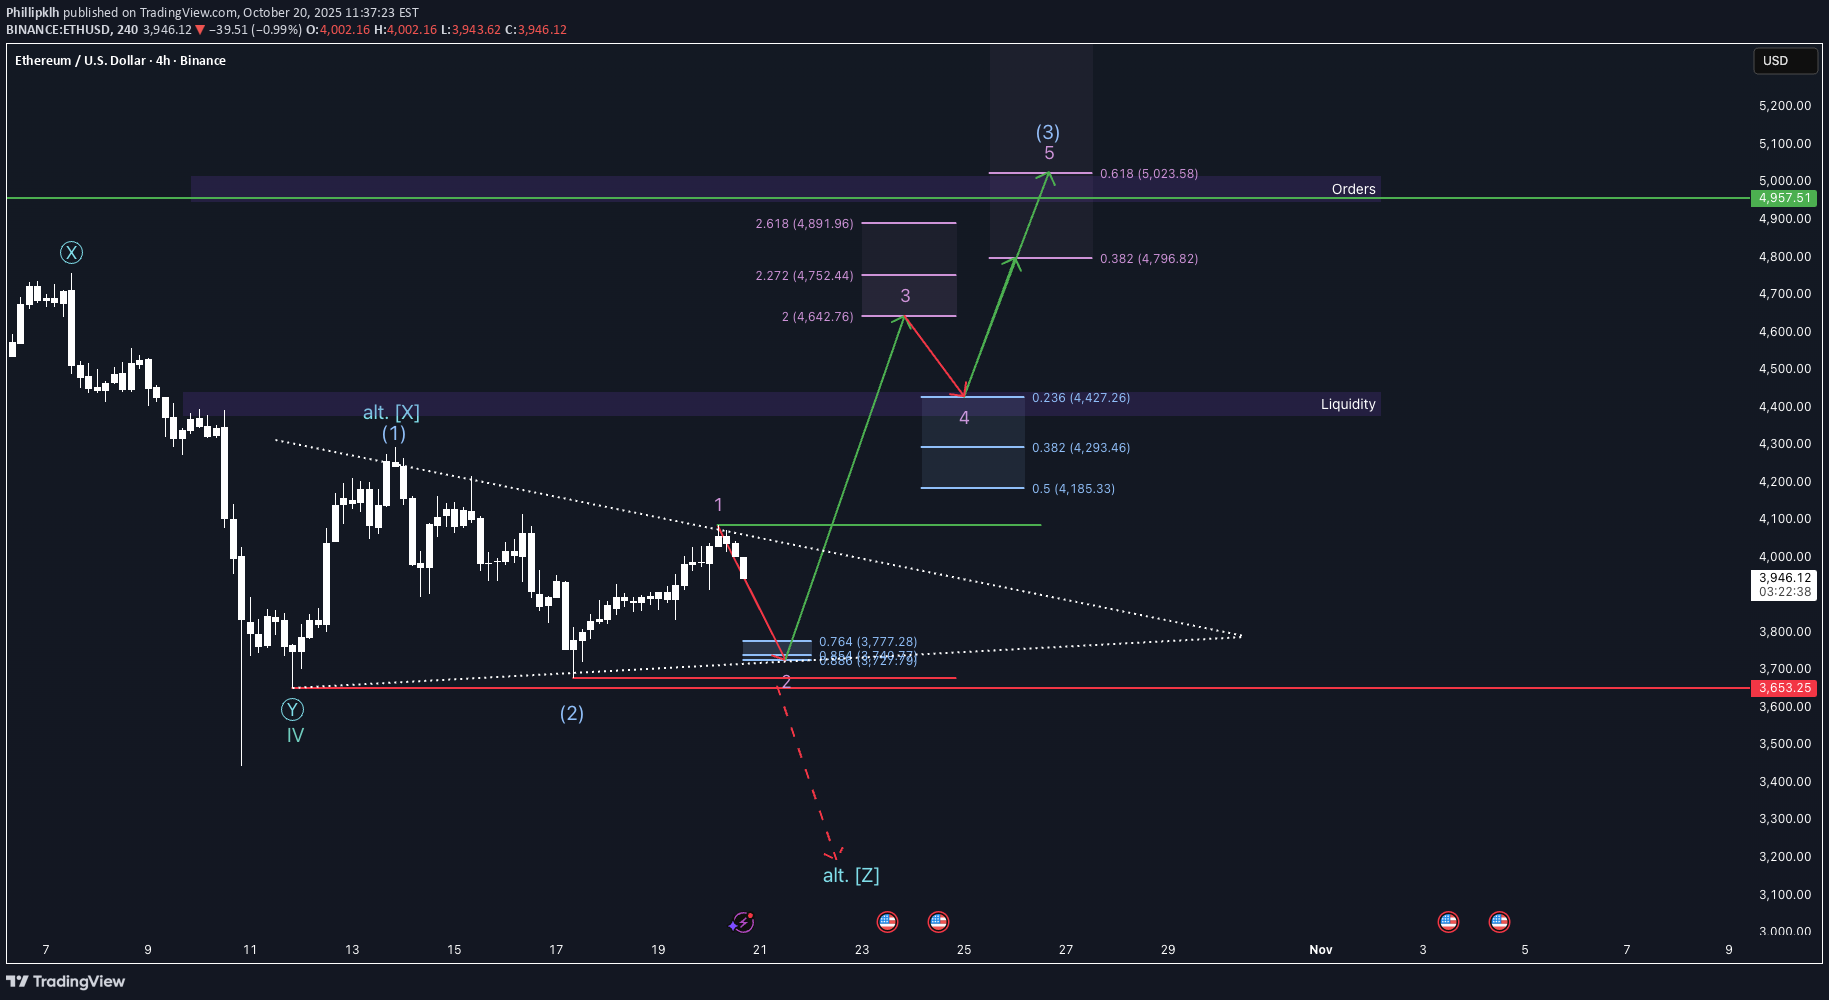
Welcome to my very shortterm analysis on Ethereum. Currently, I think the most probable scenario is that we are in a wave 3 of the intermediate cycle and a wave 2 in the minor cycle. This structure is part of the first wave of the primary cycle. Alternatively, This structure could also potentially be a triple three pattern or a triple three with a triangle as the last pattern, as drawn into the chart. Those two alternatives are not my main scenario, because the structure of the X is clearly a five-parter and no valid pattern has this characteristics. Moving on, as you can see I expect the wave 2 of the minor cycle to be deeper than normal, because Liquidity is sitting just above the start of the minor wave 1 and as second waves in crypto often move a bit further, I do expect them to do that here to. It is only important to keep an eye on the chart, because as Ethereum breaks the low of the minor wave 1, the scenario will be invalidated. As price evolves it is also critical that Ethereum sustainably breaks the high of the minor wave 1. Indicators for the ending of the second wave could be negative or low funding rates, a low RSI and liquidity forming above the first wave's high because traders expect the price to drop further and open leveraged positions. Speaking of liquidity, the ETF shows more outflows than inflows and on-chain data is also showing large funds distributing they're Etehreum. This could also be a part of the fifth and last wave of the cycle, where institutionals sell and the retailers being the exit liquidity. Till next update have a successful week, see ya✌️.Ethereum reached my target for the minor wave 2 perfectly and I recommend buying now with the stop loss at $3680.00 and the take profit at $4519.35, giving us a RR of 4,71. Note: Ethereum is probably going to consolidate in the current area for now. Next weeks FOMC Meeting will bring momentum in it at the weekend or next week.
Phillipklh
بهبودی اتریوم پس از سقوط: تحلیل هفتگی و سناریوی صعود احتمالی!
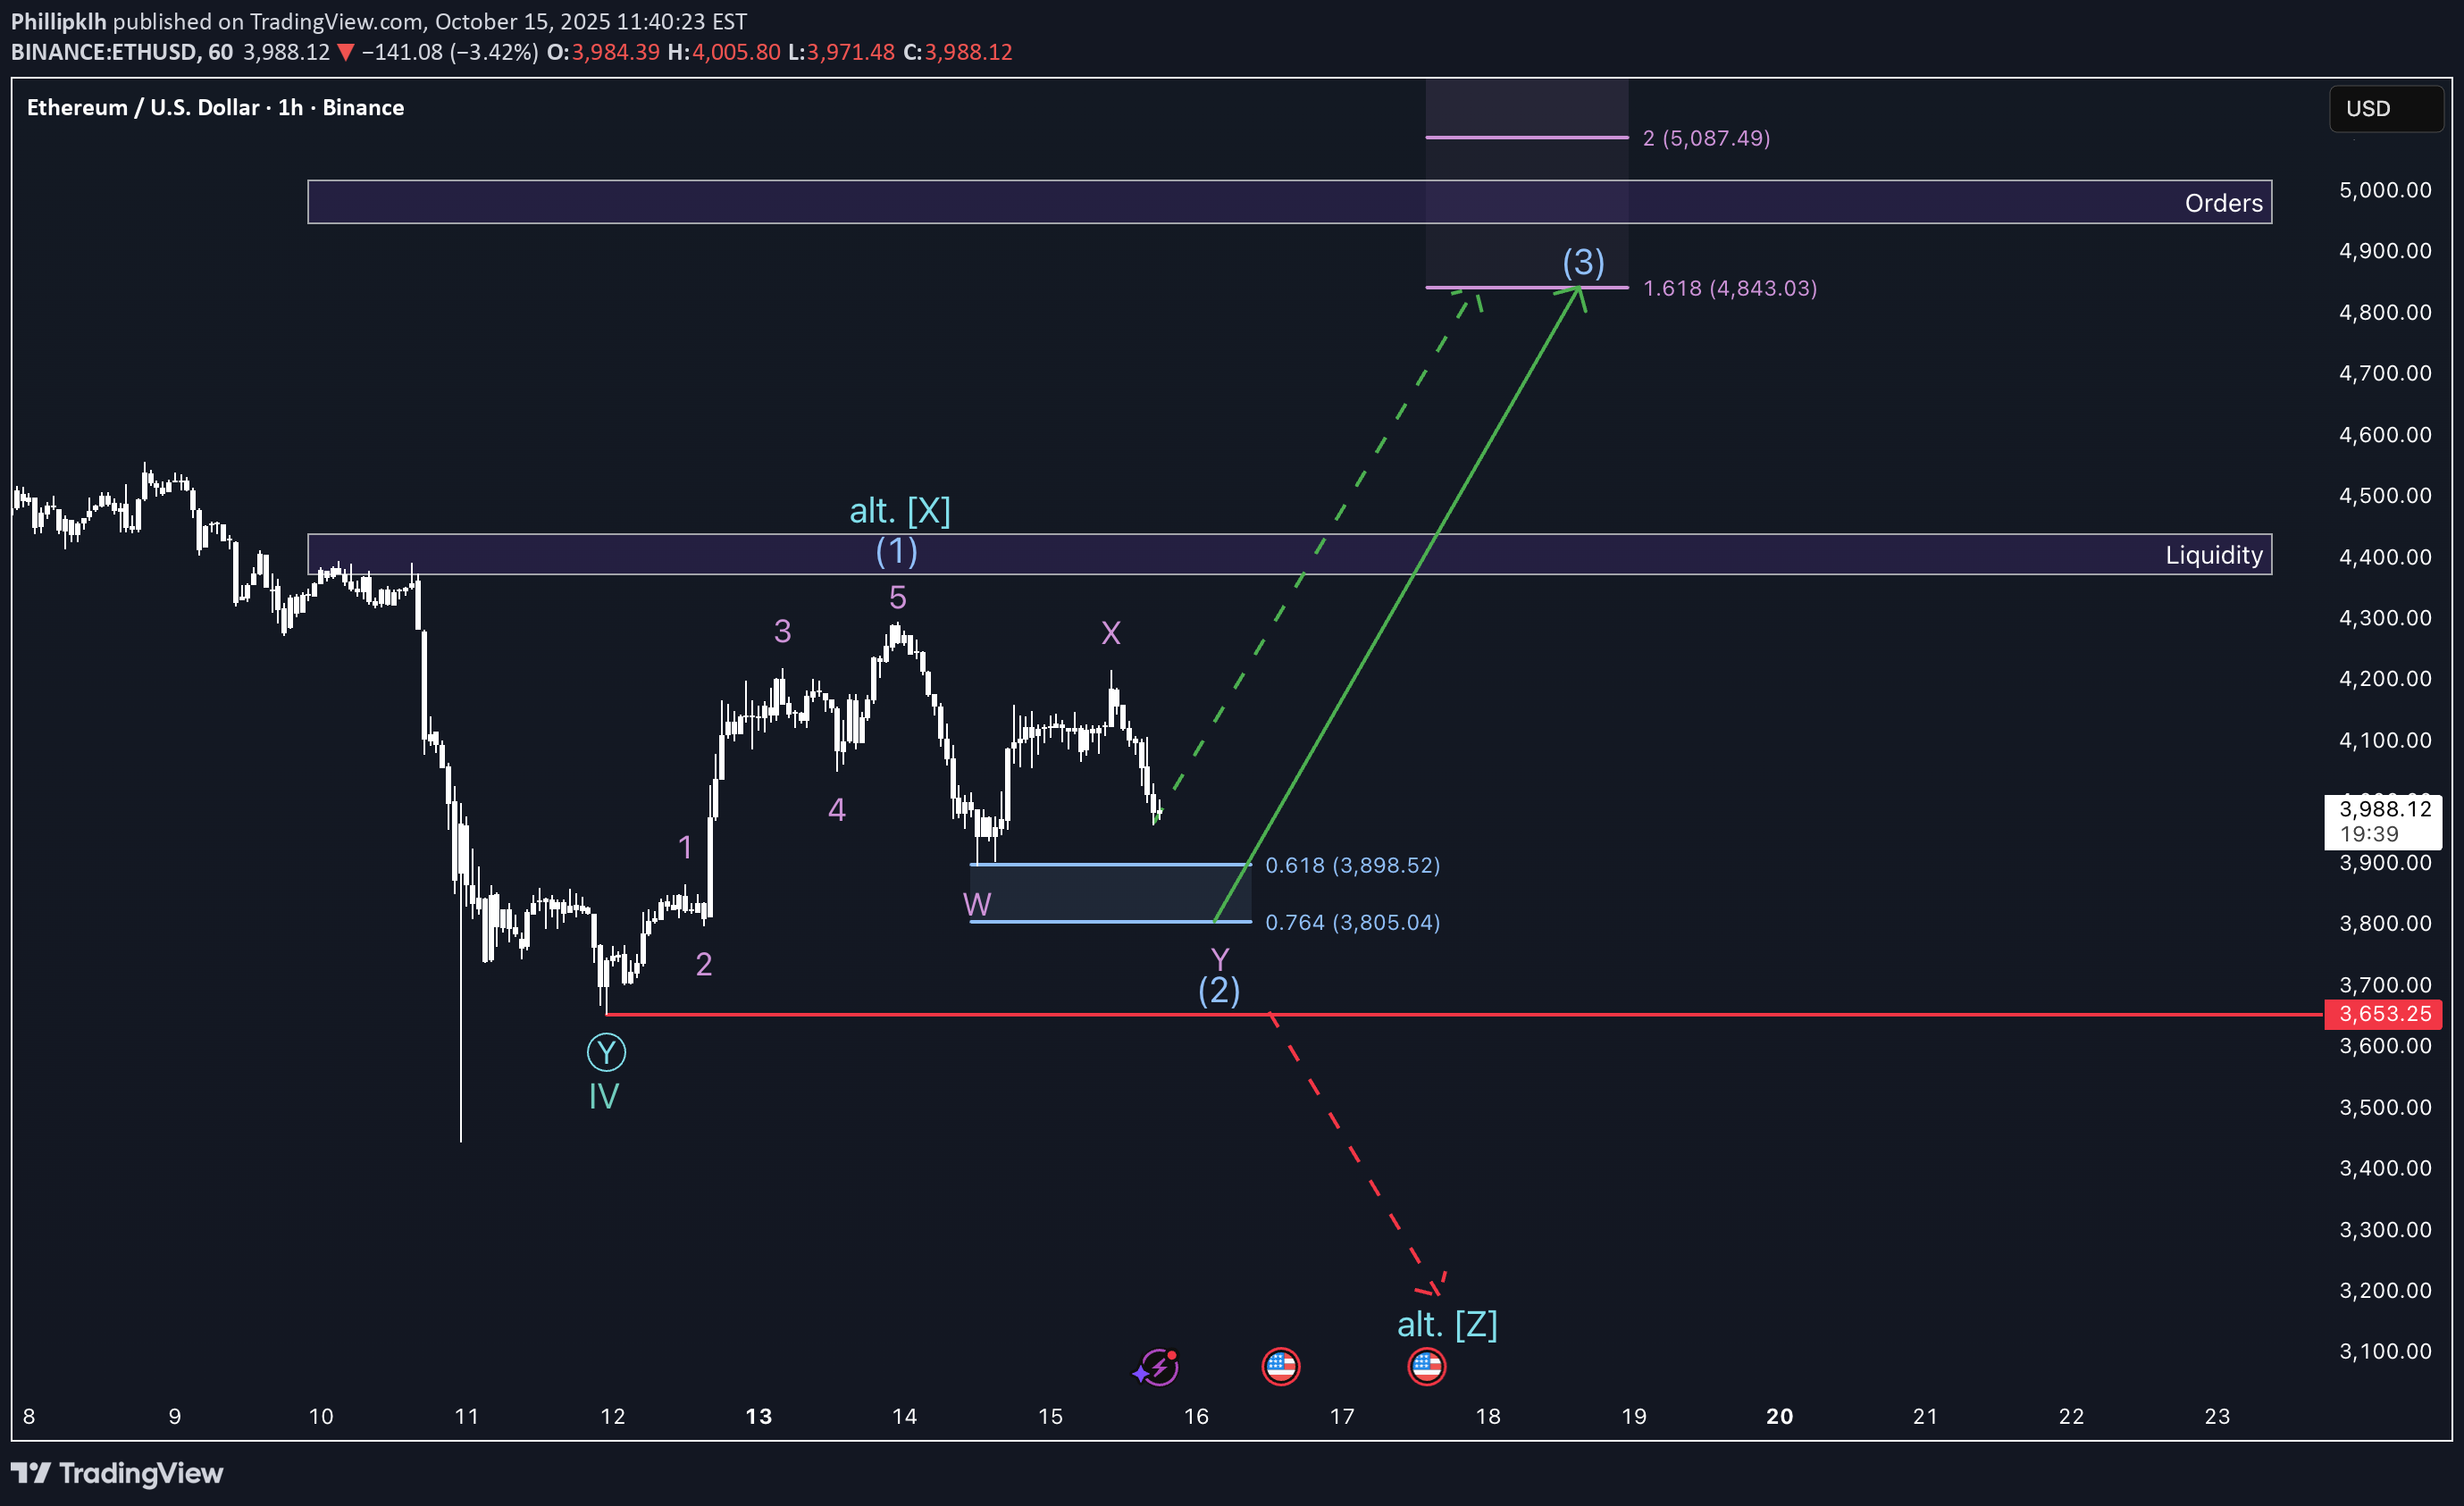
After the market crash on friday, Ethereum seems to recover and builds structure that suggests a possible impulsive rise soon. My primary scenario shortterm therefore would be that we drop a bit more to $3800 and build a impulsive rejection there. At this point, I want the price to turn around, rise impulsively and build massive momentum as typical for a wave 3. From the view of the elliott waves, this would be my favorable scenario. On the other hand, there is the possibility that we may turn around right here and form our wave 3 from here. This would also fit into the market structure, as funding rates turn negative and in the past such an action indicates rejection. Otherwise, the third but bearish scenario would mean that this wave 4 in the cycle isn't done yet, so we could potentially drop further to $3200. This scenario has the lowest probability, because of the current market structure and the clear price action of Ethereum. Overall the Liquidity above us has a significant magnet-effect on the current price to move up and fill orders. I hope I could help you out with that, bye.
Disclaimer
Any content and materials included in Sahmeto's website and official communication channels are a compilation of personal opinions and analyses and are not binding. They do not constitute any recommendation for buying, selling, entering or exiting the stock market and cryptocurrency market. Also, all news and analyses included in the website and channels are merely republished information from official and unofficial domestic and foreign sources, and it is obvious that users of the said content are responsible for following up and ensuring the authenticity and accuracy of the materials. Therefore, while disclaiming responsibility, it is declared that the responsibility for any decision-making, action, and potential profit and loss in the capital market and cryptocurrency market lies with the trader.