
PalenTrade
@t_PalenTrade

What symbols does the trader recommend buying?
Purchase History
پیام های تریدر
Filter
PalenTrade
Radix waking up!? (Ultimate)
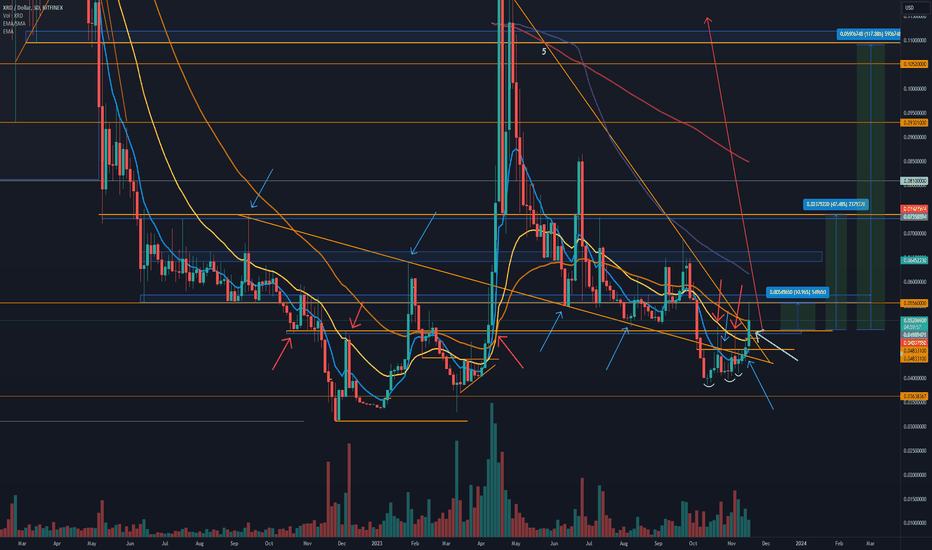
Hi. I was supposed to put out this analysis a few days ago. Sorry about that. I have been waiting for a while for this $0.05 to break. Many price suppression levels are broken, if we do close above $0.05 . -Vertical trendline (red arrows) -Lowering trendline (blue arrows Both have shown many times their importance , by how price has reacted to them. First resistance $0.0556-0.058, after that $0.74, $0.11, and $0.14. I am waiting for higher prices. Smart Contracts went "online" 2 months ago and TVL is just about to hit 20 Million! TON demonstrated staggering speed on 104k TPS , which is claimed to be the fastest blockchain in the world. This has woken up the Radix community and founder Dan Hughes to break the 104k record and previously demonstrated over 1 mil TPS on Radix I wrote a small post on X week ago, about Radix's progress after Babylon Update . I suggest you check it out, but be careful if you deep dive on XRD! You might experience #RadixRevelation! This is the only Crypto project which I did accumulate on the bear market. I Have had a close eye on it. This is not a financial advice!Here we can see some structural changes in price action, on the 12H timeframe. Higher lows, (accumulation). Price made a higher high. But we do need that close above $0.05 as confirmation. I would like to see the price above the $0.058 area to be really convincedWe will be eyeing this price action. If you have any questions at all. Don't be afraid to ask. I gladly answer, as well as I can
PalenTrade
Gala Games possible 130% move?

GALAUSDT testing a key level of significance (marked by red arrows). Trying to get above the 2100 area. If we stay above it and get on top of the 200MAs on daily (picture added) the next big resitance level is 5 cents. Possible 130% move for the patient. XRP trade just hit our first target after breakout, 22% move. And DYDX to stop loss, if you are intested about a losing trade and how to take a lossHere we can see that 200EMA and 200MA which has worked as resistance before (Highlighted with blue arrows). Usually they give some support or resistance to the price, but you know how cryptos move sometimes ;)Nice breakout from the 200EMA. Need to close above this, and a backtest would be just beautiful. Next smaller resistance/target is 3 cents where you can relieve some pressure if wanted, but I'm waiting for one of the main targets around 0.05 Dollars. Patience will be rewardedNice backtest of a key level that used to work as support, then turned to resistance, and now seems to be support again
PalenTrade
Bitcoin Bull Flag forming, BTC to 40k?

Bitcoin is possibly forming a continuation Bull Flag pattern. Target ~40200 Price is respecting nicely 12H 9EMA as we can see from the chart (same with Total marketcap). If we break the 9EMA support I think we will go test the Daily 9EMA and Flags bottom level where probably some buyers would show up. (Picture below) This price action is quite fascinating and the trend seems strong (haven't broken down yet). Much people are hoping for a Break and Retest on the 32k breakout level, so they can buy their positions. Could be that we won't even get there. Not financial advice. My analysis on Crypto Total Marketcap , the most important level I'm following on crypto -PalenTradeI think 9EMA and possible Bull Flags bottom will give some support on Daily timeframe, but most ideal place to have a entry would be on the Break and Retest level around 32k.Price respecting nicely 10EMA. As long as we stay on top of it, I'm waiting for 37400 target and if that is broken 42k, possibly 46-48k (48k target is .618 Fibonacci retracement, that probably will be hit at some point). If 10EMA breaks we might take some speed from possible flags bottom. There's also a rising channel (I'll add that). It feels like the price might not want to go retest 32k as there is loads of people waiting to pick up their positions cause they were surprised by the breakoutI don't usually like to use lower timeframes cause they give much more false signals but here's the rising channel on 4H. Remember the more times support or resistance is hit the weaker it gets. Why I wanted to add this was the rising demand which it showsInteresting price action. We broke the flag on 12H (not on daily yet). Now I'm following, if the price holds the upper portion of the flag, or previous highs, and can we close above 37500? If price does, it's bullish and 42k target is next and maybe even 45-48k. if we would get a flush out now (not so likely) 32k area would be a perfect place to buy. Anyways. At some point, we do need a flush-out"Price action looks like, we might need to take some more speed to break 37500 $BTC. Test of 32k is always possible. Let's see if the rising channel can hold!" I'm a long-term bullCan we finally break the 38k? Price does act like there is accumulation. Higher lows. If broken targets 42k, and 45-48k. 48K is 0.618 Fibonacci retracement level.Bitcoin soon hitting the 48k Target! 0.618 Fibonacci Retracement level ~48.5k! Would make sense price to stall around 48k-50k. But you never know. If broken, the next target is 52k. At some point, it would make sense that we get that classic 20%-35% drop, that Bitcoin is known for! Be prepared for that!
PalenTrade
XRPUSDT 25% to 70% Bull move??

Sunday analysis. Seems like XRP is trying to break the first resistance which is the last previous highs (closer picture below). Price action looks like it would like to breakout and go 0.68 cents. Good Risk/Reward here. Ascending Triangles target is around 0.83 cents, 50% move. Price has respected nicely the 9EMA support (picture below) Check out my analysis about DYDX or GOLD which are still active DYDX GOLD -PalenTradeHere we can see better the 9EMA respected as support and previous highs trying to break. The higher resistance level is stronger, but when broken there is well space for a bigger moveBeautiful backtest of key level (previous highs). Still 0.566 is the big resistanceTesting the 0.566 resistance. Let's see if price can get through and close above it on daily. If it can, 1st target 0.673 area. If not and we fall throught previous highs, we have our risk calculated accordingly!We got real nice close above the .566-57 area, and perfect backtest of the previous resistance. First target ~0.673Beautiful move after the price broke the levels we talked about. First target hit (22%)Funny. I have been following XRP price action and it started to look weak if 9EMA had been broken. Buying pressure found! From the 9EMA support which has proven itself a few times. Still waiting for the 2nd target $0,91-$1. Patience is rewarded!What a volatility! A daily close above the Doji candle would be important, or at least above the 0.681 level. I'm staying bull as long as the 9EMA holds. If that is broken and we get a bigger flush XRP might go test 0.566, the key level from previous highs.
PalenTrade
DYDX/USDT

Possible break and retest happening on DYDX. Let's see if this key level can hold and buyers show that they are in control, or will it break and they need more time. If there will be new crypto bull market, I think Dexes like GMX, GNS and DYDX will perform well, as they will start to bring profitable revenue in and share it with holders of their tokens If you are surprised that altcoins got whacked for the last 4 months against Bitcoin you shouldn't be Post from june about alts No trade is risk free! 1st mistake novice traders do is not having risk management and get their ass burned! -PalenTradeThis is actually a thing I don't like. 10EMA worked as support (on 4H) but we broke it and is now working as a resistance like the previous candle shows. BUT Bigger timeframe is ALWAYS more significant so we focus on that with good Risk management ofcDYDX retesting the previous highs (Break and Retest?). Let's see if this holds and we still get a move upwards or does the stop loss hit. This is why stop losses (Risk) are calculated and accepted beforehand. So you can feel relaxed at these momentsDYDX trade hit my stop loss. I will keep on eye on this pair and if I see reasons, for example price closing back on top of 2.315 area on Daily, I might take new trades. This is part of the game, embrace it -PalenTrade
PalenTrade
Will GOLD go test ATHs?

GOLD is showing some clues of possible trend change. If price stays on top of the last highs the price structure changes from making lower highs to making a higher high. This can indicate from a accumulation and growing bull force. As long as we stay on top of these previous highs I'm short term bull. Ofc there is also the huge 12 year cup and handle pattern which would indicate of higher prices probably around 24-25. Targets 2500-3000 per ounce (I'm Long Term Bull) Tell me if you would like a more in depth update about the 12 year GOLD cup and handle structure -JebuBeautiful beautiful backtest of the key level we talked about. Defending this level buyers showed who is in control right now. And this is why break and retests are Golden Risk/Reward entries.Remember. This doesn't mean that we can't break downwards. ALWAYS be open for both possibilitiesGold trade, stop loss hit. This is part of the game. I highlighted the 200EMA. Which has been demonstrated many times as a support. If price would get there. I'd say that is a great place for long and for Risk/Reward. (Not financial advice)
PalenTrade
Has GOLD made its low?

It seems that GOLD might have made its low. -Price turned 200EMA back to support (red moving average) -Showing rising demand on the three lows I marked, and last one is the highest (rising demand). -RSI break? (White arrow) When/If this lower high is broken then the price structure changes from lower highs to first time making higher high since may. Which gives me more conviction for a trend change. (ofc price has to stay on top of this level for keeping this valid) The higher low break on 200EMA works as stop loss for me I have around 2.5% of my net worth on Gold/Silver. I'm planning to make it bigger cause Gold will possibly run around 2.5k-3.5 in 2-3 years, and silver $50-$100 Good investment for years to come as quantitive easing etc will keep going harder than ever.. Check out my june BTC Dominance analysis here which hit spot on! :) ETH -16%, BNB -30%, ADA -33% against BTC since that call If you are starting out trading "post about great mentors I follow and respect" here 1st mistake novice traders do is that they don't use stop losses, doesn't calculate their RIsk/Rewards and gets their ass burned cause of that. Always use them! -PalenTrade
PalenTrade
SP500 / US500
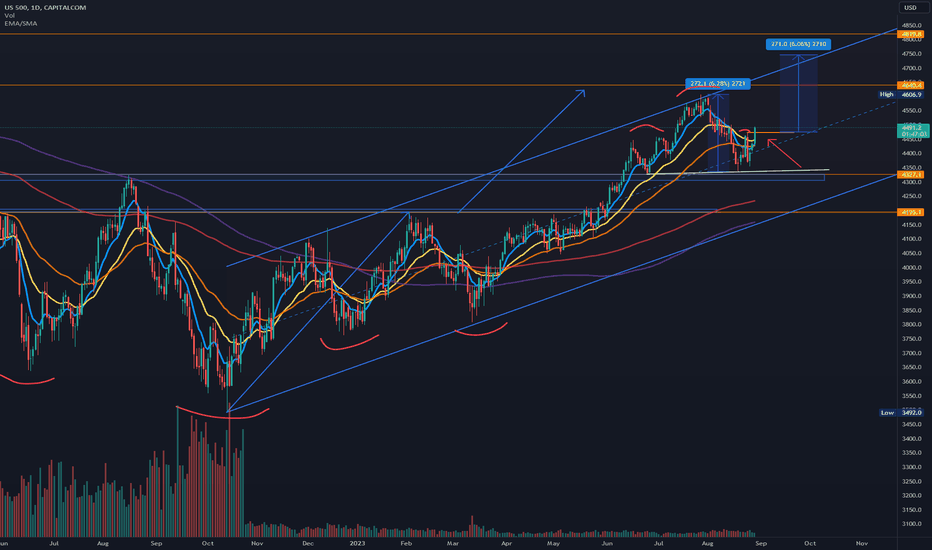
Did we get a right shoulder invalidation of the possible SP500 head and shoulders patterns? It is quite early to suggest that. We need the right shoulder to prove itself and work as support to give me more conviction. As long as we stay on top of the right shoulder ~4470 I am carefully bull. If we fall back under it I'm waiting for a test of the neckline ~4340. In this situation price probably would break it and tests the big support 4195 area. As long as we stay on top of the ~4180 I am long term bull If you trade use stop losses! 1st mistake novice traders do is that they don't use them and gets their ass burned! -PalenTrade
PalenTrade
Binance Coin BNB/USD

Binance Coin BNB/USD Will the price hold 200EMA for third time and make a higher low structure? If not. I don't think we will break the 185USD level because of fud, unless something would go badly wrong with Binance and collapse the price. Maybe we might get a nice bear trap there.
PalenTrade
I think Bitcoin's bottom is in

Hello.We can see RSI has broken its ~1 year downtrending trendline from feb 2021 on 3D (also on daily and weekly). Tells about possible trend change.Double top from 69k and head and shoulders targets hasn't been able to met. (Not enough sellers?)Price was pressured down with 25EMA (yellow line highlighted with red arrows), and has broke it now.18 500 is a strong resistance. If Bitcoin breaks 18 500 and stay on top of it, for me this FTX panic drop was to shake people out and trick them to wait for "lower prices"Market sentiment has been really negative for a long time and people have been waiting for 14, 12 and 10k so we probably won't even get there.Also there has been many news again how crypto is dead etc etcHigh volumes can also indicate bottoms and tops when there is alot of exchange between sellers and buyersThere were already 3 big liquidation and capitulation eventsI can also be wrong and we drop to 14k and below. Time will tell. But what I do know is that, as a long term investment to bitcoin. From 18k to 70k is close to 400%.Cheers
Disclaimer
Any content and materials included in Sahmeto's website and official communication channels are a compilation of personal opinions and analyses and are not binding. They do not constitute any recommendation for buying, selling, entering or exiting the stock market and cryptocurrency market. Also, all news and analyses included in the website and channels are merely republished information from official and unofficial domestic and foreign sources, and it is obvious that users of the said content are responsible for following up and ensuring the authenticity and accuracy of the materials. Therefore, while disclaiming responsibility, it is declared that the responsibility for any decision-making, action, and potential profit and loss in the capital market and cryptocurrency market lies with the trader.