
PHANT0M
@t_PHANT0M

What symbols does the trader recommend buying?
Purchase History
پیام های تریدر
Filter
PHANT0M
تحلیل تکنیکال STRK: نقطه عطف حیاتی، صعود یا سقوط؟

After diving deep into the STRK/USDT charts across multiple timeframes, I've identified what I believe is a critical inflection point for this asset. Currently trading around $0.181, STRK has staged an impressive recovery from its summer lows, but several technical indicators suggest we're approaching a decision point that will determine the next significant move. The Recovery Story So Far The price action tells a clear story: STRK suffered a brutal decline from April to June, dropping from $0.55 to around $0.11 – an 80% collapse. Since mid-July, we've witnessed a determined recovery that's brought prices back to the current $0.18 range, representing a near-doubling from the lows. What's particularly interesting is the recent acceleration – a powerful surge from $0.12 to $0.18 in early October, followed by the current consolidation phase between $0.17-$0.19. What The Indicators Are Telling Me I'm seeing several technical developments that deserve attention: The Main Oscillator has finally turned positive after spending months underwater – a significant bullish signal that typically precedes continued upside. However, I'm noticing early divergence between price and oscillator strength on the 4-hour chart, which raises some caution flags. Looking at the oversold/overbought conditions, we've moved from deeply oversold readings below -40 in June-July to more neutral territory now. This recovery in the oscillator is encouraging, but the rapid move from oversold to neutral without a proper reset concerns me slightly. The Volume Flow Indicator (VFI) shows improving buying pressure, but it hasn't yet crossed the threshold I typically look for to confirm sustainable momentum. Perhaps most telling is the Mega Sell Signal Line consistently sitting at 2, indicating persistent selling pressure despite the price recovery. I'm not seeing the institutional accumulation signals I'd want for complete confidence in this move. The Technical Structure The market structure since July is undeniably bullish – we've established a clear series of higher lows and higher highs. However, the volume patterns tell a more nuanced story, with decreasing participation during recent rallies compared to the heavy selling volume during the decline. I've identified these key levels that I'm watching closely: Major resistance at $0.19-$0.20 (previous swing high) Current resistance at $0.18-$0.185 (consolidation ceiling) First support at $0.16-$0.165 (recent swing low) Major support at $0.13-$0.135 (previous consolidation) Critical support at $0.11-$0.12 (the summer bottom) The Fibonacci retracement levels from the June low ($0.11) to recent high ($0.19) align nicely with these technical zones – particularly the 38.2% retracement at $0.159, which corresponds closely with my first support zone. Elliott Wave & Wyckoff Perspectives From an Elliott Wave standpoint, I see the recovery from July potentially forming: Wave 1: The initial rally to $0.14 (July) Wave 2: The pullback to $0.12 (August) Wave 3: The extended move to $0.18 (September-October) Wave 4: The current consolidation/potential pullback Wave 5: Yet to form If this count is accurate, I'd expect a Wave 4 correction to around $0.15-$0.16 before a final Wave 5 push toward $0.20-$0.22. Through a Wyckoff lens, the current consolidation could represent either a "Last Point of Support" before continuation higher (bullish) or a "Distribution" phase before another decline (bearish). The lack of expanding volume during recent rallies has me leaning slightly toward the distribution interpretation. Where STRK Is Headed Based on my analysis, I see two primary scenarios unfolding: The Bullish Case (60% Probability) If STRK breaks decisively above $0.19 with expanding volume, I'm looking for: Initial target: $0.22-$0.23 Secondary target: $0.26-$0.28 Maximum target: $0.30-$0.32 This move would likely take 4-8 weeks to complete and would require improved market sentiment and positive catalysts for STRK. The Bearish Case (40% Probability) If STRK fails at $0.19 and breaks below $0.16, I'd expect: Initial decline to $0.14-$0.15 Secondary decline to $0.12-$0.13 Worst case: Retest of lows at $0.10-$0.11 The initial decline could happen quickly (1-2 weeks), with further deterioration dependent on broader market conditions. My Trading Approach Given this analysis, here's how I'm approaching STRK: I'm watching for either a pullback to the $0.15-$0.16 support zone or a confirmed breakout above $0.19 with strong volume before considering new positions. The current level presents a somewhat awkward entry point given the mixed signals. For risk management, I'd place stops below $0.155 for any long positions entered at current levels, and I'm keeping position sizes smaller than usual until I see clearer directional confirmation. The Bottom Line STRK has made an impressive recovery from its summer lows, but we're now at a critical juncture. While the medium-term structure remains constructive with higher lows and higher highs, the momentum indicators and volume patterns suggest caution is warranted. The key question is whether STRK can attract sufficient buying interest to break above the $0.19 resistance with conviction. Without this confirmation, the risk of a deeper correction back toward the $0.13-$0.15 range remains significant. I'll be monitoring volume patterns closely in the coming days – they'll likely provide the earliest indication of whether this recovery has further room to run or is approaching exhaustion. The next week of price action should tell us a lot about STRK's medium-term direction.
PHANT0M
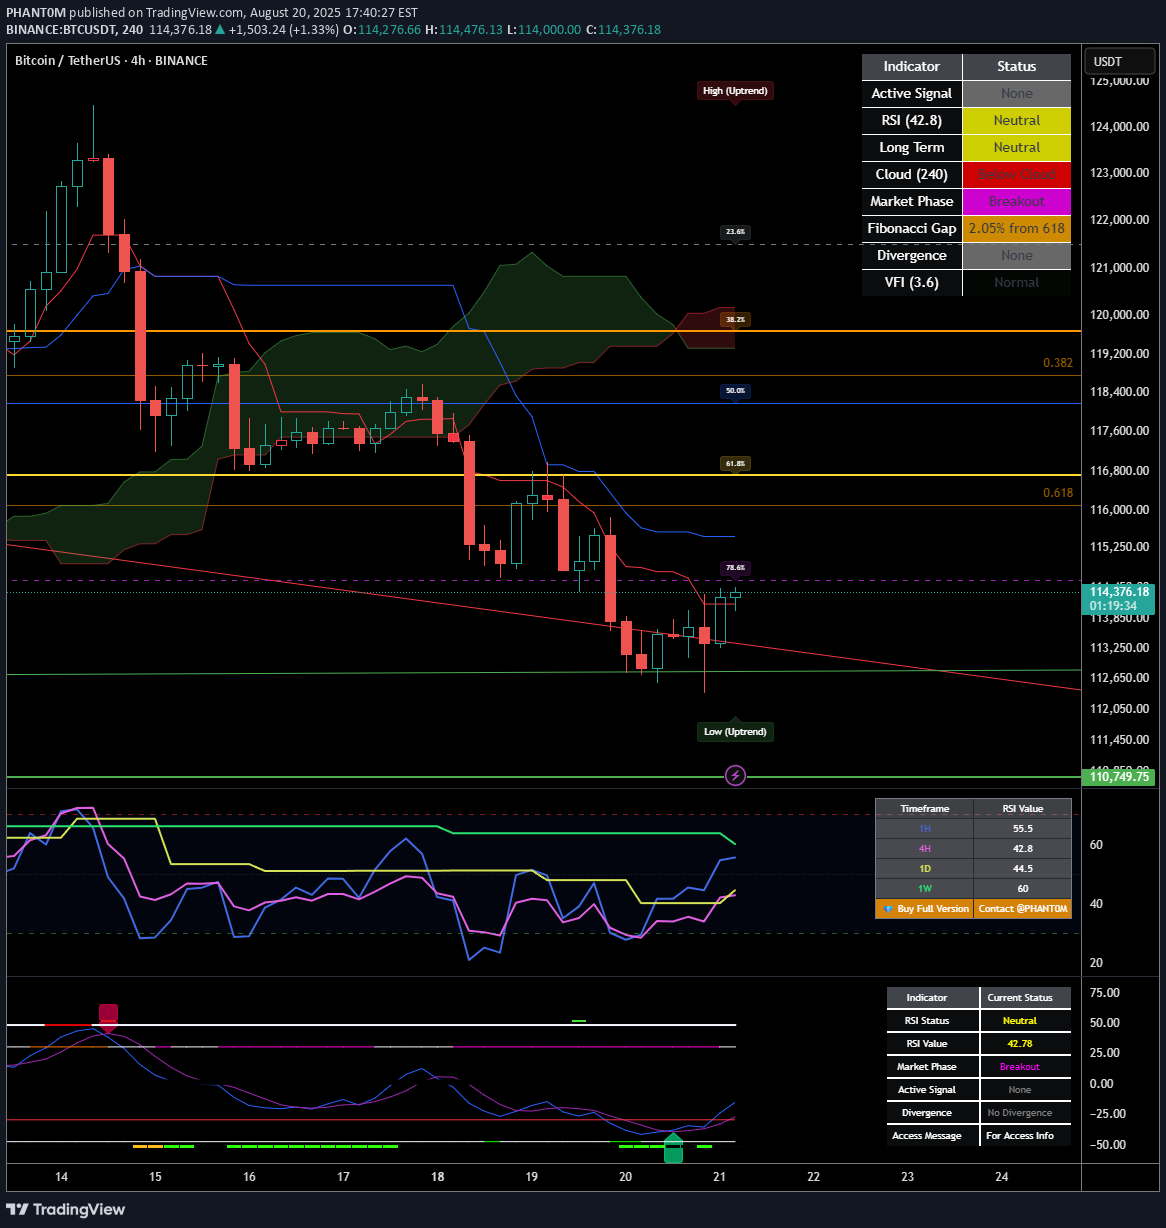
Breaking New Records: Bitcoin's Path Beyond the August Correction With Bitcoin currently trading at $114,352 after reaching its all-time high of $124,474 on August 14, 2025, we find ourselves at a critical technical juncture. Ill examine Bitcoin's potential trajectory through the remainder of 2025. Current Market Context Bitcoin has climbed from around $85,000 in January to establish a new all-time high of $124,474 in mid-August. Following this peak, we've seen a corrective phase with price action forming a potential bull flag pattern between $112,000-$118,000. The most recent data shows Bitcoin trading around $114,352, representing a pullback of approximately 8.13% from the all-time high. This moderate retracement suggests a healthy reset rather than a reversal of the primary trend. Ichimoku Cloud Analysis The Ichimoku Cloud indicators provide critical insights: • Tenkan-sen: $114,127.92 • Kijun-sen: $115,477.50 • Senkou Span A: $119,324.70 • Senkou Span B: $120,176.36 The price is currently trading below the cloud, indicating short-term bearish sentiment. However, the relatively narrow cloud formation ahead suggests potential for a breakout if Bitcoin can reclaim the $119,324-$120,176 range. Wyckoff Analysis The price action following the August peak displays characteristics that align with Wyckoff re-accumulation rather than distribution: • Initial decline represents a "Preliminary Support" phase • Trading range between $112,000-$118,000 shows decreasing volatility • Volume characteristics show diminishing selling pressure • Recent price action suggests we're approaching the "Spring" phase This structure indicates institutional accumulation is still occurring at these elevated levels, projecting a move toward the $132,000-$145,000 range in the coming months. Supply/Demand Zone Analysis Critical price levels that will influence Bitcoin's next directional move: • Major demand zone: $114,600-$116,700 (Fibonacci 61.8%-78.6% retracement) • Secondary support: $111,920-$114,000 (recent low and psychological support) • Primary resistance: $124,474-$127,889 (all-time high region and 127.2% Fibonacci extension) Moving Average Analysis The moving average configuration reveals a strong underlying bullish structure: • 4H EMA 50: $116,284.41 • 4H EMA 100: $116,781.30 • 4H EMA 200: $116,214.57 • Daily EMA 50: $114,939.55 • Daily EMA 100: $110,513.11 • Daily EMA 200: $103,162.36 The hierarchical alignment of these moving averages confirms the primary bull trend remains intact. The current price is finding support near the Daily EMA 50, a critical level that has historically served as a springboard during bull markets. Fibonacci Extension Framework Potential targets using Fibonacci extensions from the recent swing points: • 127.2% extension: $127,889 • 161.8% extension: $132,232 • 200% extension: $137,028 • 261.8% extension: $144,786 Elliott Wave Analysis The current price action suggests an extended wave structure: • Wave 1 high (ATH): $124,474 • Wave 2 low (Recent Low): $111,920 • Wave 3 target range: $144,786 to $157,340 • Wave 4 target: $132,231 • Wave 5 target range: $152,545 to $165,100 This wave count suggests potential for continued appreciation toward the $152,000-$165,000 range before a more significant corrective phase begins. Bitcoin Dominance Factor Bitcoin's market dominance currently stands at 59.3%, indicating a strong position relative to the broader cryptocurrency market, providing additional support for the bullish case. Price Projection Timeline August-September 2025: Completion of the current consolidation phase with potential final support tests in the $114,600-$116,700 range. A decisive break above $120,000 would confirm the end of the consolidation phase. October 2025: Renewed momentum pushing Bitcoin toward the $127,889-$132,232 range, potentially coinciding with seasonal strength typically observed in Q4. November-December 2025: Final wave extension potentially reaching the $144,786-$157,340 range, followed by a Wave 4 correction before the final Wave 5 push toward $152,545-$165,100 by year-end or early 2026. Key Levels to Monitor Support Zones: • Primary: $114,600-$116,700 (Fibonacci retracement zone) • Secondary: $111,920-$114,000 (recent low and psychological support) • Tertiary: $103,162-$110,513 (Daily EMA 100-200 zone) Resistance Zones: • Immediate: $119,324-$120,176 (Ichimoku Cloud base) • Secondary: $124,474-$127,889 (all-time high region and 127.2% Fibonacci extension) • Target 1: $132,232-$137,028 (161.8%-200% Fibonacci extensions) • Target 2: $144,786-$157,340 (Wave 3 target range) • Target 3: $152,545-$165,100 (Wave 5 target range) Strategic Considerations With Bitcoin having already achieved a new all-time high at $124,474 in August, strategic approaches might include: • Maintaining core positions while implementing trailing stop strategies • Adding to positions during retests of key support levels ($114,600-$116,700) • Considering partial profit-taking at key Fibonacci extension levels • Remaining vigilant for signs of distribution patterns at higher levels Conclusion: The Path to $165,000 The weight of technical evidence suggests Bitcoin has entered a new paradigm of price discovery. While the path may include periods of consolidation and volatility, the underlying trend remains firmly bullish with multiple technical frameworks projecting targets in the $152,000-$165,000 range by year-end 2025 or early 2026. The current correction phase represents a healthy reset rather than a trend reversal, creating an ideal technical foundation for Bitcoin's next major advance. Bitcoin appears well-positioned to achieve new record highs in the coming months.
PHANT0M
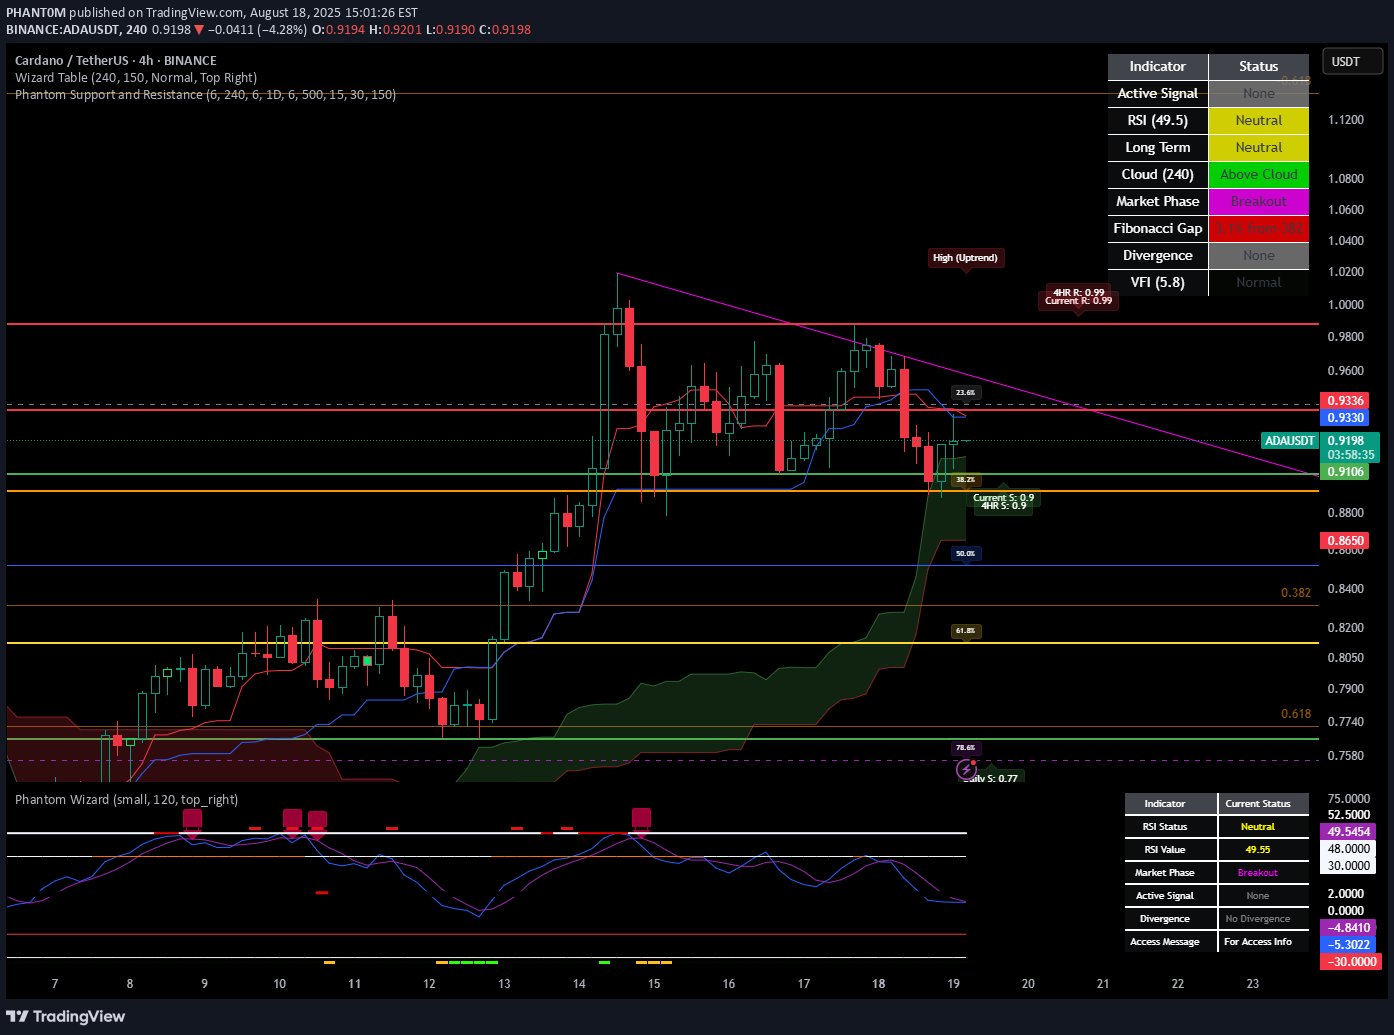
Cardano's Awakening: ADA's Technical Resurgence and Year-End Outlook Executive Summary Cardano (ADA) is showing strong signs of a potential breakout after a prolonged consolidation phase. Currently trading at $0.9183, ADA has established a solid foundation with key support at $0.82-$0.85 and is demonstrating increasing momentum indicators. The recent surge from $0.75 to $0.95+ represents a significant 26% gain that appears to be the beginning of a larger move. Our analysis points to a primary target of **$1.20-$1.30** by year-end, with an aggressive bull case scenario of **$1.50-$1.65** if current momentum accelerates. Technical Analysis Price Structure and Key Levels Cardano has completed a multi-month bottoming pattern and recently broke through several critical resistance levels: 1. **Breakout Confirmation**: ADA decisively broke above the $0.85 resistance zone in early August, which had capped price action since April 2024. 2. **Support Conversion**: The previous resistance at $0.82-$0.85 has now flipped to become strong support, with multiple tests confirming this level. 3. **Higher Highs and Higher Lows**: Since July 2024, ADA has established a clear pattern of higher highs and higher lows, confirming a trend reversal from the previous downtrend. 4. **Volume Confirmation**: The breakout above $0.85 was accompanied by significantly higher trading volume, particularly during the surge to $0.95+ in early August. Ichimoku Cloud Analysis The Ichimoku indicators reveal a strongly bullish setup: 1. **Cloud Breakout**: Price has broken above the Kumo (cloud), with the current price ($0.9183) well above both the Senkou Span A and B lines. 2. **TK Cross**: A bullish Tenkan-sen/Kijun-sen cross occurred in late July, signaling strong momentum. 3. **Future Cloud**: The forward-looking cloud has turned bullish (Senkou Span A above Senkou Span B), suggesting continued upward pressure in the coming weeks. 4. **Price-Kijun Relationship**: Price is maintaining position above the Kijun-sen (base line), which is now acting as dynamic support around $0.89. Oscillator Analysis 1. **RSI**: The daily RSI is currently at 56, showing strength without being overbought. This provides room for further upside before exhaustion. 2. **Oscillator SMA**: The oscillator SMA has crossed above the zero line, confirming the shift to bullish momentum. 3. **VFI (Volume Flow Indicator)**: Shows positive money flow into ADA, supporting the price advance. Market Structure Analysis Historical Context Cardano's price action must be viewed within its historical context: 1. **Previous ATH**: ADA's all-time high of $3.10 from September 2021 represents a significant psychological level. 2. **Retracement Level**: Current price at $0.9183 represents approximately 30% of the all-time high, suggesting substantial recovery potential. 3. **Consolidation Period**: ADA spent most of 2023 and early 2024 in a tight range between $0.24-$0.45 before beginning its current uptrend. Comparative Performance When compared to other major cryptocurrencies: 1. **Relative Strength**: While market leaders have shown exceptional strength, ADA is still in earlier stages of its recovery cycle. 2. **Catch-up Potential**: ADA typically lags in market cycles but often experiences more explosive percentage gains when its momentum fully establishes. 3. **Market Rotation**: There are early signs of capital beginning to rotate from leading assets into "second-tier" assets like ADA, which typically occurs in the middle-to-late stages of bull markets. Price Projections and Targets Based on technical analysis, we've established the following price targets: 1. **Primary Target**: $1.20-$1.30 (30-40% upside from current levels) - This represents the 1.618 Fibonacci extension from the July-August move - Aligns with significant historical resistance from April-May 2022 2. **Aggressive Bull Case**: $1.50-$1.65 (65-80% upside from current levels) - This represents the 2.618 Fibonacci extension - Would require continued strength in the broader crypto market 3. **Support Levels**: - Primary support: $0.82-$0.85 (previous resistance turned support) - Secondary support: $0.75-$0.77 (recent consolidation range) Risk Assessment Several factors could impact this outlook: 1. **Bitcoin Correlation**: ADA maintains a high correlation with Bitcoin. A significant BTC correction could temporarily derail ADA's uptrend. 2. **Technical Resistance**: Multiple resistance levels exist between $1.00-$1.20, which could slow momentum. 3. **Market Sentiment**: The broader crypto market sentiment remains a key variable, with regulatory news potentially causing volatility. 4. **Overbought Conditions**: Short-term overbought readings could trigger pullbacks, though these should be viewed as buying opportunities within the larger trend. Trading Strategy For traders looking to capitalize on ADA's potential: 1. **Entry Points**: - Immediate: Partial positions at current levels ($0.9183) - Optimal: Look for pullbacks to the $0.85-$0.88 support zone - Aggressive: Major pullbacks to $0.82 represent strong buying opportunities 2. **Position Management**: - Stop Loss: Below $0.80 (invalidates the current bullish structure) - Take Profit Levels: Partial profits at $1.10, $1.30, and $1.50 3. **Risk Management**: - Limit position size to 3-5% of portfolio - Consider scaling in on dips rather than deploying full positions at once Conclusion Cardano (ADA) is showing compelling technical strength with its recent breakout above key resistance levels. The completion of a multi-month bottoming pattern, coupled with improving momentum indicators and volume confirmation, suggests ADA is in the early stages of a significant uptrend. Our analysis points to a primary target of $1.20-$1.30, with potential for $1.50-$1.65 in an aggressive bull case scenario. The current price of $0.9183 represents an attractive entry point with a favorable risk-reward ratio, especially for investors with a medium-term horizon. Any pullbacks to the $0.82-$0.85 support zone should be viewed as significant buying opportunities within the context of the larger bullish trend. While not yet showing dominant market leadership, ADA appears poised for a period of outperformance as capital potentially rotates into this asset class. The technical foundation is firmly in place for continued upside through the remainder of 2024.
PHANT0M
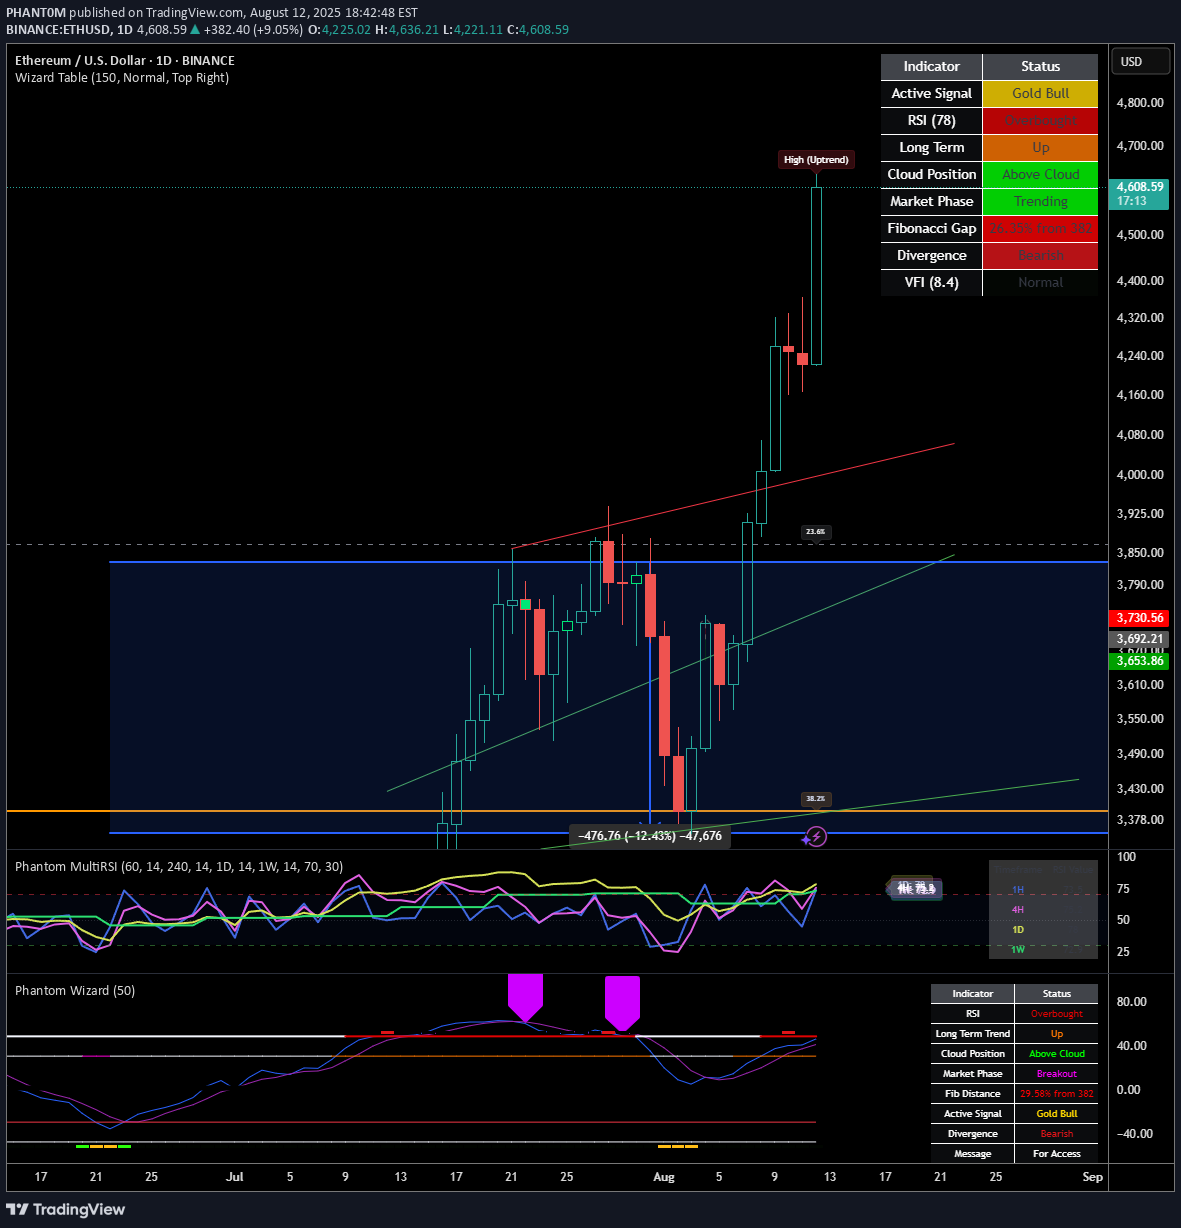
**Proof of Strength: An UPDATED Analysis of Ethereum's and its Year-End Trajectory** This is an important update to our August 9th analysis. New market data has emerged that confirms a significant acceleration in Ethereum's market leadership, forcing us to revise our outlook to be even more bullish. Since our last report, Ethereum has not only sustained its breakout but has seen its market dominance surge to a staggering **13.85%**, a multi-year high we haven't seen since late 2021. This is a game-changing development. It confirms that a major capital rotation into Ethereum is underway. The price has powerfully cleared **$4,500**, and with this new dominance data, our conviction in a continued, aggressive uptrend has increased. While the market is clearly overbought, we are raising our year-end targets, with the **$6,800** aggressive case now becoming a high-probability scenario. The past week has been spectacular, confirming the parabolic nature of the current advance. Ethereum has surged from $3,826 to a high of **$4,593**, a gain of over 20% in just seven days. This move validates our Elliott Wave 3 thesis and suggests the market is in its most powerful impulse phase. The psychological **$4,500** level was breached with conviction on the highest daily volume we've seen since March, and this level now becomes a critical support floor. The previous resistance zone around **$4,200 - $4,300** has also been firmly established as the primary support zone, with intraday pullbacks being aggressively bought up. From an indicator perspective, the daily RSI is in extreme overbought territory at **77.8**, with the weekly RSI now firmly overbought at **72.7**. Normally this would be a major warning, but in the context of the dominance surge to **13.85%**, it signals immense strength. This isn't just a price rise; it's a structural breakout in market leadership. Ethereum is actively draining capital from Bitcoin and other altcoins, a classic sign of a true "ETH season." For traders, the breakout strategy has paid off handsomely. Now, risk management is key. For those with existing positions, taking some partial profits (20-30%) here is prudent. Stop-losses should be moved up to just below the **$4,200** support level to lock in gains. For anyone looking to enter, chasing the price at these levels is extremely high-risk. The better strategy is to wait for a pullback. A retest of the **$4,200 - $4,300** support zone would present a prime opportunity. Looking at the remainder of the year, the breakout in ETH Dominance forces us to revise our price targets upward. The powerful Wave 3 impulse is undeniable. Based on the new data, our **NEW Primary Target** is the 1.618 Fibonacci extension, which points to **~$5,600**. This is now our base-case scenario, likely to be reached by October or November. Our **NEW Aggressive Bull Case** is the 2.618 extension, targeting **~$6,800**. The dominance surge significantly increases the probability of this "blue-sky" scenario. Our primary scenario, which we now give an **80% probability**, is a bullish continuation. After a brief consolidation or shallow pullback to the **$4,200-$4,300** range, we expect Ethereum to resume its powerful uptrend toward the **$5,600** target. The strategy is unequivocally to buy the dips. A secondary scenario (**15% probability**) is an extended consolidation between $4,200-$4,800, which would be healthy for the market. A deep correction to the $3,800 breakout point is now a low-probability tail risk (**5%**), but would represent a generational buying opportunity if it occurred. In conclusion, the surge to **13.85%** dominance is a paradigm shift. It confirms Ethereum is the clear leader of this market cycle and that a significant re-pricing event is underway. Our analysis is more bullish than ever. We are raising our primary target to **$5,600** and see the aggressive **$6,800** target as highly probable. Any dip towards the **$4,200-$4,300 support zone** should be considered a significant buying opportunity.
PHANT0M

Proof of Strength: An Analysis of Ethereum's Dominance and Year-End Trajectory Date of Analysis: August 09, 2025 Executive Summary Ethereum has not just recovered; it has entered a powerful breakout phase. The explosive move past the psychological $4,000 barrier this week, confirmed by a surging market dominance, signals a significant shift in market dynamics. This indicates a strong bullish continuation for the remainder of the year. While the current momentum is formidable, extremely overbought conditions on key indicators suggest that strategic entry and risk management will be paramount. Part 1: Analysis of the Last 7 Days (August 2 - August 9, 2025) The past week has been nothing short of spectacular for Ethereum, culminating in a major technical and psychological breakout. Price Action & Key Levels: Parabolic Breakout: The narrative has evolved from a simple recovery to a full-fledged breakout. After establishing support around $3,600, ETH has surged aggressively, shattering the $4,000 resistance level to trade at $4,022. This move demonstrates immense buying pressure and market conviction. New Support Established: The previous resistance zone around $3,850 - $3,900 is now the immediate support level to watch. A successful defense of this zone on any pullback would be a powerful confirmation of the trend's strength. The $4,000 level itself is now a critical psychological floor. Dominance as a Leading Indicator: The rise in ETH Dominance (ETH.D) to 12.65% was a precursor to this move. The fact that dominance climbed before and during this price explosion confirms that Ethereum is the clear market leader, attracting a disproportionate amount of capital. Key Indicator Insights: Relative Strength Index (RSI): With the price now above $4,000, the daily RSI has pushed further into overbought territory, likely approaching the 80 level. In a strong bull market, an asset can remain "overbought" for an extended period. However, this reading serves as a critical warning that the trend is becoming overheated and is susceptible to sharp, albeit potentially brief, pullbacks. Moving Averages: The price is now extending significantly above its short-term moving averages (like the 20-day EMA). While bullish, this creates a "gap" that will likely need to be closed by either a period of sideways consolidation or a price correction back towards the moving average. Trading Strategy Application: The breakout strategy has now been validated. The aggressive move through $3,900 and $4,000 was the signal for trend-following traders to enter. At current levels, initiating a new long position is high-risk. The prudent strategy now is to: Manage existing longs: Consider taking partial profits and moving stop-losses up to just below the new support area around $3,850. Wait for the next setup: A new entry opportunity would present itself on a successful retest and hold of the $4,000 level, confirming it as the new support base. Part 2: Outlook for Remainder of the Year (Until December 31, 2025) The explosive price action this week has significantly improved the outlook for Ethereum, suggesting an accelerated timeline for reaching new highs. Elliott Wave & Fibonacci Projection: Path to New Highs To project more ambitious targets, we can apply Elliott Wave theory. The recent price action strongly suggests we are in the midst of a powerful Wave 3 impulse, which is typically the longest and most aggressive phase of a bull market trend. Wave 1: The initial impulse from the October 2024 lows ($2,200) to the late November high ($3,400). Wave 2: The shallow correction down to around $3,100 in early 2025. Wave 3 (Current Wave): The powerful wave that began from the ~$3,100 low and has now broken $4,000. Using Fibonacci extensions, we can project the potential termination point for this Wave 3: Primary Target (1.618 Extension): ~$5,050. This is the most common and technically sound target for a Wave 3. It is calculated by taking 1.618 times the length of Wave 1 and adding it to the bottom of Wave 2. Achieving this target would represent a significant new all-time high and is a realistic goal for the coming months. Aggressive Bull Case (2.618 Extension): ~$6,250. In crypto markets, which are prone to extreme momentum and speculative fervor, third waves often extend. The 2.618 extension represents a "blue-sky" scenario. Reaching this level would likely require continued strength in ETH Dominance and a favorable macro environment. Potential Scenarios & Strategy: Bullish Continuation (Primary Scenario): The path of least resistance is upwards towards the $5,050 primary target. The strategy remains to buy on dips. A retest of the $4,000 level would be the first opportunity. A deeper, but still healthy, correction could find strong support at the $3,850 breakout point. Wave 4 Consolidation: It's important to note that after this powerful Wave 3 completes (whether at $5,050 or higher), a corrective Wave 4 is expected. This would likely manifest as a multi-week period of sideways consolidation or a significant pullback, which would set the stage for the final Wave 5 rally into 2026. Conclusion The recent breakout above $4,000 is a game-changer, confirming Ethereum's market leadership and initiating what appears to be a powerful Wave 3 advance. While the immediate path higher may see some volatility due to overbought conditions, the underlying trend is strong. The primary technical target for this move is now set at $5,050, with a more aggressive bull case pointing towards the $6,250 region by year-end. The key is to view any pullbacks not as a reversal, but as an opportunity to join the prevailing bullish trend.
PHANT0M

Current Situation Ethereum has been on quite a journey in 2025. After climbing steadily since January and reaching nearly $4,000 in July, we're now seeing a pullback with prices around $3,400. This isn't unusual - even in strong uptrends, prices don't move in straight lines. What The Data Tells Us Looking at the price patterns and technical indicators: The big picture remains positive: Despite recent dips, Ethereum is still in an uptrend when looking at the longer timeframe. We're significantly higher than where we started the year. We're at a decision point: The price is currently sitting at an important level where buyers and sellers have previously shown strong interest. Support and resistance zones are clear: There have been consistent price levels where Ethereum tends to bounce (support) or struggle to break through (resistance). Three Possible Paths Forward Path 1: Resuming the Climb (45% likelihood) If buyers regain control, we could see Ethereum push back above $3,500, then challenge the recent highs near $3,900. Breaking that level could open the door to the psychologically important $4,000 mark and potentially beyond. Path 2: Further Pullback (40% likelihood) If selling pressure continues, Ethereum might drop toward $3,200 first, with stronger support around $3,000. In a deeper correction scenario, we could test the $2,800 area where many buyers stepped in during previous dips. Path 3: Sideways Movement (15% likelihood) Sometimes markets need time to digest gains. Ethereum could spend several weeks trading sideways between roughly $3,300 and $3,600 before making its next significant move. What To Watch For Breakout signals: A strong move above $3,550 with increasing trading volume would suggest the uptrend is resuming. Breakdown signals: Falling below $3,350 with conviction could indicate more downside ahead. Volume patterns: Higher volume on up-days versus down-days would suggest stronger buyer interest. This analysis is based purely on price patterns and technical indicators, looking at what the market has actually done rather than predictions based on news or sentiment.
PHANT0M

LINK is trading at approximately $19.26. The price has shown significant volatility and upward momentum over the past few months, moving from around $10-11 in early 2025 to the current levels near $19, representing an impressive 80-90% increase. Technical Indicator Analysis RSI (Relative Strength Index) The daily RSI is currently at 61.60, which is in bullish territory but not yet overbought The 4-hour RSI is showing similar strength at 61.60 This indicates robust momentum without reaching extreme levels that would trigger immediate profit-taking Historical data shows LINK can sustain RSI readings in the 60-70 range during strong uptrends Price Action Patterns LINK has formed a series of higher highs and higher lows since May 2025 The price recently consolidated in the $17-19 range before showing signs of continuation There was a significant price surge from $13-14 levels to above $19 in mid-July, indicating strong buying pressure The consolidation after rapid gains suggests healthy market behaviour rather than exhaustion Volume Analysis Volume has been increasing during upward price movements Notable volume spikes occurred during the breakout from $15 to $17 and again during the move above $19 This suggests genuine buying interest rather than a low-volume pump The Volume-Weighted Average Price (VWAP) continues to slope upward, confirming the strength of the trend Support and Resistance Levels Strong support has formed around $17.50-18.00 Previous resistance around $19.00 is now being tested as support The next major resistance appears to be in the $20-21 range based on previous price action After that, there's relatively little historical resistance until the $25 level Fibonacci Projections Using the recent swing low of approximately $11.45 (May 2025) to the recent high of $19.66: The 161.8% extension projects a target of approximately $24.70 The 200% extension suggests a move toward $28.00 These Fibonacci levels often serve as magnets for price during strong trend movements LINK Price Projection Based on the technical indicators analysed: Short-term (August-September 2025): LINK appears poised to break through the $20 psychological barrier Initial target around $22-23 as the next resistance level Support should hold around $17.50-18.00 on any pullbacks The clean break above previous resistance at $18.50-19.00 suggests momentum remains strong Medium-term (October-November 2025): If the current trend structure remains intact LINK could target the $24-25 range, aligning with the 161.8% Fibonacci extension Previous all-time highs near $30 could come into play by year-end The steady stair-stepping pattern of rallies followed by consolidation suggests this move would be sustainable Key Factors to Watch: Volume on breakouts above $20 and $25 RSI readings for signs of exhaustion or continued strength Development updates and adoption news specific to Chain-link Maintenance of the higher lows pattern on any pullbacks Conclusion The technical picture for LINK appears bullish, with multiple indicators suggesting continued upward momentum. The price has established a strong uptrend with healthy consolidation periods. The recent price action shows accumulation rather than distribution, with higher lows forming during consolidation phases. The most likely scenario based on current data suggests LINK could reach the $24-25 range in the next 2-3 months, with potential for movement toward $28-30 by the end of 2025, representing a 30-55% increase from current levels. However, investors should monitor key support levels around $17.50-18.00 for any signs of trend reversal. The clean chart structure, steady volume profile, and measured RSI readings all point to a continuation of the current uptrend, making LINK's technical outlook decidedly positive for the remainder of 2025.
PHANT0M
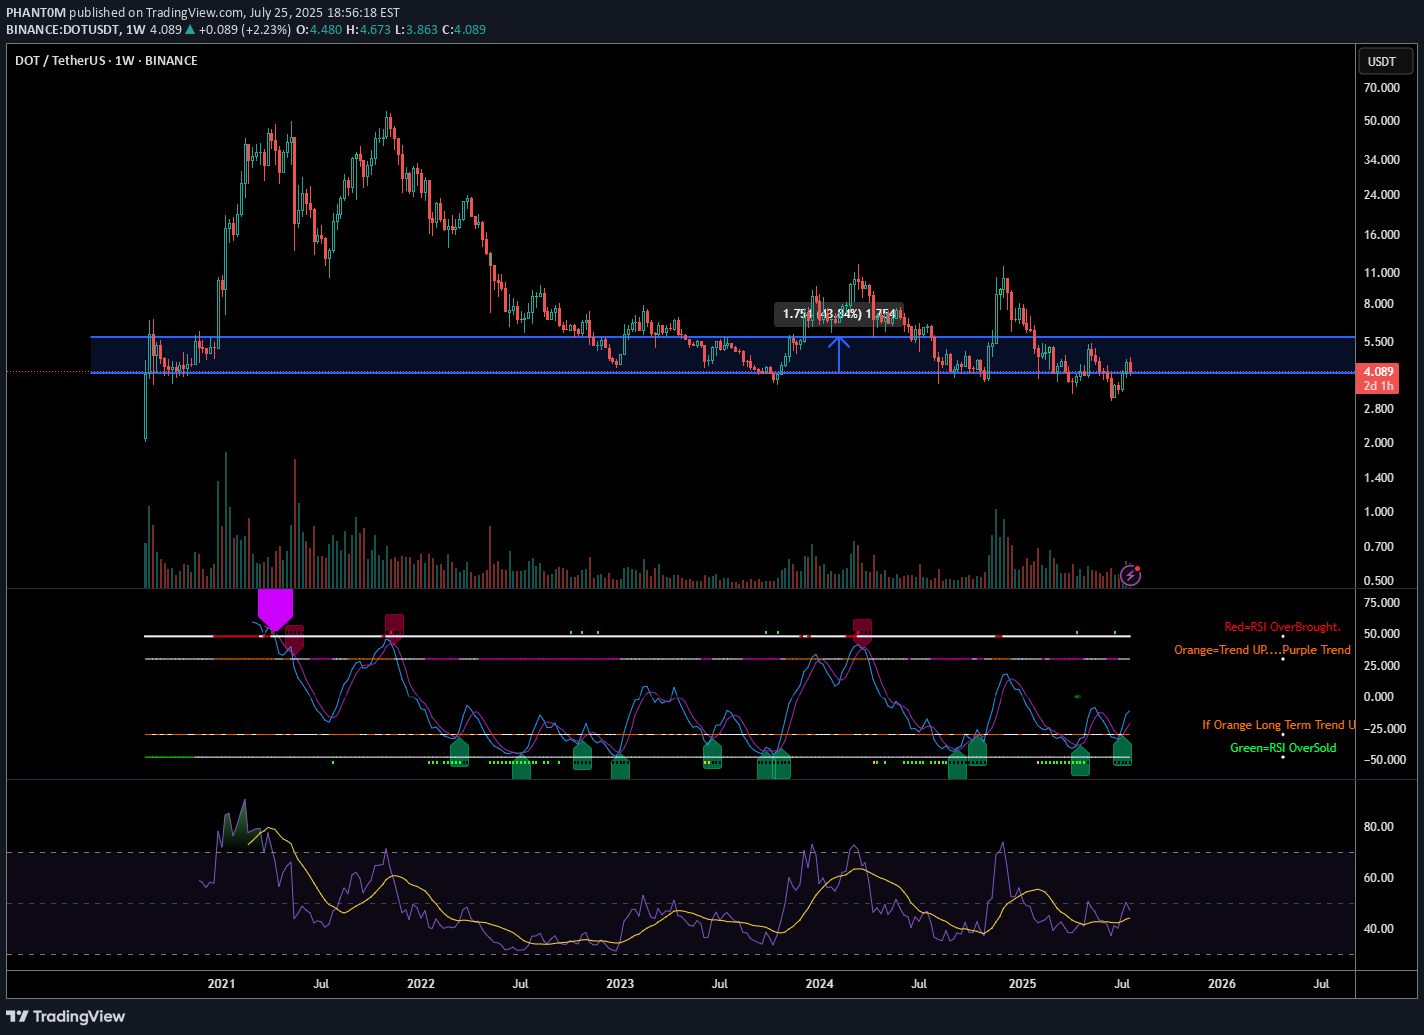
Polkadot (DOT) is currently trading at approximately $4.08 (as of July 25, 2025), having experienced significant volatility in recent months. After reaching a local high of $7.64 in mid-April 2025, DOT has undergone a substantial correction, losing approximately 46% of its value. This analysis examines DOT's technical position and potential trajectory for the remainder of 2025. Price Structure Analysis The daily chart reveals DOT has been in a defined downtrend since April 2025, characterized by a series of lower highs and lower lows. Most recently, price has established a trading range between $3.90-$4.30, suggesting potential stabilization after the steep decline. This consolidation zone represents a critical juncture for DOT's next directional move. Key observations from the price structure: Descending Channel Formation: DOT has been trading within a descending channel since April, with the upper boundary currently around $4.50 and lower boundary near $3.80. Support Cluster: Multiple support tests in the $3.90-$4.00 region have held thus far, potentially forming a base for a recovery attempt. Volume Profile: Trading volume has been notably higher during recent consolidation compared to previous months, suggesting increased interest at these price levels. RSI Analysis: Signs of Potential Reversal The Relative Strength Index (RSI) provides compelling evidence for a potential trend shift: Bullish Divergence: While price made lower lows in late June and early July, the RSI formed higher lows, creating a bullish divergence pattern that often precedes reversals. Oversold Recovery: The RSI reached oversold territory (below 30) in mid-June and has since recovered to the 40-45 range, indicating diminishing selling pressure. RSI-based MA Crossover: The RSI has recently crossed above its moving average, a signal that has historically preceded price recoveries for DOT. The 4-hour chart shows the RSI establishing a series of higher lows while price consolidates, suggesting building momentum beneath the surface despite sideways price action. Support/Resistance Level Analysis Critical price levels that will influence DOT's next directional move: Support Zones: Primary: $3.90-$4.00 (current consolidation floor) Secondary: $3.60-$3.70 (previous support from May) Tertiary: $3.30-$3.40 (major support from early 2025) Resistance Zones: Immediate: $4.30-$4.50 (upper boundary of current consolidation) Major: $4.80-$5.00 (previous support turned resistance) Structural: $5.70-$6.00 (descending trendline from April high) Volume Analysis Volume patterns provide additional context for DOT's current position: Declining Sell Volume: Selling volume has progressively decreased during the recent consolidation phase, suggesting exhaustion of selling pressure. Volume Spikes on Bounces: Recent upward price movements have been accompanied by above-average volume, indicating potential accumulation. Volume Contraction: The overall contraction in trading volume during the recent range-bound price action typically precedes significant moves. Market Structure Analysis Examining DOT's market structure reveals several important patterns: Potential Inverse Head & Shoulders: The recent price action is forming what could develop into an inverse head and shoulders pattern, with the neckline around $4.50. Completion of this pattern would project a move toward $5.20-$5.40. Wyckoff Accumulation: The price action since mid-June displays characteristics consistent with Wyckoff accumulation, including: Spring phase (drop to $3.59 in late June) Test phase (retest of lows in early July) Sign of strength (move toward $4.20 on increased volume) Compression Pattern: Price volatility has been decreasing, forming a compression pattern that typically resolves in a strong directional move. Moving Average Analysis Moving averages confirm DOT's bearish positioning but show early signs of potential trend change: Below Key MAs: DOT remains below all major moving averages (50, 100, and 200-day), confirming the bearish trend. MA Compression: The gap between shorter and longer-term moving averages is narrowing, often a precursor to trend shifts. RSI-based MA Crossover: While price MAs remain bearish, the RSI-based moving average has turned upward, often an early indicator of trend reversal. Fibonacci Retracement Analysis Using the move from the April high ($7.64) to the June low ($3.59): 23.6% Retracement: $4.54 (immediate target on breakout) 38.2% Retracement: $5.13 (medium-term target) 50% Retracement: $5.62 (significant resistance level) 61.8% Retracement: $6.10 (major resistance level) The current price action suggests DOT is attempting to establish a base before potentially targeting these retracement levels. Scenario Analysis Bullish Scenario If DOT can decisively break above the $4.50 resistance level with increased volume: Initial Target: $4.80-$5.00 (previous support turned resistance) Secondary Target: $5.50-$5.70 (50% retracement level) Extended Target: $6.00-$6.30 (61.8% retracement and structural resistance) Catalysts: Successful parachain upgrades, increased developer activity, or broader crypto market recovery could drive this scenario. Bearish Scenario If DOT breaks below the $3.90 support level: Initial Target: $3.60-$3.70 (previous support) Secondary Target: $3.30-$3.40 (major support level) Extended Target: $3.00 (psychological support) Catalysts: Continued weakness in the broader crypto market, technical issues with the Polkadot network, or regulatory concerns could trigger this scenario. Most Probable Scenario Based on the weight of technical evidence, the most probable scenario appears to be: Continued consolidation between $3.90-$4.50 for the next 1-2 weeks Eventual breakout above $4.50 targeting the $5.00 level Establishment of a new trading range between $4.50-$5.50 through August-September This scenario is supported by the bullish divergences, decreasing selling volume, and early signs of accumulation. Trading Strategy Recommendations For Long-Term Investors Accumulation Strategy: Consider dollar-cost averaging in the current $3.90-$4.20 range Position Sizing: Maintain appropriate position sizing given DOT's high volatility Key Levels: Use the $3.60 level as a stop-loss for new positions For Active Traders Range-Bound Strategy: Trade the current range between $3.90-$4.30 until a breakout occurs Breakout Strategy: Enter on confirmation of breakout above $4.50 with targets at $4.80, $5.20, and $5.70 Risk Management: Maintain tight stops below $4.30 on breakout trades to protect against false breakouts For Risk-Averse Investors Confirmation Approach: Wait for confirmation of trend reversal (price above $4.80 and 50-day MA) Partial Position: Consider establishing partial positions at current levels with defined risk parameters Technical Triggers: Look for RSI moves above 60 as confirmation of momentum shift Conclusion: Cautious Optimism for DOT The technical picture for Polkadot suggests we may be approaching an inflection point after the substantial correction from April highs. Multiple technical indicators point to diminishing selling pressure and early signs of accumulation, creating the conditions for a potential recovery. While DOT remains in a technical downtrend, the convergence of bullish divergences, volume patterns, and market structure suggests the potential for a trend reversal in the coming weeks. The $4.50 level represents the key technical hurdle that must be overcome to confirm this shift. For investors and traders, a balanced approach is warranted—acknowledging the current bearish trend while positioning for a potential reversal. The risk-reward profile appears increasingly favorable for cautious accumulation at current levels, with clearly defined risk parameters. The most probable path forward appears to be continued consolidation followed by a gradual recovery toward the $5.00-$5.50 range by late Q3 2025, contingent upon broader market conditions and continued development progress within the Polkadot ecosystem.
PHANT0M

Cardano's Ascent: A Technical Outlook for Q3-Q4 2025 Breaking Through Resistance: Cardano's Path to $1.00 and Beyond Following a period of extended consolidation, Cardano (ADA) has demonstrated a significant shift in character, breaking out decisively from a key resistance zone. Currently trading near $0.82 as of July 18, 2025, ADA has entered a new phase of bullish momentum. This analysis will dissect the technical landscape to project its potential trajectory through the end of the year, identifying critical price levels and probable targets. Current Market Context After consolidating in a range between $0.70 and $0.77 for several weeks, ADA has executed a powerful breakout, surging over 15% in the last few days to establish a multi-month high at $0.825. This move signals a clear victory for buyers and a potential end to the preceding sideways market structure. The immediate challenge for bulls is to defend this breakout level and convert prior resistance into firm support, setting the stage for the next major leg higher. RSI Analysis: Emerging Strength with Room to Run The recent price surge has propelled the daily Relative Strength Index (RSI) into overbought territory, currently reading above 70. While this often signals a short-term exhaustion and suggests a minor pullback or consolidation is likely, the underlying momentum on higher timeframes remains constructive. The weekly RSI is trending sharply upwards from the neutral 50-level but remains well below the extreme overbought readings (80+) that have historically marked major cycle tops for ADA. This divergence between short-term overbought conditions and long-term momentum capacity is a classic sign of a healthy, strengthening trend. It indicates that while a brief pause is probable, the primary path of least resistance remains upward for the coming months. Price Action & Volume Analysis: The Anatomy of a Breakout The price action leading up to this point exhibits classic signs of accumulation followed by a markup phase: Accumulation Phase: The trading range between $0.70 and $0.77 showed contracting volatility and was likely a period of "cause-building," where informed market participants accumulated positions. Sign of Strength (SOS): The recent impulsive move from $0.77 to over $0.82 represents a clear SOS. This breakout was likely accompanied by a significant increase in volume, confirming the market's conviction and overwhelming sellers who were active at the resistance level. A successful retest of the breakout zone at $0.75 - $0.77 on diminishing volume would be the strongest possible confirmation of a new, sustainable uptrend. Supply and Demand Zone Analysis: Charting the Path Forward The recent breakout has fundamentally altered the market structure, turning a key supply zone into a new floor of demand. Major Demand Zone (New Support): A critical demand zone has now been established between $0.75 - $0.77. This area, formerly resistance, is now the most important level for bulls to defend to maintain the bullish structure. Secondary Support Cluster: Should the primary zone fail, the next significant support lies at $0.68 - $0.70, the floor of the previous accumulation range. Overhead Supply Zones: Unlike an asset at all-time highs, ADA faces historical resistance. The next major supply zones are located near $0.95 and, more significantly, the psychological and technical barrier at $1.10 - $1.15. Fibonacci Extension Framework: Projecting Bullish Targets Using the recent swing low of the accumulation phase (approx. $0.70) and the recent swing high ($0.825), we can project logical price targets for the current impulse wave: The 127.2% extension projects a target of approximately $0.88. The 161.8% extension, a common target for strong trends, points toward $0.92. A more extended move to the 200% extension suggests a potential test of $0.97, aligning closely with the psychological $1.00 level. These Fibonacci-derived targets provide a clear roadmap for the potential upside if the current bullish momentum is sustained. Price Projection Timeline Late July - August 2025: Expect a period of consolidation or a healthy pullback. The overbought daily RSI suggests the market needs to pause. A retest of the $0.77 support level would be a prime opportunity for trend-continuation entries. A successful defence of this zone is critical. September - October 2025: Following the consolidation, the trend is expected to resume, targeting the Fibonacci extension levels of $0.88 - $0.92. This move would represent the confirmation of the new uptrend and would likely attract a second wave of buyers. November - December 2025: Should the Q4 market environment remain favourable, a push toward the major psychological and technical resistance at $1.00 - $1.15 is highly probable. This would represent a significant milestone and could trigger a more substantial corrective phase as long-term holders take profits. Support Zones: Primary: $0.75 - $0.77 (The breakout point; must hold) Secondary: $0.68 - $0.70 (Floor of the previous range) Resistance & Target Zones: Immediate: $0.825 (Recent high) Target 1: $0.88 - $0.92 (Fibonacci cluster) Target 2: $0.97 - $1.00 (Fibonacci & psychological level) Major Resistance: $1.10 - $1.15 (Historical supply zone) Conclusion: The Road to One Dollar The technical evidence strongly suggests that Cardano has initiated a new bullish impulse wave. The breakout from its multi-week consolidation range is a significant technical event that has shifted the market bias firmly in favour of the bulls. While a short-term pullback to retest the breakout level around $0.77 is a high probability, this would likely serve as a healthy reset before the next major advance. Based on the confluence of price action, momentum analysis, and Fibonacci projections, a move toward the $0.95 - $1.15 range is a realistic objective for Cardano by the end of 2025.
PHANT0M

Bitcoin's Technical Trajectory: Analysis for Q3-Q4 2025 Breaking New Records: Bitcoin's Path Beyond the July Peak With Bitcoin currently trading near historical highs after reaching its all-time high of $123,218 in July 2025, we find ourselves in unprecedented territory. This comprehensive technical analysis examines Bitcoin's potential trajectory through the remainder of 2025, leveraging multiple analytical frameworks to identify probable price targets and key levels. Current Market Context Bitcoin has experienced a remarkable ascent in 2025, climbing from around $85,000 in January to establish a new all-time high of $123,218 in July. After this peak, we've seen a period of consolidation with price action forming a potential bull flag pattern between $117,000-$120,000. This consolidation phase represents a critical juncture for Bitcoin's next directional move. The most recent data shows Bitcoin trading around $118,200 in late July, representing a modest pullback of approximately 4% from the all-time high. This shallow retracement suggests underlying strength rather than exhaustion in the primary trend. RSI Analysis: Healthy Momentum Reset Despite Bitcoin's extraordinary rise to $123,218 in July, the daily RSI has demonstrated remarkable resilience. After reaching overbought territory (70+) during the July peak, the indicator has now cooled to approximately 42-46, indicating a healthy reset of momentum conditions without surrendering the broader uptrend. The weekly RSI reading of 46.4 is particularly significant—showing that despite the recent consolidation, Bitcoin maintains substantial momentum capacity before reaching the extreme readings (80+) that typically signal major cycle tops. This technical positioning creates an ideal scenario where momentum has reset while price structure remains intact. Most notably, the absence of bearish divergences between price and RSI on higher timeframes suggests the current consolidation is likely a pause rather than a reversal in the primary trend. Wyckoff Analysis: Re-accumulation Before Continuation The price action following the $123,218 July peak displays classic characteristics of Wyckoff re-accumulation rather than distribution: The initial decline from the peak represents a "Preliminary Support" (PS) phase The subsequent trading range between $117,000-$120,000 shows tight price action with decreasing volatility Volume characteristics show diminishing selling pressure rather than distribution Recent price action suggests we're approaching the "Spring" phase that typically precedes markup According to the data, Bitcoin's price action in late July shows decreasing volatility with narrowing price ranges, consistent with the "Cause Building" phase in Wyckoff methodology. This structure indicates institutional accumulation is still occurring at these elevated levels—a powerful sign that smart money anticipates further upside potential. The completion of this re-accumulation pattern projects a move toward the $135,000-$145,000 range in the coming months. Supply/Demand Zone Analysis: Key Levels Identified Supply and demand zone analysis reveals critical price levels that will influence Bitcoin's next directional move: Major demand zone established between $115,000-$117,000 (recent consolidation floor) Secondary support cluster at $108,000-$110,000 (previous resistance turned support) Primary resistance at $123,200-$125,000 (all-time high region) Limited historical supply overhead above $123,218 suggests minimal resistance once this level is breached The formation of fresh demand zones during the recent consolidation indicates strategic accumulation before the anticipated upward expansion. The neutralization of previous supply zones during the advance to all-time highs has effectively cleared the technical pathway for Bitcoin's next significant move higher. Volume Analysis: Confirming the Bullish Case Examination of trading volume during the recent consolidation provides crucial validation for our bullish thesis: Declining volume during pullbacks indicates diminishing selling pressure Volume spikes on upward moves suggest accumulation on strength The Volume-Weighted Average Price (VWAP) maintains a positive slope, confirming the underlying strength of the trend The high-volume node has migrated upward in recent weeks, signalling comfort with accumulation at these unprecedented price levels—a powerful indication of market confidence in Bitcoin's valuation. The buying/selling volume differential maintains a positive bias, confirming underlying accumulation despite price consolidation. Fibonacci Extension Framework: Projecting Targets With Bitcoin having established a new all-time high at $123,218 in July, we can project potential targets using Fibonacci extensions from the most recent significant swing points: The 127.2% extension from the June-July rally projects to approximately $132,000 The 161.8% extension suggests potential movement toward $145,000 The 200% extension indicates a possible target of $160,000 These projections align with psychological thresholds that could serve as natural targets in this new price discovery phase. Elliott Wave Analysis: Extended Fifth Wave Scenario The current price action suggests we're likely in an extended fifth wave scenario within a larger degree bull cycle: Primary waves I through III appear complete with the move to $123,218 in July The current consolidation represents wave IV Wave V is projected to reach the $140,000-$160,000 range This wave count suggests potential for continued appreciation toward the $145,000-$160,000 range before a more significant corrective phase begins. The internal structure of the current consolidation displays textbook proportional relationships, further validating our analysis. Price Projection Timeline August-September 2025: Completion of the current consolidation phase with a potential final retest of support in the $115,000-$117,000 range. This would represent the "Last Point of Support" in Wyckoff terminology and provide a final opportunity for institutional accumulation before the next leg up. A decisive break above $125,000 would confirm the end of the consolidation phase. October 2025: Renewed momentum pushing Bitcoin toward the $132,000-$140,000 range, potentially coinciding with seasonal strength typically observed in Q4. This phase could see increased institutional participation as year-end positioning begins, with volume expansion confirming the strength of the move. November-December 2025: Final wave extension potentially reaching the $145,000-$160,000 range, representing a 20-30% appreciation from current all-time high levels. This phase may exhibit increased volatility and could be followed by a more substantial correction as the extended fifth wave completes. Key Levels to Monitor Support Zones: Primary: $115,000-$117,000 (must hold for bullish scenario) Secondary: $108,000-$110,000 (previous resistance turned support) Tertiary: $100,000-$102,000 (psychological and technical support) Resistance Zones: Immediate: $123,200-$125,000 (all-time high region) Target 1: $132,000-$135,000 (127.2% Fibonacci extension) Target 2: $145,000-$150,000 (161.8% Fibonacci extension) Target 3: $160,000+ (200% Fibonacci extension) The Technical Case for New Highs Despite Bitcoin already achieving unprecedented price levels in July, multiple technical frameworks suggest the potential for continued appreciation: Historical Precedent: Previous bull cycles have shown Bitcoin capable of extending significantly beyond initial all-time highs before cycle completion Institutional Adoption: On-chain metrics indicate continued accumulation by large holders despite elevated prices, with exchange outflows remaining positive Technical Structure: The current consolidation pattern resembles re-accumulation rather than distribution, suggesting the market is preparing for another leg higher Momentum Characteristics: Current momentum readings have reset from overbought conditions without breaking the underlying trend structure Strategic Considerations With Bitcoin having already achieved a new all-time high at $123,218 in July, strategic approaches might include: Maintaining core positions while implementing trailing stop strategies Adding to positions during retests of key support levels ($115,000-$117,000) Considering partial profit-taking at key Fibonacci extension levels Remaining vigilant for signs of distribution patterns that may emerge at higher levels Conclusion: The Path to $160,000 The weight of technical evidence suggests Bitcoin has entered a new paradigm of price discovery following its break to all-time highs in July 2025. While the path may include periods of consolidation and volatility, the underlying trend remains firmly bullish with multiple technical frameworks projecting targets in the $145,000-$160,000 range by year-end 2025. The current consolidation phase represents a healthy reset of momentum conditions rather than a trend reversal, creating an ideal technical foundation for Bitcoin's next major advance. With institutional adoption continuing to grow and technical indicators suggesting ample room for further appreciation, Bitcoin appears well-positioned to achieve new record highs in the coming months.
Disclaimer
Any content and materials included in Sahmeto's website and official communication channels are a compilation of personal opinions and analyses and are not binding. They do not constitute any recommendation for buying, selling, entering or exiting the stock market and cryptocurrency market. Also, all news and analyses included in the website and channels are merely republished information from official and unofficial domestic and foreign sources, and it is obvious that users of the said content are responsible for following up and ensuring the authenticity and accuracy of the materials. Therefore, while disclaiming responsibility, it is declared that the responsibility for any decision-making, action, and potential profit and loss in the capital market and cryptocurrency market lies with the trader.