
PFXteam
@t_PFXteam

What symbols does the trader recommend buying?
Purchase History
پیام های تریدر
Filter
PFXteam
XAUUSD 30M – OB Sell Limit Setup for 3R Opportunity by PhoenixFX
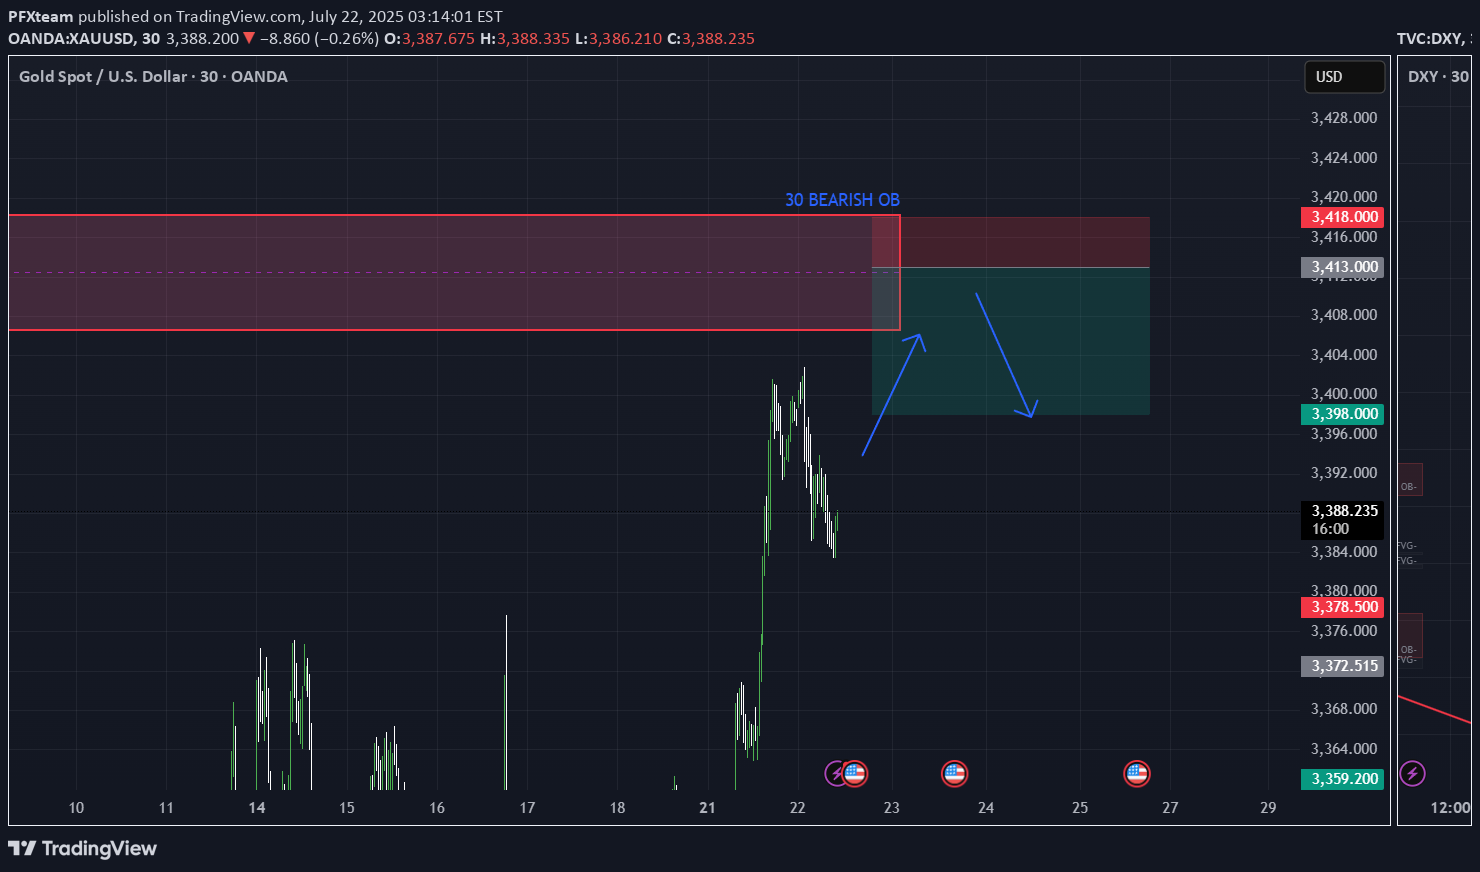
Gold 30M Chart – Smart Money Sell Limit We’re watching a clean Order Block (OB) on the 30-minute timeframe as price retraces into a key supply zone. This setup offers a high-probability reversal opportunity with a 3R risk-to-reward ratio. ✅ 📍 ENTRY: 3413 🛑 SL: 3418 (above structure) 🎯 TP1: 3408 (1R) 🎯 TP2: 3403 (2R) 🎯 TP3: 3398 (3R) The price action shows signs of exhaustion and premium pricing as it returns into a previous OB. We’re positioning with precision and tight risk. 📌 Strategy: – 30M OB zone – Clear BOS + retracement – Set & forget execution #XAUUSD #Gold #OrderBlock #SupplyZone #SmartMoney #PhoenixFX #RiskReward
PFXteam
XAUUSD 30M – OB Sell Limit Setup for 3R Opportunity by PhoenixFX
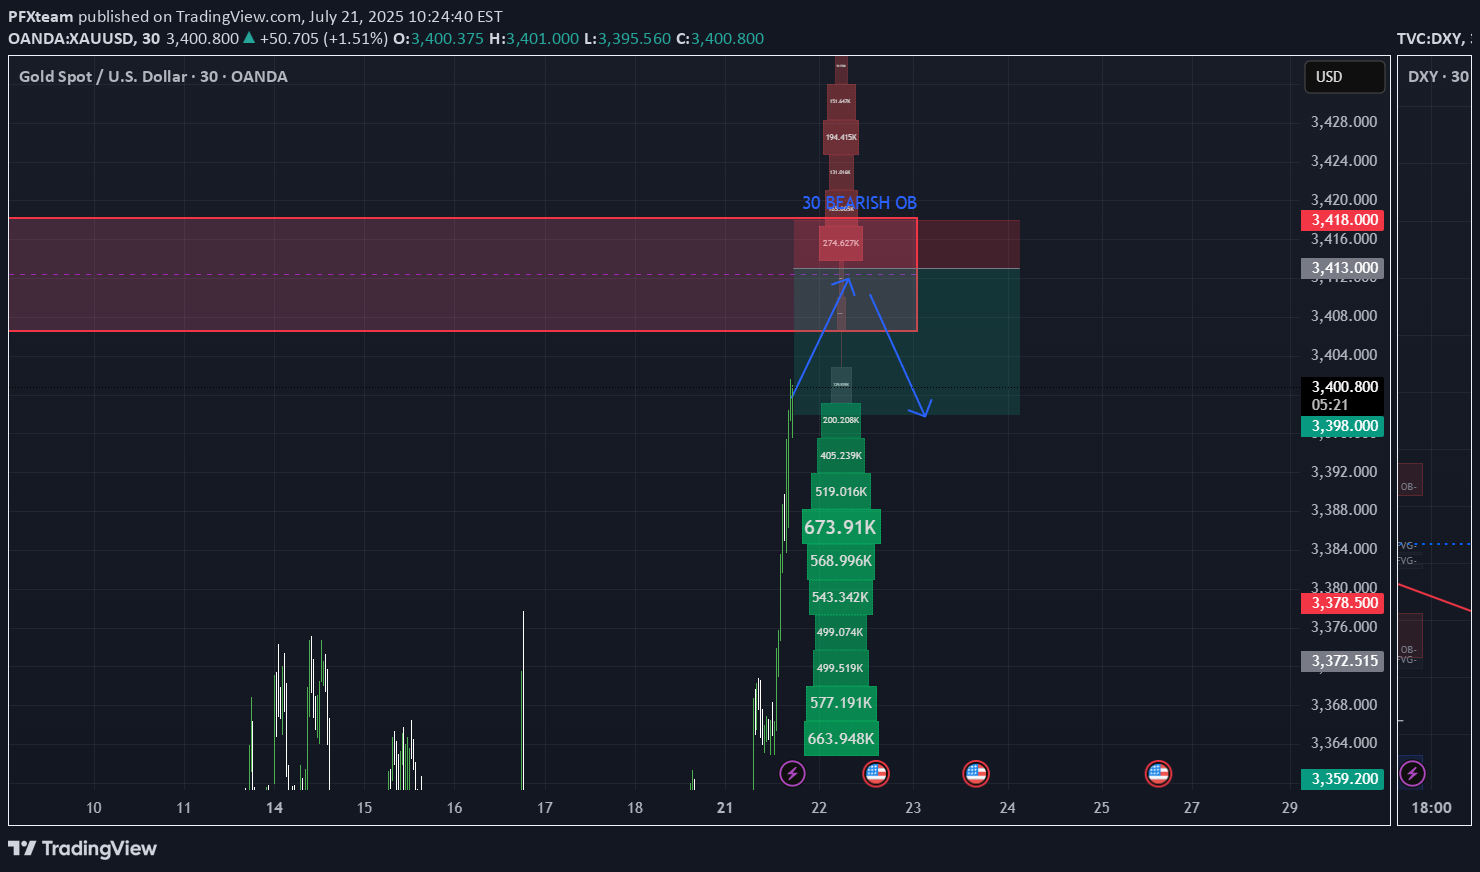
Gold 30M Chart – Smart Money Sell Limit We’re watching a clean Order Block (OB) on the 30-minute timeframe as price retraces into a key supply zone. This setup offers a high-probability reversal opportunity with a 3R risk-to-reward ratio. ✅ 📍 ENTRY: 3413 🛑 SL: 3418 (above structure) 🎯 TP1: 3408 (1R) 🎯 TP2: 3403 (2R) 🎯 TP3: 3398 (3R) The price action shows signs of exhaustion and premium pricing as it returns into a previous OB. We’re positioning with precision and tight risk. 📌 Strategy: – 30M OB zone – Clear BOS + retracement – Set & forget execution 🚨 This setup is also live in our public Telegram channel — follow for more! #XAUUSD #Gold #OrderBlock #SupplyZone #SmartMoney #PhoenixFX #RiskReward
PFXteam
XAUUSD 30M - OB SELL LIMIT for 2.5R SETUP by PhoenixFX
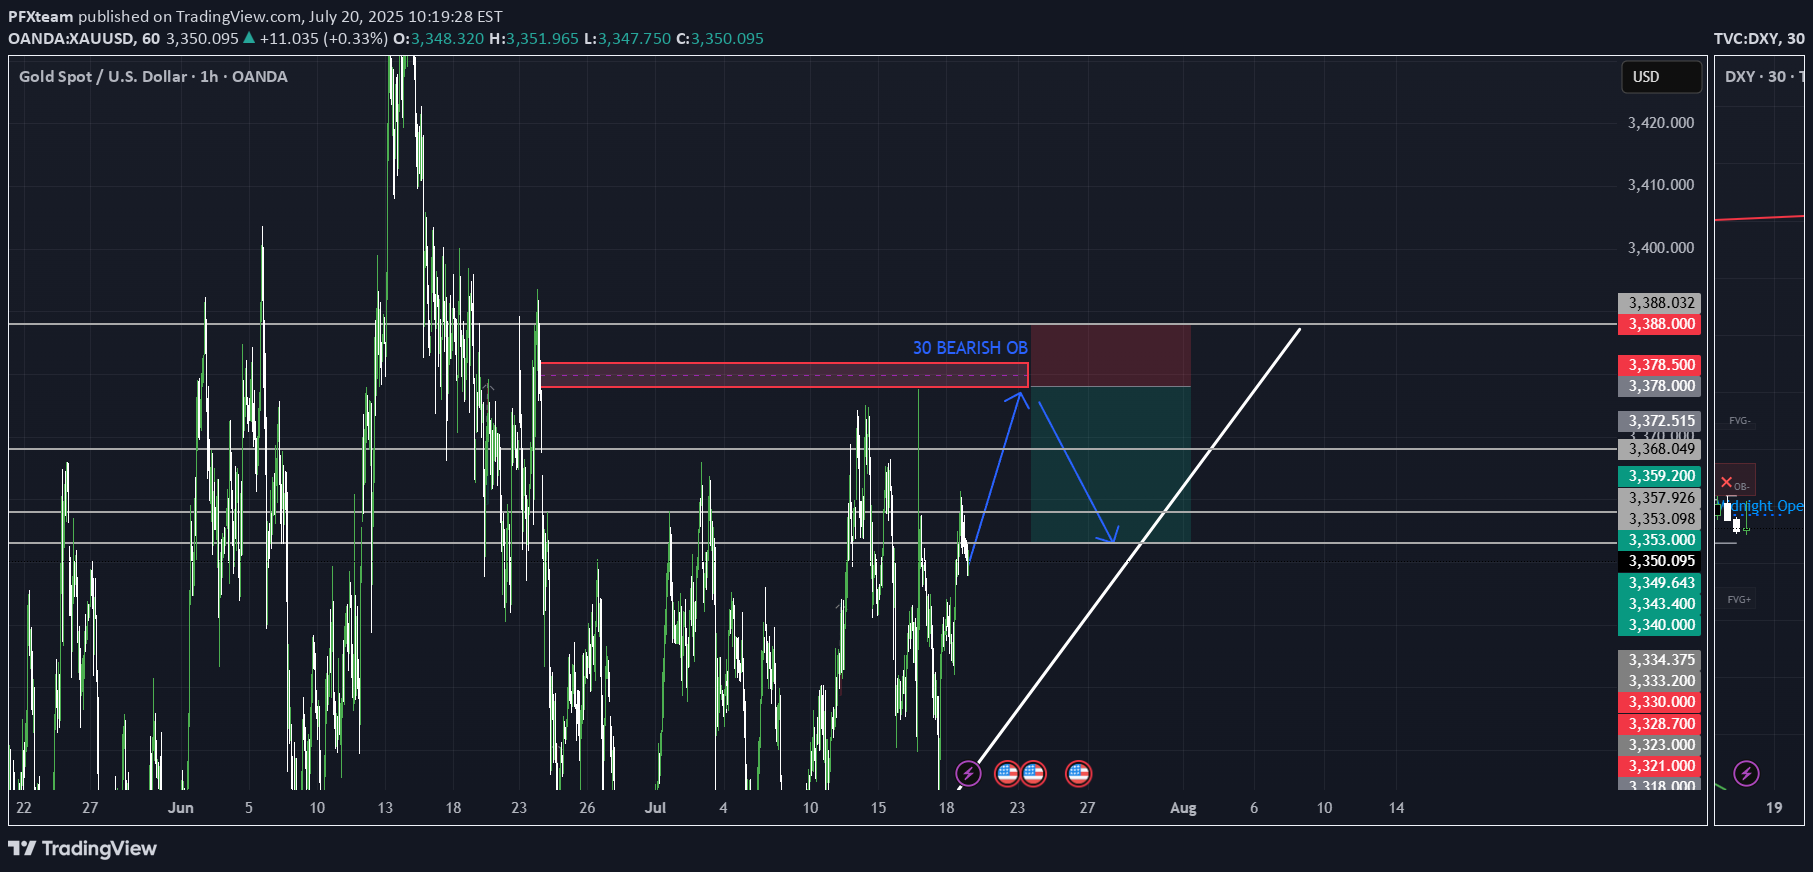
Gold 30M Analysis – Smart Money Setup We've spotted a clean Order Block on the 30-minute timeframe and are planning a sell limit based on smart money principles. The setup offers a solid 2.5R risk-to-reward ratio, making it ideal for those who prefer "set & forget" trades. 📍 ENTRY: 3378 🛑 SL: 3388 (above a previous high) 🎯 TP1: 3368 (1R) 🎯 TP2: 3358 (2R) 🎯 TP3: 3353 (2.5R) We're expecting a reaction from the 30M supply zone after signs of weakening bullish momentum. This is a clean structure-based short opportunity with precise risk management. 📉 🚨 This setup was also shared publicly in our Telegram channel – stay tuned for more! #XAUUSD #Gold #OrderBlock #SmartMoney #SupplyAndDemand #PhoenixFX
PFXteam
BTCUSD At Crucial Pivot Point. Is This The Ceiling? - PhoenixFX
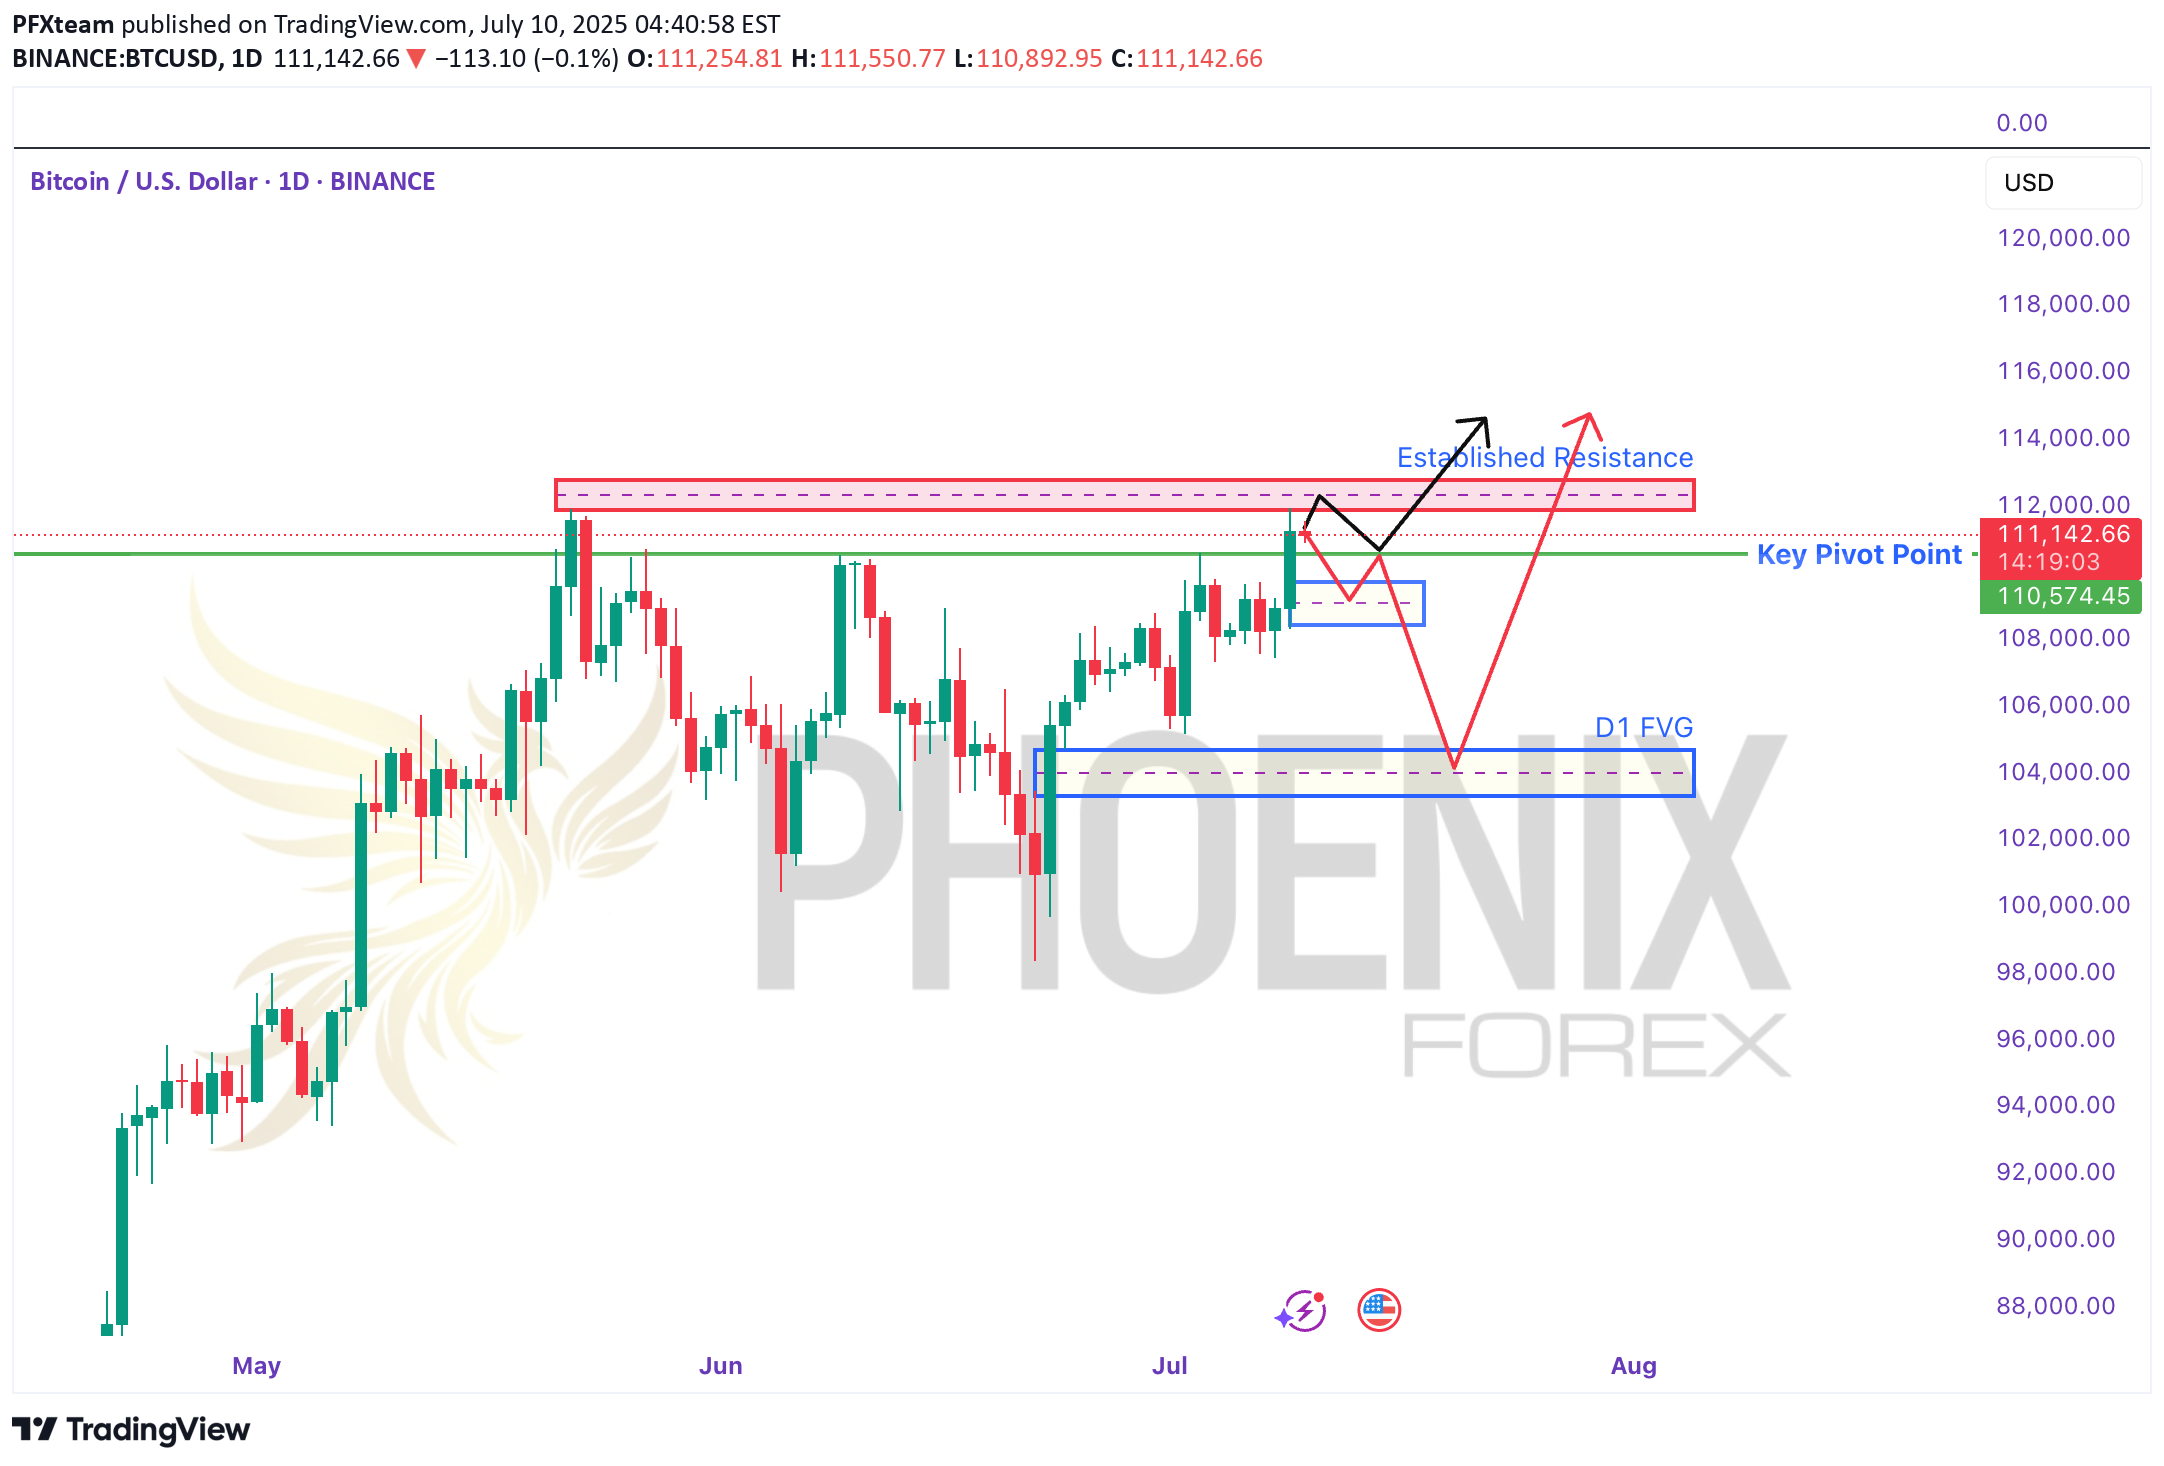
BTCUSD Price-Action Analysis & ScenariosBelow is an overview of the two possible paths for Bitcoin over the coming days, as sketched out by the black and red arrows on your chart. We’ll also highlight the key pivot level and resistance zone that will decide which scenario plays out.🔵 Key Levels to Watch Established Resistance (~$111,800–$112,500) This zone marks multiple failed attempts to break higher in recent weeks. It’s where large stop-runs and sell-side limit orders tend to cluster. A decisive daily close above $112K is required to signal genuine bullish continuation. Daily Pivot Point (~$110,600) Acting as the “battle line” between bulls and bears, this pivot is the first level to confirm market bias. Above $110.6K: Tends to favor buyers, suggesting strength and higher-high attempts. Below $110.6K: Gives the bears the edge, increasing the odds of deeper retracements.📈 Black-Arrow (“Bullish Continuation”) Scenario Break & Hold Above Resistance Price thrusts cleanly above $112K on strong volume. Retest the H4 Order Block (~$111,000–$111,200) A shallow pullback into the highlighted H4 demand zone (blue box) offers a lower-risk long entry. New Highs From there, Bitcoin resumes its uptrend, closing the week with fresh highs above the prior $113K peak. Key Trigger: Sustained daily close above $112K, followed by a successful retest of that level.📉 Red-Arrow (“Bearish Rejection & Dip”) Scenario Rejection at Resistance Price stalls and reverses somewhere between $111,800–$112,500, forming a bearish reversal candle. Drop to Daily FVG Zone (~$104,000–$105,000) This larger Daily Fair-Value Gap (blue box lower on the chart) coincides with strong weekly support—an ideal zone for dip buyers. Recovery Rally After absorbing selling pressure in the FVG, BTC bounces back toward the established resistance, setting up a second test of $112K. Key Trigger: Clear bearish price action (e.g., engulfing or pin-bar) in the $111.8K–$112.5K zone, followed by a daily close below the pivot at $110.6K.🎯 How to Trade These Setups Bullish Entry: Wait for daily close > $112K Enter on pullback into $111K–$111.2K (H4 order block) Stop below $110.6K pivot; target new highs above $113K+ Bearish Entry: Look for bearish reversal signals in $111.8K–$112.5K Enter on break & close below $110.6K pivot Target $104K–$105K (Daily FVG); stop above $112.5K Note: The pivot at $110.6K is your first “line in the sand” for bias—trade in the direction of the break, and use the major resistance zone to confirm strength or failure. Always manage your risk and adjust to how price actually unfolds!Just a Heads-Up:This is my take on the charts—not gospel, not financial advice, and definitely not a crystal ball 🔮. Trading is part skill, part patience, and part “what just happened?” 😅We all see things a little differently, and that’s the beauty of it. So if you’ve got a hot take, wild theory, or just want to drop some chart wisdom—hit the comments!Let’s grow, learn, and laugh through the madness together. 🚀📈Each one, teach one.— Phoenix FX Team 🔥🦅
PFXteam
Gold To The Basement? Week Ahead with Bearish Bias by PhoenixFX
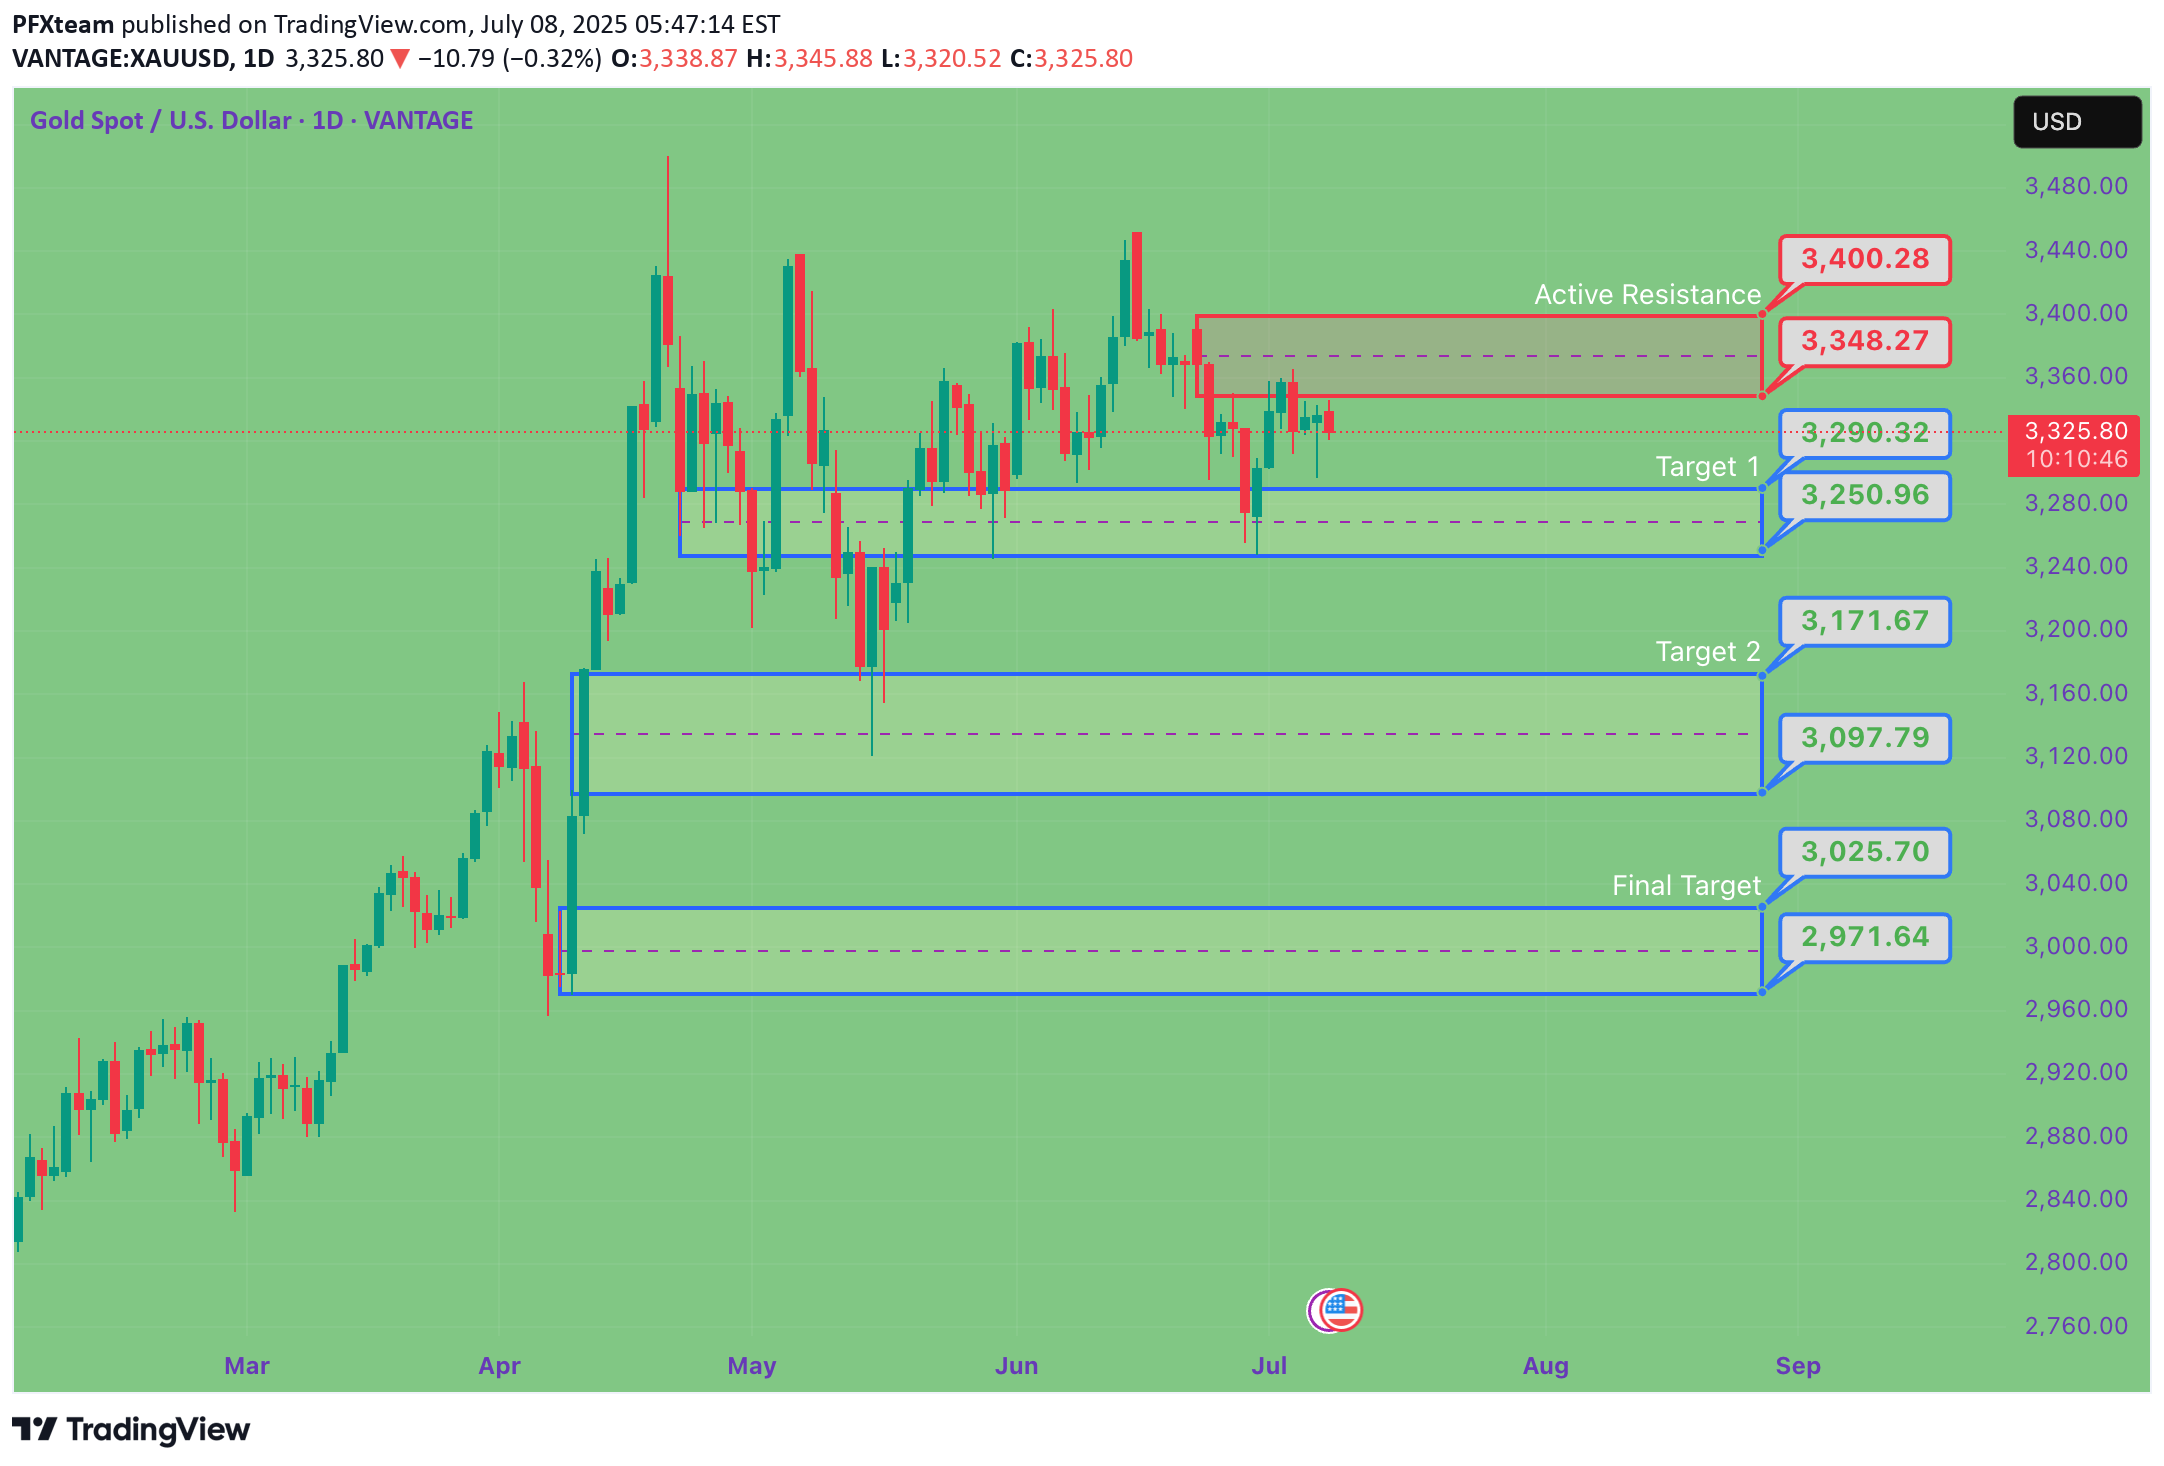
🌟 Welcome to Phoenix FX’s Intraday Pulse! 🌟Hello, Phoenix FX family! 👋 I’m thrilled you’ve joined us for today’s TradingView chart breakdown. Our focus? Intraday opportunities—spotting those high-probability setups you can enter, manage, and leave to run whilst you concentrate on the things you love doing.Here’s what you’ll find in this analysis: Key Levels & Zones: Support, resistance, and Fair Value Gaps that matter on the smaller timeframes. Price-Action Clues: Exact candlestick patterns and momentum signals to watch for your next entry. Trade Triggers & Targets: Clear criteria for when to get in, where to take profits, and how to manage your risk.Whether you’re hunting quick scalps or tactical swing moves, our goal is simple: help you trade with confidence, clarity, and community support. Got a different view or a fresh idea? Drop it in the comments—after all, “each one, teach one.” 😉Let’s dive into the charts and make today’s market moves count! 🚀📈Donald Trump’s presidency continues to exert outsized influence on gold through three main channels: trade policy uncertainty, fiscal stimulus (and resulting deficits), and shifts in safe-haven demand. Here’s how each factor has played out—and what it could mean for gold going forward:1. Trade-War Uncertainty What’s Happening: The Trump administration’s aggressive use of tariffs—including recent 25% duties on goods from Japan and South Korea—has periodically roiled markets and driven investors into gold as a safe haven. On July 7, gold pared losses after tariff news, as traders sought refuge despite a firm dollar. Looking Ahead: If further tariff escalations or retaliations emerge, expect renewed spikes in gold. Conversely, any de-escalation or trade-deal breakthroughs could sap that safe-haven bid.2. Fiscal Stimulus & Deficits What’s Happening: Senate Republicans recently passed a Trump-backed tax‐and‐spending package projected to add $3.3 trillion to the U.S. deficit. Larger deficits—especially when financed by the Fed—tend to stoke inflation expectations, which bolsters gold’s appeal as an inflation hedge. Looking Ahead: Continued large-scale stimulus or fresh tax cuts without offsetting revenue measures could keep real yields low (or negative), a classic tailwind for gold.3. Safe-Haven Flows & Investor Positioning What’s Happening: Despite peaking at record highs earlier this year, gold remains up roughly 30% since November, driven largely by investor fears around Trump’s policy unpredictability and geopolitical tensions. Looking Ahead: Should Trump-era uncertainty persist—whether around trade, foreign policy, or domestic turmoil—gold is likely to retain its status as a portfolio diversifier and crisis hedge. A sustained drop in U.S. real rates or fresh bouts of market volatility would reinforce that trend.🎯 Outlook Summary Bullish Drivers: Ongoing trade-war rhetoric, larger deficits, and any new geopolitical flashpoints. Bearish Risks: Clear resolution of major trade disputes, a pivot by the Fed toward earlier rate cuts (reducing real‐rate support for gold), or diminished investor fear.------------------------------------------------------------------------------------------PhoenixFX price action analysis based on the Daily time frame🔴 Primary Resistance (Daily) Zone: $3,348 – $3,400 Why It Matters: Multiple daily closes have stalled here, leaving a clear Fair-Value Gap (dashed purple). Sellers are likely to defend this range until we see a decisive daily close above $3,400.📉 Bearish Bias – Short Setups Short at Resistance Entry: Bearish daily reversal candle (engulfing, pin-bar) in $3,348–$3,400 Targets: TP1: $3,290 (50% of Primary Buy Zone) TP2: $3,250 (Primary Buy Zone low) TP3: $3,172 (Secondary Buy Zone high) Stop-Loss: Above $3,420 Breakdown Short Trigger: Daily close below $3,250 (Primary Buy Zone low) Entry: On the open of the next daily candle after close below $3,250 Targets: TP1: $3,172 (Secondary Buy Zone) TP2: $3,026 (Final Buy Zone 50% level) Stop-Loss: Above $3,290🔵 Potential Long Opportunities Defensive Long (Aggressive) Entry: Bullish daily rejection candle in $3,250–$3,290 Targets: TP1: $3,348 (short-term resistance) TP2: $3,400 (key resistance) Stop-Loss: Below $3,230 Trend-Reversal Long (Ultra-Conservative) Trigger: Daily close above $3,400 Entry: Open of the next daily candle after the close above $3,400 Targets: TP1: $3,450 TP2: $3,500+ Stop-Loss: Below $3,360📊 Week-Ahead Scenarios Bearish Scenario (High Probability): Price remains capped under $3,400. Look for a bearish signal in $3,348–$3,400 to initiate shorts. A break below $3,250 extends the move into deeper demand zones ($3,172 → $3,026). Bullish Counter-Trend (Lower Probability): Strong daily rejection candle in $3,250–$3,290 could spark a relief rally. Short-term longs can target $3,348 and $3,400—ideal for quick swing trades. Only a sustained daily close above $3,400 shifts the bias back to the upside.Just a Heads-Up:This is my take on the charts—not gospel, not financial advice, and definitely not a crystal ball 🔮.Trading is part skill, part patience, and part “what just happened?” 😅We all see things a little differently, and that’s the beauty of it. So if you’ve got a hot take, wild theory, or just want to drop some chart wisdom—hit the comments!Let’s grow, learn, and laugh through the madness together. 🚀📈Each one, teach one.— Phoenix FX Team 🔥🦅Target 1 achieved. Waiting for the next push down!! It's not to late to get involved. Have a good read of the analysis.
PFXteam
Will BTCUSD see $90,000 ever again? Phoenix FX mid term analysis
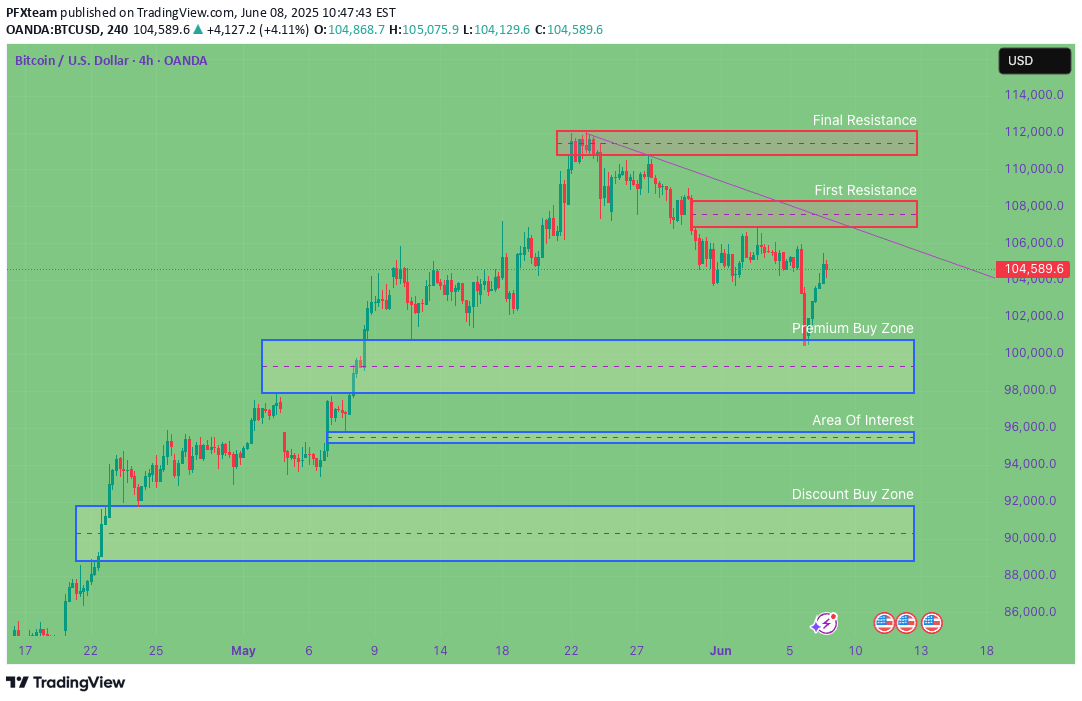
BTCUSD 4-Hour Outlook: The Week Ahead🔴 Key Resistance ZonesFirst Resistance $107 000–$108 500Recent swing highs where price stalled before the last leg down. Clearing and closing above $105 000 on the 4H would open the door toward this zone.Final Resistance$111 000–$113 000 (If broken expect a run to $115,000)The all-time-high area. Heavy sell-side liquidity lives here and past price action shows repeated FVG fills and wicks into this region.🔵 Critical Support & Buy ZonesDiscount Buy Zone: $92 000–$89 000 (50% at $89 150)A deeper weekly FVG and longer-term trend support. The ultimate “buy the dip” area if the premium zone gives way.Premium Buy Zone: $100 000 – $99 000 (50% at $99 450)A 4H Fair Value Gap that aligns with our higher-timeframe trend support. The recent bounce here signals strength—and a possible launchpad back into resistance.📊 Weekly Price Action Scenarios Bullish Theory:If BTC can close cleanly above $105 000 on the 4H, look for a run into $107 000–$108 500 (First Resistance). A follow-through push could then target $111 000–$113 000 (Final Resistance) by week’s end with a potential further move to $115 000 where the 8 year trend will be tested again. Bearish Theory:Failure to reclaim $105 000, or a clear rejection in the $107 000–$108 500 zone, could usher in a retest of the Premium Buy Zone (~$100 000). A break below $99 000 would shift focus toward the Discount Buy Zone around $92 000–$89 000.💡 Trade Ideas for the WeekPotential Long IdeasEntry: 4H candle close above $105 000Targets: First take-profit at $108 500; stretch target $112 000–$113 000Stop-Loss: Below $103 000Zone Re-Entry LongEntry: Bullish 4H candle close in $100 000–$99 000Targets: $107 000 then $112 000Stop-Loss: Below $97 500Potential Short IdeasEntry: Bearish price action (e.g., engulfing candle or wick rejection) in $107 000–$108 500Targets: $100 000→$92 000Stop-Loss: Above $109 000Just a Heads-Up:This is my take on the charts—not gospel, not financial advice, and definitely not a crystal ball 🔮.Trading is part skill, part patience, and part “what just happened?” 😅We all see things a little differently, and that’s the beauty of it.So if you’ve got a hot take, wild theory, or just want to drop some chart wisdom—hit the comments!Let’s grow, learn, and laugh through the madness together. 🚀📈Each one, teach one.— Phoenix FX Team 🔥🦅
PFXteam
XAUUSD Medium Term analysis. Are we super bearish? June 9th 2025
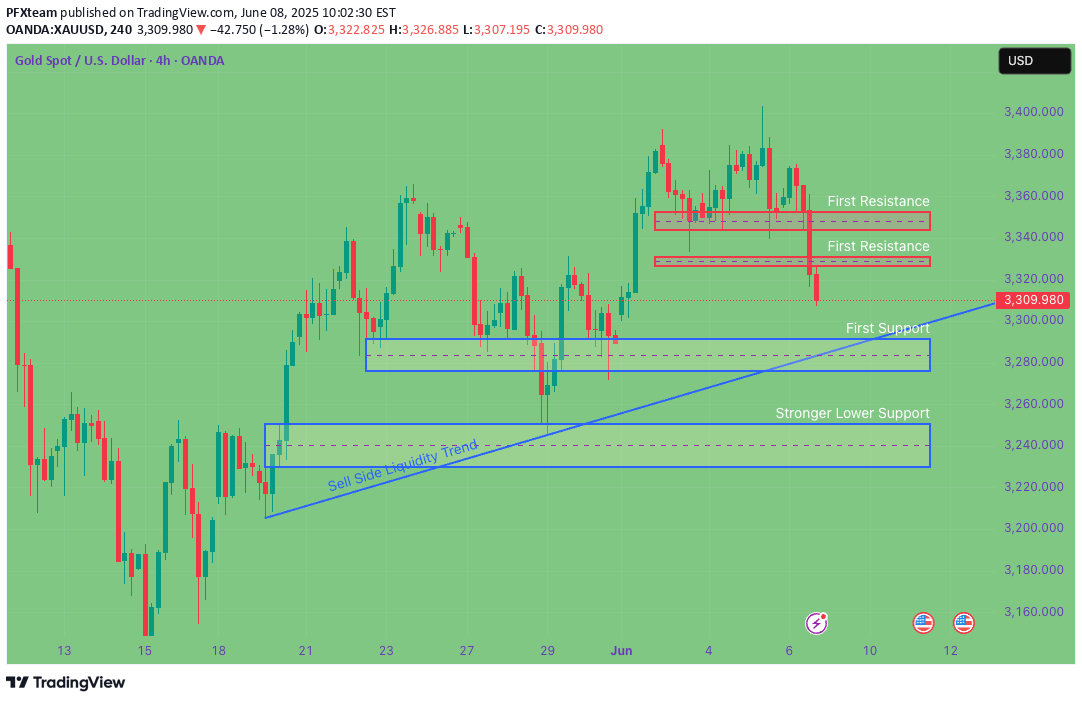
XAUUSD Gold's latest trend analysis and strategy on June 9:Basic logic analysis:Decrease in risk aversion:Easing trade tensions between China and the US are weakening short-term demand for gold as a safe haven, but long-term uncertainties (such as the outlook for global economic recovery and Federal Reserve policies) still support gold's safe-haven properties.Bearish technical bias dominates:Weekly chart: Inverted hammer candlestick + negative MACD crossover at high levels, indicating a risk of correction.Daily chart: Two consecutive bearish candles broke the short moving averages, MACD crossover is negative, but beware of the strength of the mid-Bollinger band support (near 3295).4-hour timeframe: The price broke the lower Bollinger Band, the moving averages indicate a downtrend, and the MACD momentum is trending down, reinforcing the short-term negative outlook.Important price levels:Upper resistance:First resistance: 3328-3330 (represents the dividing line between strength and weakness during the day, and a bearish pressure point).Strong resistance: 3345-3350 (if broken, the short-term negative outlook may be reversed).Bottom support:First support: 3290-3280 (test target at the beginning of the week, may lead to a rebound).Strong support: 3280 (if broken, it may open the way to a decline towards 3250-3230).Trading Strategy Suggestions:Opportunity to sell (short positions):Aggressive: Sell with light positions after the rebound to 3325-3330, stop loss above 3340, target 3300-3290.Conservative: Wait for price pressure in the 3340-3345 area before entering, stop loss at 3355, target as above.Buying Opportunity (Long Positions):Short-term bounce: If the price touches 3280-3290 and stabilizes (without a quick break down), a short position can be entered, stop loss at 3275, and target 3310-3320.Bounce after break: If the 3280 level is broken quickly and then rebounds under pressure at 3295-3300, a short trade can be entered again.Break above 3350: Temporarily close short positions, wait to see if the price will retest support before switching to buying.Break below 3275: Be cautious when chasing the decline, as a technical rebound from lower levels may occur, so it is advisable to wait for a rebound before selling again.Data Risk: The market may experience high volatility before and after the release of non-farm payrolls data, and caution is advised against sharp fluctuations.Sudden Events: Any unexpected changes in geopolitics or Fed policy expectations could lead to a reversal of technical trends.Position Management: Although the current trend is downward, it has not been confirmed as a single trend. Therefore, it is recommended to trade with light positions in stages, and avoid entering heavy positions in a specific direction.Gold is likely to continue its volatile trend with a downward bias over the coming week, but beware of bullish attacks at key support levels. The primary trading strategy is to sell at high retracement points, with strategic support from light buying at key support levels, while adhering to stop losses and monitoring news developments.Just a Heads-Up:This is my take on the charts—not gospel, not financial advice, and definitely not a crystal ball 🔮. Trading is part skill, part patience, and part “what just happened?” 😅We all see things a little differently, and that’s the beauty of it. So if you’ve got a hot take, wild theory, or just want to drop some chart wisdom—hit the comments!Let’s grow, learn, and laugh through the madness together. 🚀📈Each one, teach one.— Phoenix FX Team 🔥🦅
PFXteam
BTCUSD HTF cycle analysis

Hi, I’m from Phoenix FX, and today I’ll be sharing my perspective on Bitcoin (BTC) price action based on the higher timeframes.I’ll also give you my outlook on potential trade setups for today and tomorrow. Please remember that this is not financial advice—use this information as a guide only. If you find it helpful, don’t forget to like and share it with your like-minded communities.Higher Timeframe AnalysisIn my view, BTC tends to follow clear bullish and bearish cycle zones. Typically, we see a pump to new all-time highs (ATH), followed by the formation of resistance and a retracement down to a key support level. Our trading approach focuses on identifying those critical support and resistance levels, with some interim trades based on shorter-term analysis—occasionally even counter-trend, depending on the day’s market bias.Over the past eight years, BTC has respected a major trend resistance line. The most recent ATH, around $112K, reconfirmed the relevance of this trendline. This makes it a valuable tool for projecting future ATH levels.Looking ahead, I expect a move towards the $115K level in the coming weeks. This would likely act as a point of resistance, at which stage we might see a reversal and a drop back down to a key support zone.Trade SetupThe chart I'm referencing highlights what I would consider the first premium buy zone, identified using a 4-hour Fair Value Gap (FVG).The 50% level of this zone sits at $99,450. If this zone fails to hold, we may drop further to the secondary premium buy zone, which aligns with our higher timeframe (HTF) trend support and a weekly FVG. The 50% level of this deeper zone is around $89,150.A potential long entry at $92,550, with a stop loss around $88,000, offers an excellent risk-to-reward (RR) ratio, targeting a move up to the $115K level.Intraday OutlookFor today, I see bearish price action, with potential rejection around the $104,300–$105,000 range. Go short around the $104,750 to $105,000 zoneThis could lead to a move down toward the lower key zones highlighted in the HTF analysis.I recommend taking partial profits (TP) at every $1,000 increment and setting your stop loss to breakeven (BE) after hitting the first target.Final ThoughtsPrice action analysis is always subjective, so I’d love to hear your thoughts and ideas in the comments—each one, teach one.Thanks for giving me some of your time.From the Phoenix FX team, have a great weekend!
PFXteam
BTCUSD Price action analysis on HTF

Hi, I’m from Phoenix FX, and today I’ll be sharing my perspective on Bitcoin (BTC) price action based on the higher timeframes. I’ll also give you my outlook on potential trade setups for today and tomorrow. Please remember that this is not financial advice—use this information as a guide only. If you find it helpful, don’t forget to like and share it with your like-minded communities.Higher Timeframe AnalysisIn my view, BTC tends to follow clear bullish and bearish cycle zones. Typically, we see a pump to new all-time highs (ATH), followed by the formation of resistance and a retracement down to a key support level. Our trading approach focuses on identifying those critical support and resistance levels, with some interim trades based on shorter-term analysis—occasionally even counter-trend, depending on the day’s market bias.Over the past eight years, BTC has respected a major trend resistance line. The most recent ATH, around $112K, reconfirmed the relevance of this trendline. This makes it a valuable tool for projecting future ATH levels.Looking ahead, I expect a move towards the $115K level in the coming weeks. This would likely act as a point of resistance, at which stage we might see a reversal and a drop back down to a key support zone.Trade SetupThe chart I'm referencing highlights what I would consider the first premium buy zone, identified using a 4-hour Fair Value Gap (FVG).The 50% level of this zone sits at $99,450. If this zone fails to hold, we may drop further to the secondary premium buy zone, which aligns with our higher timeframe (HTF) trend support and a weekly FVG. The 50% level of this deeper zone is around $89,150.A potential long entry at $92,550, with a stop loss around $88,000, offers an excellent risk-to-reward (RR) ratio, targeting a move up to the $115K level.Intraday OutlookFor today, I see bearish price action, with potential rejection around the $104,300–$105,000 range. Go short around the $104,750 to $105,000 zoneThis could lead to a move down toward the lower key zones highlighted in the HTF analysis.I recommend taking partial profits (TP) at every $1,000 increment and setting your stop loss to breakeven (BE) after hitting the first target.Final ThoughtsPrice action analysis is always subjective, so I’d love to hear your thoughts and ideas in the comments—each one, teach one.Thanks for giving me some of your time.From the Phoenix FX team, have a great weekend!
PFXteam
BTC HTF price action analysis byPhoenix FX

Hi, I’m from Phoenix FX, and today I’ll be sharing my perspective on Bitcoin (BTC) price action based on the higher timeframes. I’ll also give you my outlook on potential trade setups for today. Please remember that this is not financial advice—use this information as a guide only. If you find it helpful, don’t forget to like and share it with your like-minded communities.Higher Timeframe AnalysisIn my view, BTC tends to follow clear bullish and bearish cycles. Typically, we see a pump to new all-time highs (ATH), followed by the formation of resistance and a retracement down to a key support level. Our trading approach focuses on identifying those critical support and resistance levels, with some interim trades based on shorter-term analysis—occasionally even counter-trend, depending on the day’s market bias.Over the past eight years, BTC has respected a major trend resistance line. The most recent ATH, around $112K, reconfirmed the relevance of this trendline. This makes it a valuable tool for projecting future ATH levels.Looking ahead, I expect a move towards the $115K level in the coming weeks. This would likely act as a point of resistance, at which stage we might see a reversal and a drop back down to a key support zone.Trade SetupThe chart I'm referencing highlights what I would consider the first premium buy zone, identified using a 4-hour Fair Value Gap (FVG). The 50% level of this zone sits at $99,450. If this zone fails to hold, we may drop further to the secondary discount buy zone, which aligns with our higher timeframe (HTF) trend support and a weekly FVG. The 50% level of this deeper zone is around $89,150.A potential long entry at $99,450, with a stop loss around $88,000, offers an excellent risk-to-reward (RR) ratio, targeting a move up to the $115K level.Intraday OutlookFor today, I see bearish price action, with potential rejection around the $104,300–$105,000 range. This could lead to a move down toward the lower key zones highlighted in the HTF analysis. I recommend taking partial profits (TP) at every $1,000 increment and setting your stop loss to breakeven (BE) after hitting the first target.Final ThoughtsPrice action analysis is always subjective, so I’d love to hear your thoughts and ideas in the comments—each one, teach one.Thanks for giving me some of your time.From the Phoenix FX team, have a great weekend!
Disclaimer
Any content and materials included in Sahmeto's website and official communication channels are a compilation of personal opinions and analyses and are not binding. They do not constitute any recommendation for buying, selling, entering or exiting the stock market and cryptocurrency market. Also, all news and analyses included in the website and channels are merely republished information from official and unofficial domestic and foreign sources, and it is obvious that users of the said content are responsible for following up and ensuring the authenticity and accuracy of the materials. Therefore, while disclaiming responsibility, it is declared that the responsibility for any decision-making, action, and potential profit and loss in the capital market and cryptocurrency market lies with the trader.