Technical analysis by PFXteam about Symbol BTC on 7/10/2025

PFXteam
BTCUSD At Crucial Pivot Point. Is This The Ceiling? - PhoenixFX
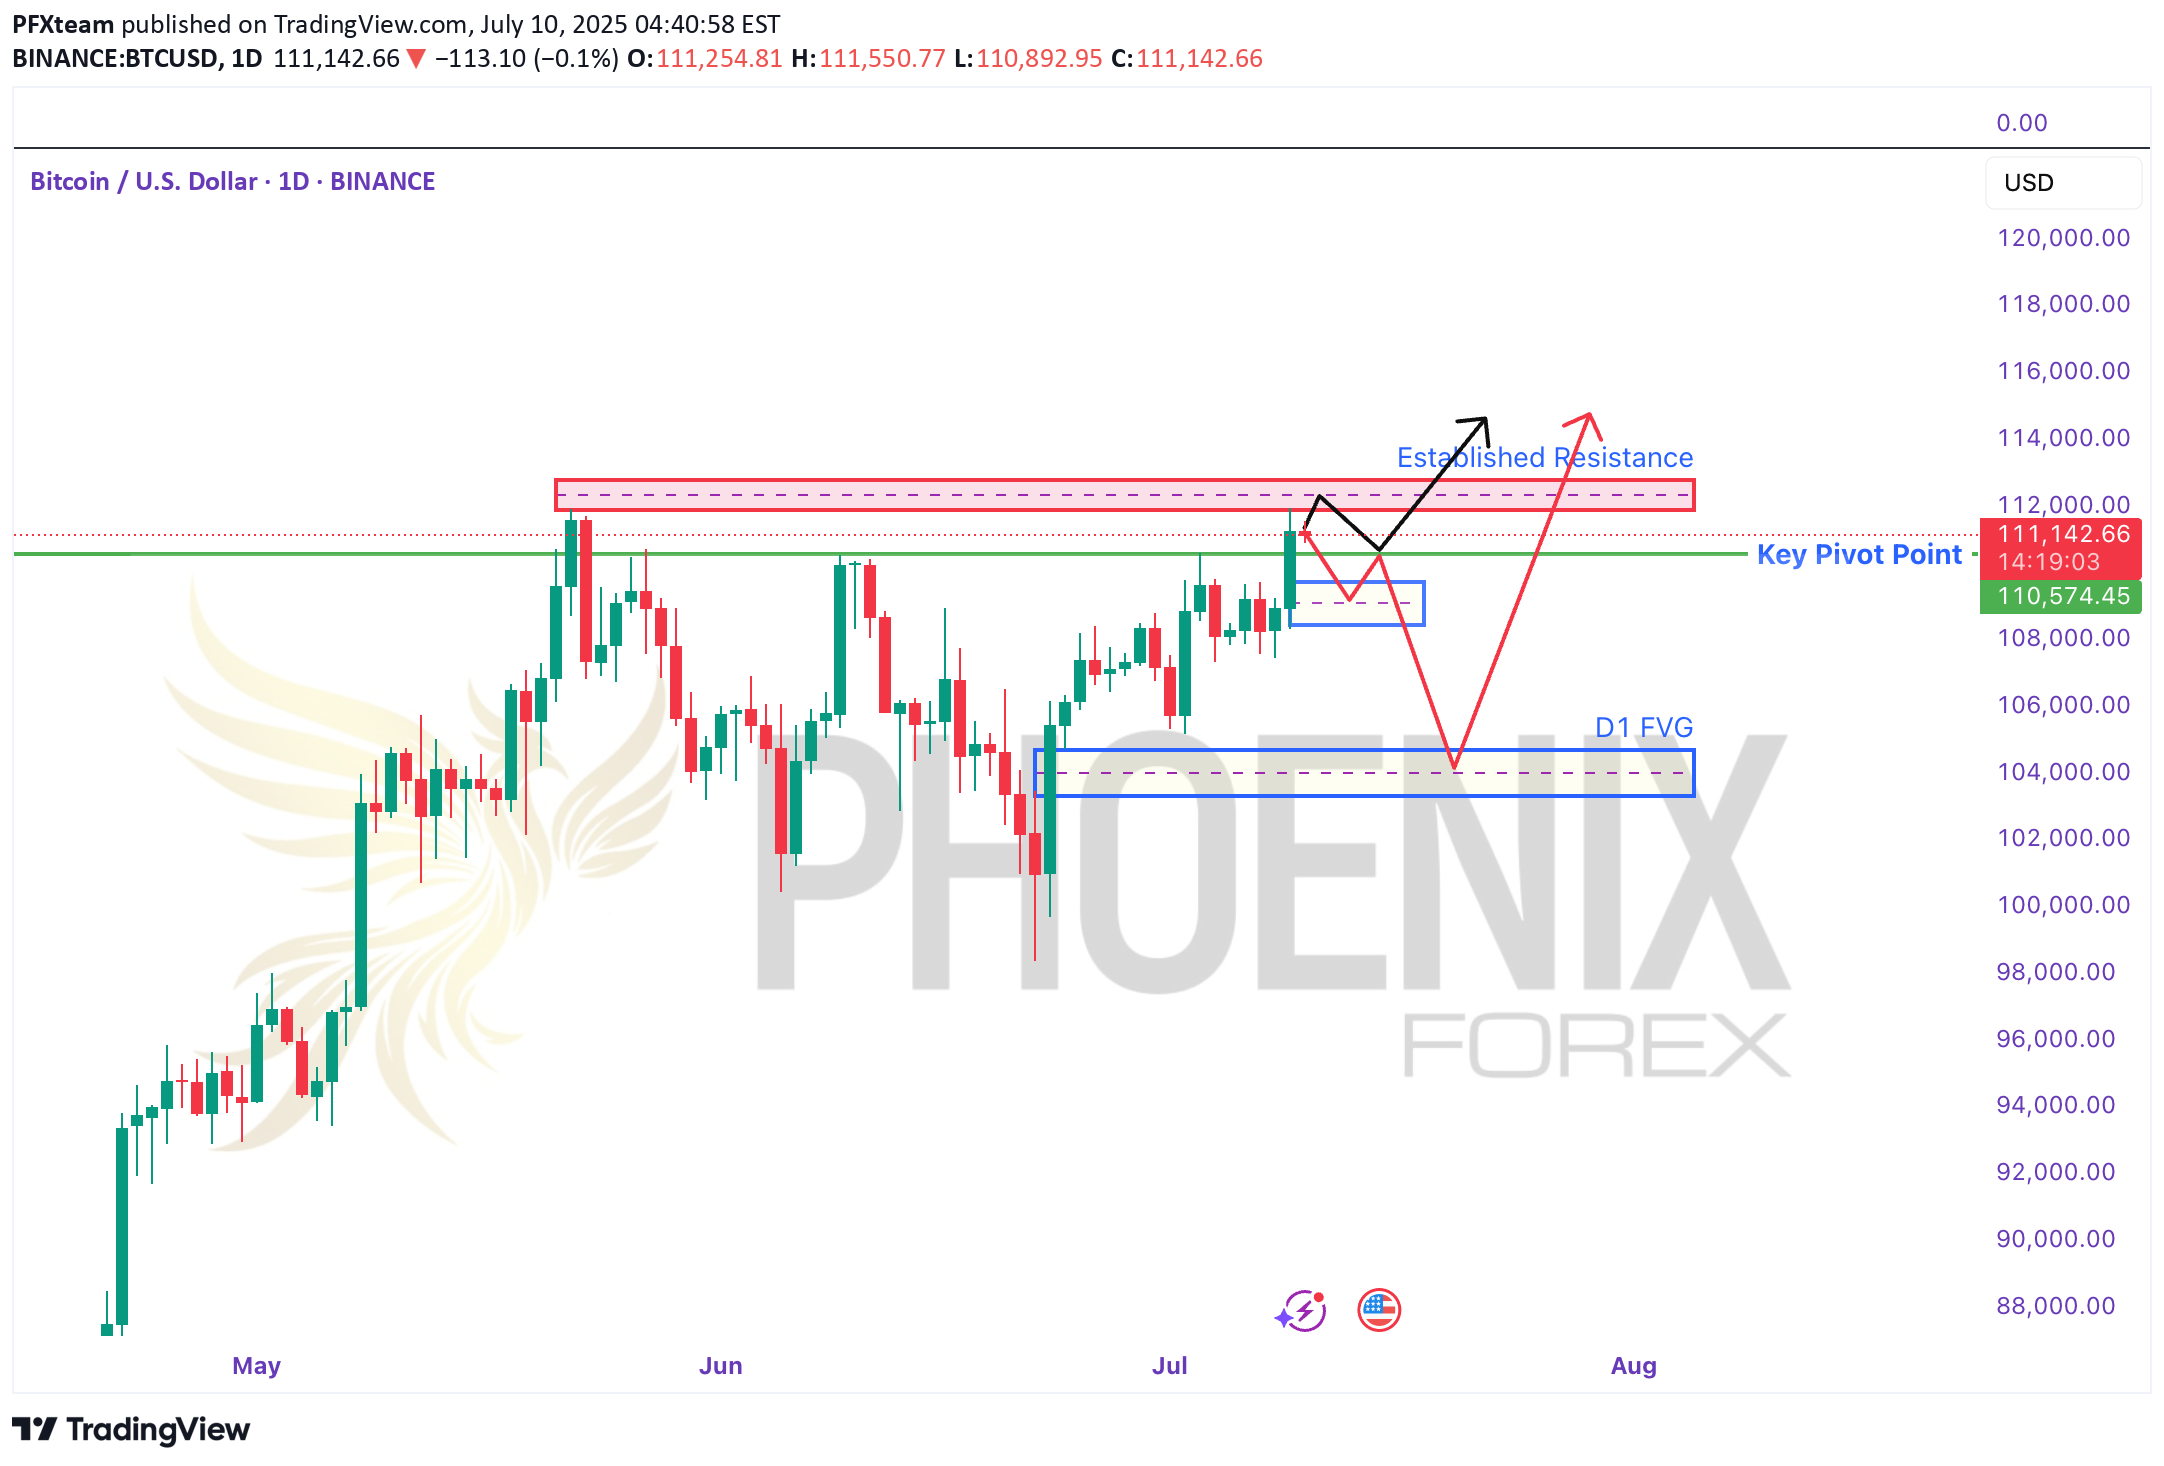
BTCUSD Price-Action Analysis & ScenariosBelow is an overview of the two possible paths for Bitcoin over the coming days, as sketched out by the black and red arrows on your chart. We’ll also highlight the key pivot level and resistance zone that will decide which scenario plays out.🔵 Key Levels to Watch Established Resistance (~$111,800–$112,500) This zone marks multiple failed attempts to break higher in recent weeks. It’s where large stop-runs and sell-side limit orders tend to cluster. A decisive daily close above $112K is required to signal genuine bullish continuation. Daily Pivot Point (~$110,600) Acting as the “battle line” between bulls and bears, this pivot is the first level to confirm market bias. Above $110.6K: Tends to favor buyers, suggesting strength and higher-high attempts. Below $110.6K: Gives the bears the edge, increasing the odds of deeper retracements.📈 Black-Arrow (“Bullish Continuation”) Scenario Break & Hold Above Resistance Price thrusts cleanly above $112K on strong volume. Retest the H4 Order Block (~$111,000–$111,200) A shallow pullback into the highlighted H4 demand zone (blue box) offers a lower-risk long entry. New Highs From there, Bitcoin resumes its uptrend, closing the week with fresh highs above the prior $113K peak. Key Trigger: Sustained daily close above $112K, followed by a successful retest of that level.📉 Red-Arrow (“Bearish Rejection & Dip”) Scenario Rejection at Resistance Price stalls and reverses somewhere between $111,800–$112,500, forming a bearish reversal candle. Drop to Daily FVG Zone (~$104,000–$105,000) This larger Daily Fair-Value Gap (blue box lower on the chart) coincides with strong weekly support—an ideal zone for dip buyers. Recovery Rally After absorbing selling pressure in the FVG, BTC bounces back toward the established resistance, setting up a second test of $112K. Key Trigger: Clear bearish price action (e.g., engulfing or pin-bar) in the $111.8K–$112.5K zone, followed by a daily close below the pivot at $110.6K.🎯 How to Trade These Setups Bullish Entry: Wait for daily close > $112K Enter on pullback into $111K–$111.2K (H4 order block) Stop below $110.6K pivot; target new highs above $113K+ Bearish Entry: Look for bearish reversal signals in $111.8K–$112.5K Enter on break & close below $110.6K pivot Target $104K–$105K (Daily FVG); stop above $112.5K Note: The pivot at $110.6K is your first “line in the sand” for bias—trade in the direction of the break, and use the major resistance zone to confirm strength or failure. Always manage your risk and adjust to how price actually unfolds!Just a Heads-Up:This is my take on the charts—not gospel, not financial advice, and definitely not a crystal ball 🔮. Trading is part skill, part patience, and part “what just happened?” 😅We all see things a little differently, and that’s the beauty of it. So if you’ve got a hot take, wild theory, or just want to drop some chart wisdom—hit the comments!Let’s grow, learn, and laugh through the madness together. 🚀📈Each one, teach one.— Phoenix FX Team 🔥🦅