Technical analysis by PFXteam about Symbol PAXG: Sell recommendation (7/8/2025)

PFXteam
Gold To The Basement? Week Ahead with Bearish Bias by PhoenixFX
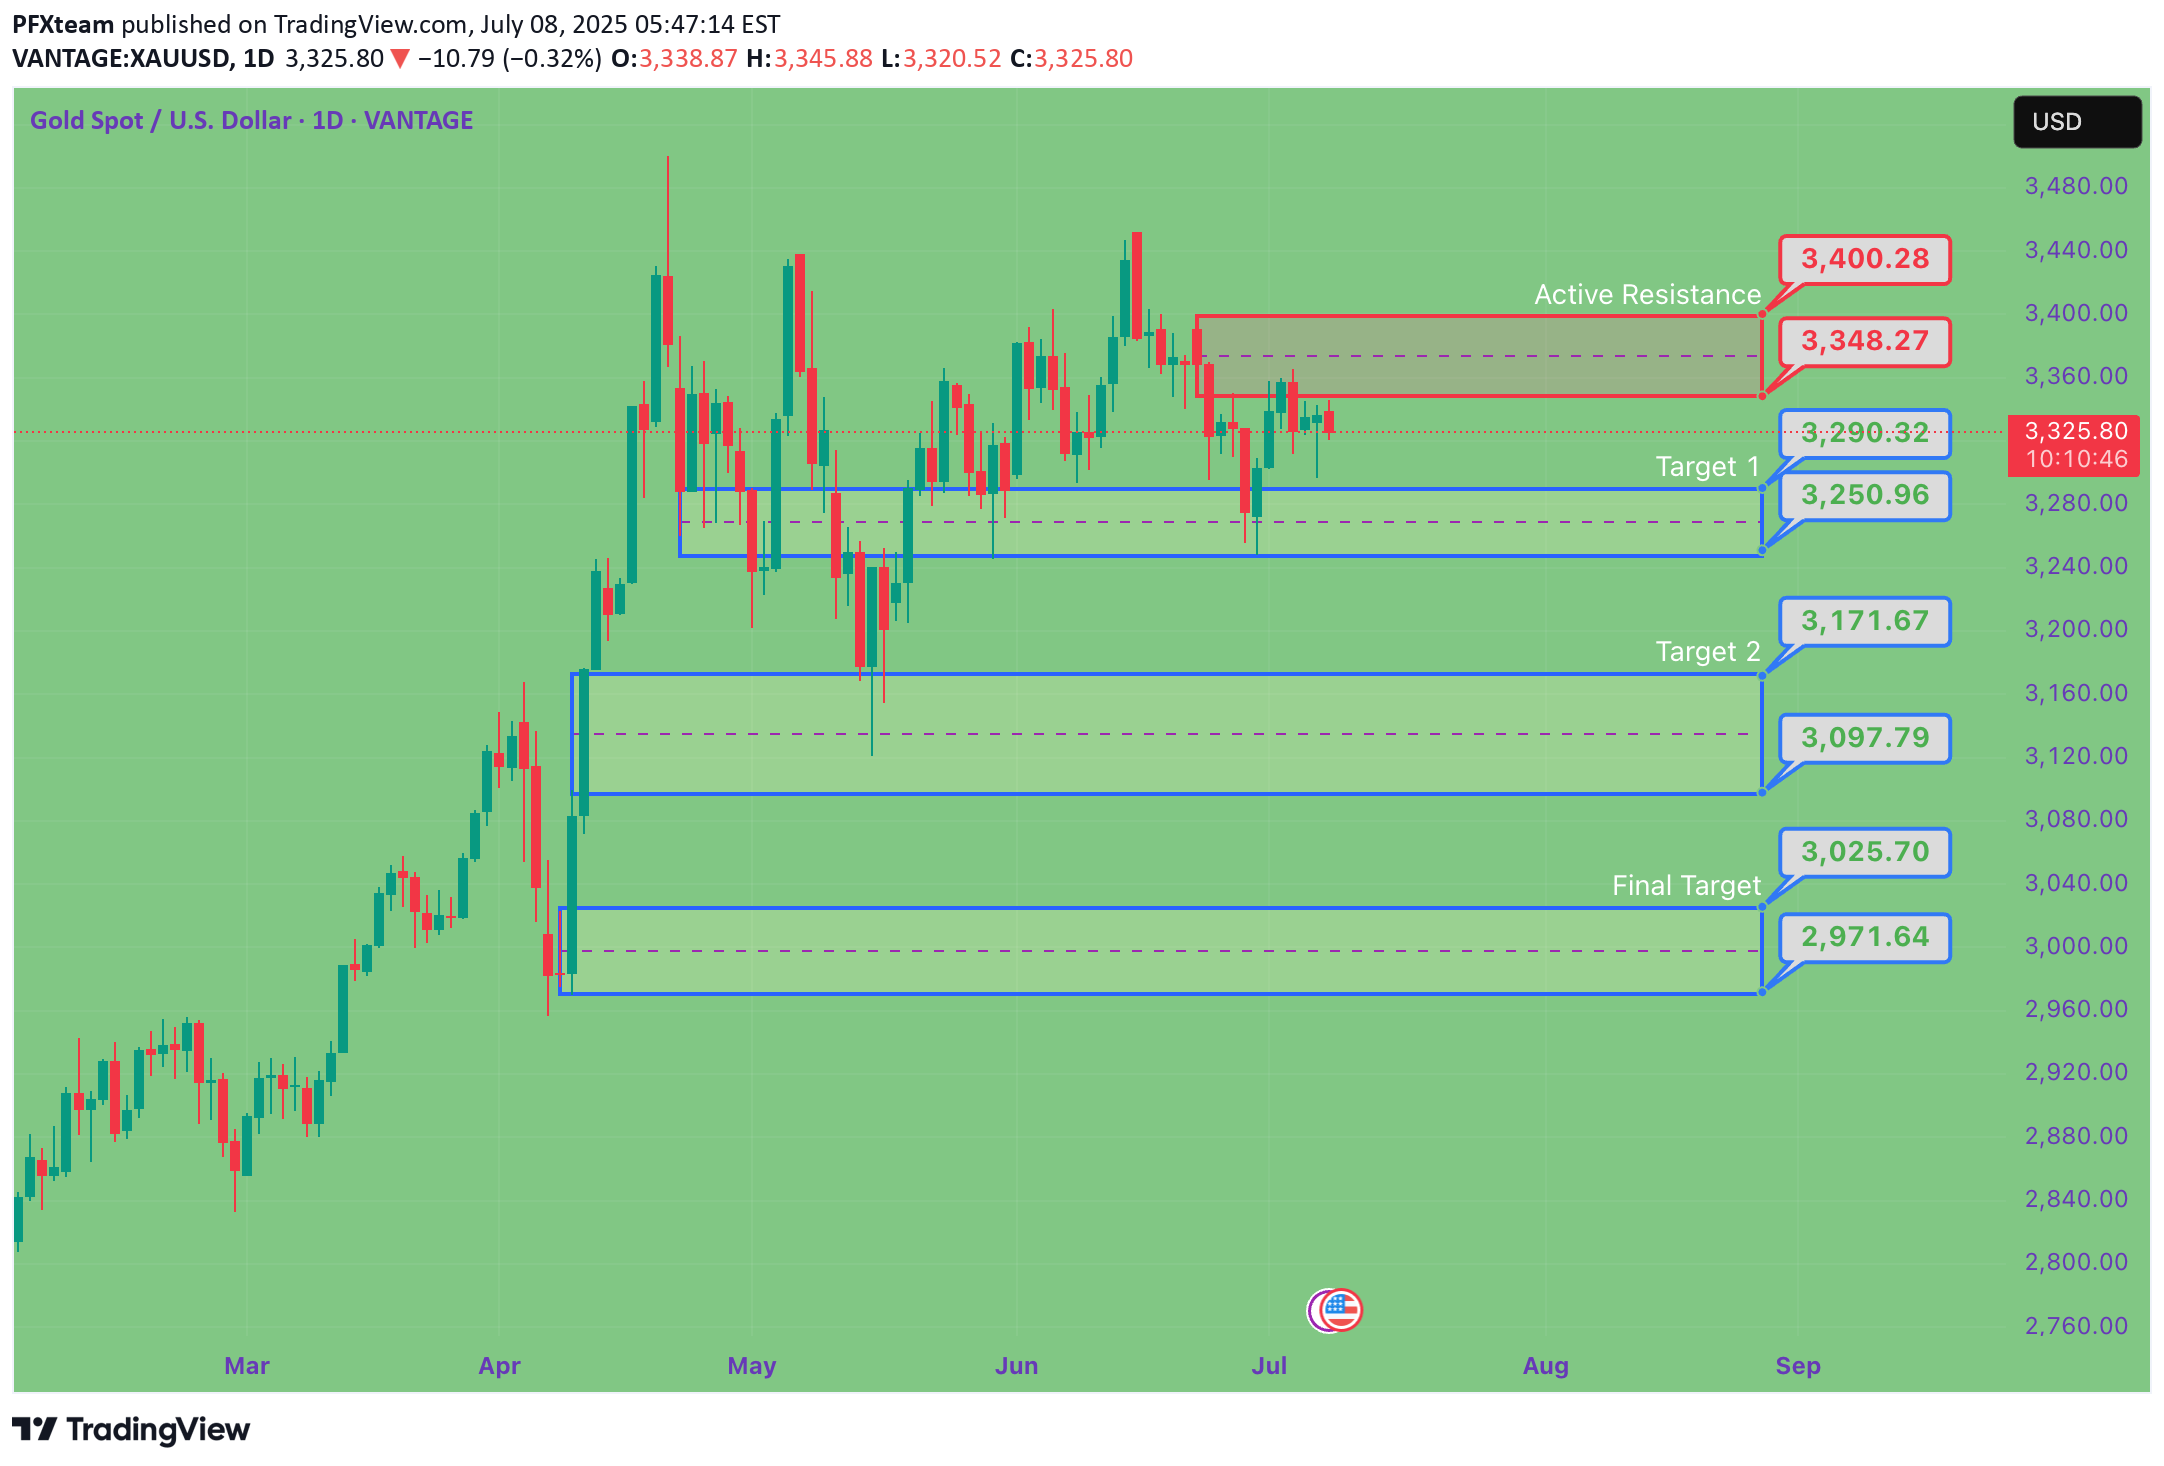
🌟 Welcome to Phoenix FX’s Intraday Pulse! 🌟Hello, Phoenix FX family! 👋 I’m thrilled you’ve joined us for today’s TradingView chart breakdown. Our focus? Intraday opportunities—spotting those high-probability setups you can enter, manage, and leave to run whilst you concentrate on the things you love doing.Here’s what you’ll find in this analysis: Key Levels & Zones: Support, resistance, and Fair Value Gaps that matter on the smaller timeframes. Price-Action Clues: Exact candlestick patterns and momentum signals to watch for your next entry. Trade Triggers & Targets: Clear criteria for when to get in, where to take profits, and how to manage your risk.Whether you’re hunting quick scalps or tactical swing moves, our goal is simple: help you trade with confidence, clarity, and community support. Got a different view or a fresh idea? Drop it in the comments—after all, “each one, teach one.” 😉Let’s dive into the charts and make today’s market moves count! 🚀📈Donald Trump’s presidency continues to exert outsized influence on gold through three main channels: trade policy uncertainty, fiscal stimulus (and resulting deficits), and shifts in safe-haven demand. Here’s how each factor has played out—and what it could mean for gold going forward:1. Trade-War Uncertainty What’s Happening: The Trump administration’s aggressive use of tariffs—including recent 25% duties on goods from Japan and South Korea—has periodically roiled markets and driven investors into gold as a safe haven. On July 7, gold pared losses after tariff news, as traders sought refuge despite a firm dollar. Looking Ahead: If further tariff escalations or retaliations emerge, expect renewed spikes in gold. Conversely, any de-escalation or trade-deal breakthroughs could sap that safe-haven bid.2. Fiscal Stimulus & Deficits What’s Happening: Senate Republicans recently passed a Trump-backed tax‐and‐spending package projected to add $3.3 trillion to the U.S. deficit. Larger deficits—especially when financed by the Fed—tend to stoke inflation expectations, which bolsters gold’s appeal as an inflation hedge. Looking Ahead: Continued large-scale stimulus or fresh tax cuts without offsetting revenue measures could keep real yields low (or negative), a classic tailwind for gold.3. Safe-Haven Flows & Investor Positioning What’s Happening: Despite peaking at record highs earlier this year, gold remains up roughly 30% since November, driven largely by investor fears around Trump’s policy unpredictability and geopolitical tensions. Looking Ahead: Should Trump-era uncertainty persist—whether around trade, foreign policy, or domestic turmoil—gold is likely to retain its status as a portfolio diversifier and crisis hedge. A sustained drop in U.S. real rates or fresh bouts of market volatility would reinforce that trend.🎯 Outlook Summary Bullish Drivers: Ongoing trade-war rhetoric, larger deficits, and any new geopolitical flashpoints. Bearish Risks: Clear resolution of major trade disputes, a pivot by the Fed toward earlier rate cuts (reducing real‐rate support for gold), or diminished investor fear.------------------------------------------------------------------------------------------PhoenixFX price action analysis based on the Daily time frame🔴 Primary Resistance (Daily) Zone: $3,348 – $3,400 Why It Matters: Multiple daily closes have stalled here, leaving a clear Fair-Value Gap (dashed purple). Sellers are likely to defend this range until we see a decisive daily close above $3,400.📉 Bearish Bias – Short Setups Short at Resistance Entry: Bearish daily reversal candle (engulfing, pin-bar) in $3,348–$3,400 Targets: TP1: $3,290 (50% of Primary Buy Zone) TP2: $3,250 (Primary Buy Zone low) TP3: $3,172 (Secondary Buy Zone high) Stop-Loss: Above $3,420 Breakdown Short Trigger: Daily close below $3,250 (Primary Buy Zone low) Entry: On the open of the next daily candle after close below $3,250 Targets: TP1: $3,172 (Secondary Buy Zone) TP2: $3,026 (Final Buy Zone 50% level) Stop-Loss: Above $3,290🔵 Potential Long Opportunities Defensive Long (Aggressive) Entry: Bullish daily rejection candle in $3,250–$3,290 Targets: TP1: $3,348 (short-term resistance) TP2: $3,400 (key resistance) Stop-Loss: Below $3,230 Trend-Reversal Long (Ultra-Conservative) Trigger: Daily close above $3,400 Entry: Open of the next daily candle after the close above $3,400 Targets: TP1: $3,450 TP2: $3,500+ Stop-Loss: Below $3,360📊 Week-Ahead Scenarios Bearish Scenario (High Probability): Price remains capped under $3,400. Look for a bearish signal in $3,348–$3,400 to initiate shorts. A break below $3,250 extends the move into deeper demand zones ($3,172 → $3,026). Bullish Counter-Trend (Lower Probability): Strong daily rejection candle in $3,250–$3,290 could spark a relief rally. Short-term longs can target $3,348 and $3,400—ideal for quick swing trades. Only a sustained daily close above $3,400 shifts the bias back to the upside.Just a Heads-Up:This is my take on the charts—not gospel, not financial advice, and definitely not a crystal ball 🔮.Trading is part skill, part patience, and part “what just happened?” 😅We all see things a little differently, and that’s the beauty of it. So if you’ve got a hot take, wild theory, or just want to drop some chart wisdom—hit the comments!Let’s grow, learn, and laugh through the madness together. 🚀📈Each one, teach one.— Phoenix FX Team 🔥🦅Target 1 achieved. Waiting for the next push down!! It's not to late to get involved. Have a good read of the analysis.