
Options360
@t_Options360

What symbols does the trader recommend buying?
Purchase History
پیام های تریدر
Filter
Options360
Ethereum channel
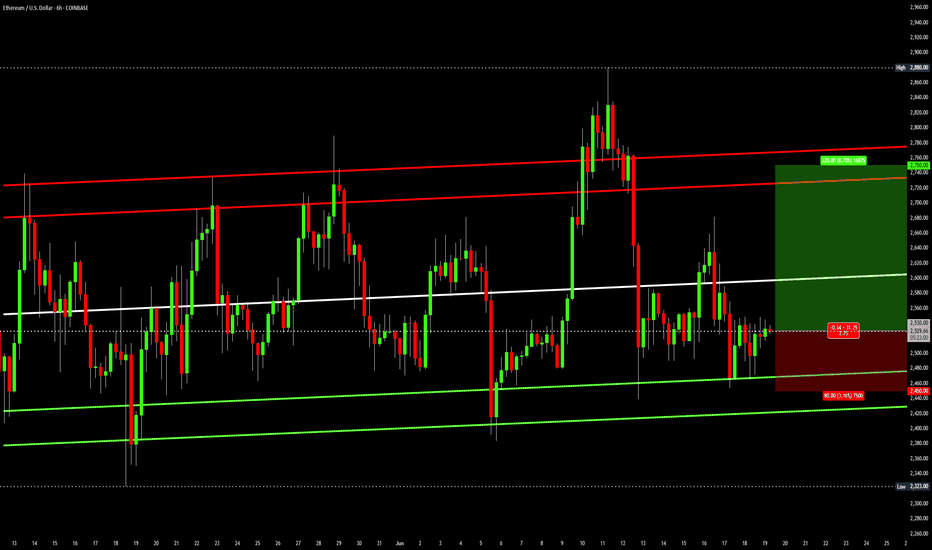
This is a straightforward analysis. Ethereum has been trading in an ascending parallel channel for 6 weeks now. As long as this pattern stays valid, ETH is a long at the bottom and short at the top of the channel, repeat. Round numbers support is 2450 and resistance is 2750. Trade idea: Long: 2530 Profit: 2750 Stop: 2450New trade setup: Long: 2400 Profit: 2800 Stop: 2320Well, the Ethereum long eventually worked out, just not how I originally planned on my June 19th publication.3350 is a fib resistance area:Here's a zoom in on Ethereum for August with the 2 month uptrend channel, 1 week downtrend channel and 8/2 low - 8/13 high Fib retracement levels. All 3 convergence at 4100: 50% retracement, downtrend support and uptrend support.ETH broke it's 2 month uptrend channel supportzoom in breakout:
Options360
Bitcoin, Gold, S&P 500 and Inflation

Bitcoin, Gold, S&P 500 and Inflation This is a 3 year view (2022 - 2025 to date), 1 week comparison chart of Bitcoin, Gold, S&P 500 and US cumulative rate of inflation. The most interesting part of this analysis to me is that the S&P 500 bounced off the cumulative rate of inflation slope. I did not know that until after I set up the comparison. Gold = +80% BTCUSD = +50% S&P 500 = +19% US cumulative rate of inflation: 2022 = +6.5% 2023 = +3.4% 2024 = +2.9% 3 yr = +10.8% 2025 = +2.4% forecast
Options360
Bitcoin new all time high by August

Here's a Bitcoin 1 week chart, 5 year view, with price and time notes. Bitcoin is poised to make new all time highs around 130k by August 18th 2025. It may not seem that way today, when all global markets are drastically down because of Tariff news. But here's the bull case: 1) Uptrend channel: Bitcoin is trading at support in it's several years uptrend channel. 2) Last halving cycle 5/11/20 it took 336 days to hit it's first peak. 3) Last halving cycle 5/11/20 it took 546 days to hit it's second peak. 4) Last halving cycle 5/11/20 it took 98 days to drop and reverse bullish. And that was because China banned crypto. 5) This halving cycle 4/20/24 it took 280 days to hit it's first peak. 6) This halving cycle 4/20/24 Bitcoin has been in a downtrend for 77 days so far. And that is because China Deep Seek AI news, followed by Tariff news. 7) Last halving cycle 5/11/20 it took 210 days from the first to second peak. This halving cycle 4/20/24 210 days from the first peak to the possible second peak would land on 8/18/25. 8) Bitcoin 2021 high of $69k is a major support level that closely aligns with it's current uptrend channel support.Took profit at $93,500, will wait for a pullback to 89K to get back in.Had to get back in the long before Bitcoin breaks +$100kIf you want to take partial profit in the +$100k area and use Michael Sailor as your exit liquidity nows your chance.Bitcoin is now at major resistance. Time to take profit in the red zone.Update:We are at or near the top
Options360
QQQuadruple witching tomorrow
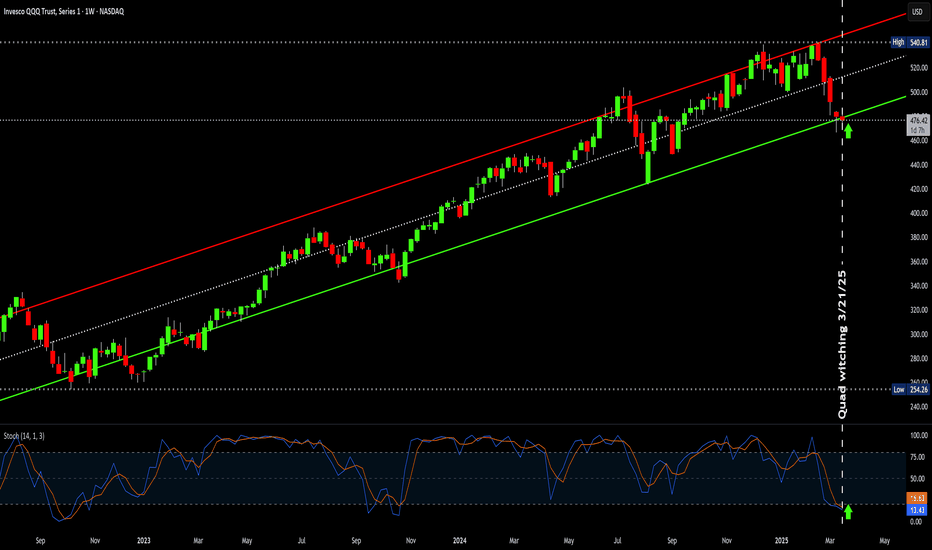
Quadruple witching is tomorrow 3/21/25. It refers to the simultaneous expiration of four types of derivative contracts: stock index futures, stock index options, stock options, and single-stock futures. The expiration of these contracts can lead to increased trading volume and market volatility, especially during the last hour of trading, known as the "witching hour". QQQ is sitting at it's 2 year trend channel support level. Also, QQQ stochastic on the weekly chart is oversold. This is a high probability, low risk long setup. However, if this 2 year trend breaks down, then a new trend will take shape. To try to get the best entry, it would make sense to leg into the long position with 3 separate trades over the course of the next 3 days, 3/20, 3/21 & 3/24. Long trade idea: Long = 475 Stop = 465 Profit = 535 bull put spread 1 : 4 - risk : reward 4/17, 5/16 or 6/20 expiry sell 535 put buy 480 put or 4/17, 5/16 or 6/20 expiry buy 480 call Options data: 3/21 expiry Put Volume Total 225,663 Call Volume Total 253,501 Put/Call Volume Ratio 0.89 Put Open Interest Total 1,116,319 Call Open Interest Total 1,009,483 Put/Call Open Interest Ratio 1.11 4/17 expiry Put Volume Total 51,129 Call Volume Total 58,065 Put/Call Volume Ratio 0.88 Put Open Interest Total 742,165 Call Open Interest Total 459,072 Put/Call Open Interest Ratio 1.62 5/16 expiry Put Volume Total 30,172 Call Volume Total 26,170 Put/Call Volume Ratio 1.15 Put Open Interest Total 223,535 Call Open Interest Total 173,491 Put/Call Open Interest Ratio 1.29 6/20 expiry Put Volume Total 21,202 Call Volume Total 10,509 Put/Call Volume Ratio 2.02 Put Open Interest Total 1,040,493 Call Open Interest Total 459,733 Put/Call Open Interest Ratio 2.26Sell the rumor buy the news:
Options360
AI is not a bubble
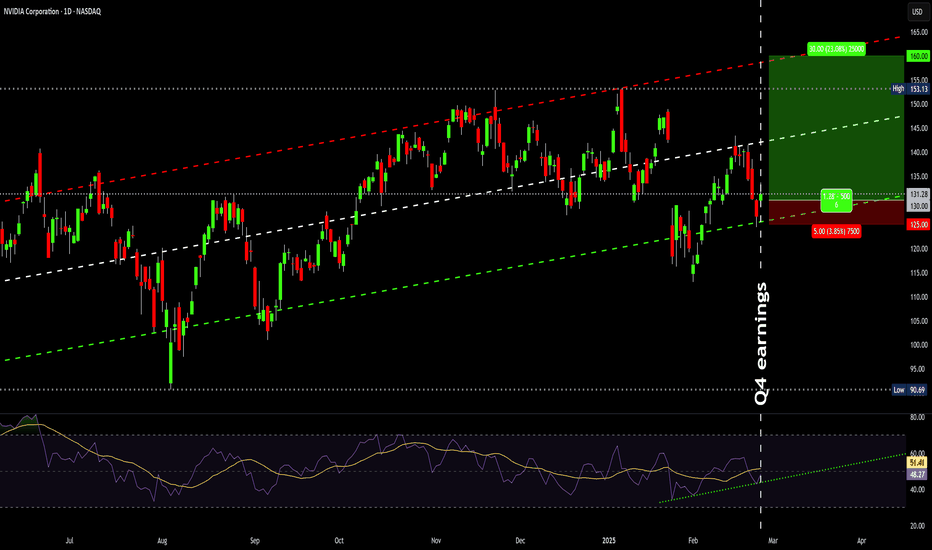
NVIDIA reported earnings of 89 cents per share on revenue of $39.33 B for Q4. While revenue grew 77.94% on a year-over-year basis. The consensus earnings estimate was 84 cents per share on revenue of $37.72 B. The company said it expects Q1 revenue of $42.14 B to $43.86 B, and gross margins of 70.5% to 71.5%, which calculates to non-GAAP earnings of 89 cents to 97 per share. Long trade idea: long = 130 stop = 125 profit = 160 NVDA options data: 3/21 expiry Put Volume Total 159,655 Call Volume Total 331,044 Put/Call Volume Ratio 0.48 Put Open Interest Total 1,957,392 Call Open Interest Total 2,368,522 Put/Call Open Interest Ratio 0.83 4/17 expiry Put Volume Total 125,626 Call Volume Total 81,625 Put/Call Volume Ratio 1.54 Put Open Interest Total 521,463 Call Open Interest Total 712,523 Put/Call Open Interest Ratio 0.73 5/16 expiry Put Volume Total 32,339 Call Volume Total 49,339 Put/Call Volume Ratio 0.66 Put Open Interest Total 366,100 Call Open Interest Total 389,827 Put/Call Open Interest Ratio 0.94Long from 126.75 entryDecided to dca at 122.75Update: adjustment to market & plans long avg = 124.75 stop = 119.75 profit = 160dca long at 117.75
Options360
XRP levels

XRP went on a parabolic bull run in November 2024. Since December 2024 it traded in an uptrend channel with a peak on January 15th - 16th 2025. Followed by a drop on February 2nd & 3rd. Since then, XRP is trying to get back in to it's uptrend channel. Right now, it's trading slightly bullish, just above neutral 50 on the stochastic indicator with a break above it's .5 YTD fib retracement level. If there's a rejection at it's previous uptrend channel of 2.85 that's bearish and could hit SMA100 again. If there's a breakout above it's previous uptrend channel of 2.85 that's bullish and could hit the top of it's previous uptrend channel. XRP levels: SMA100 = 2.21 SMA200 = 1.38 6 month low = .38 6 month high = 3.40 6 month fib retracement .5 = 1.89 YTD low = 1.73 YTD high = 3.40 YTD fib retracement .5 = 2.56 December - February uptrend channel high = 3.85 low = 2.85
Options360
META & COST are overbought
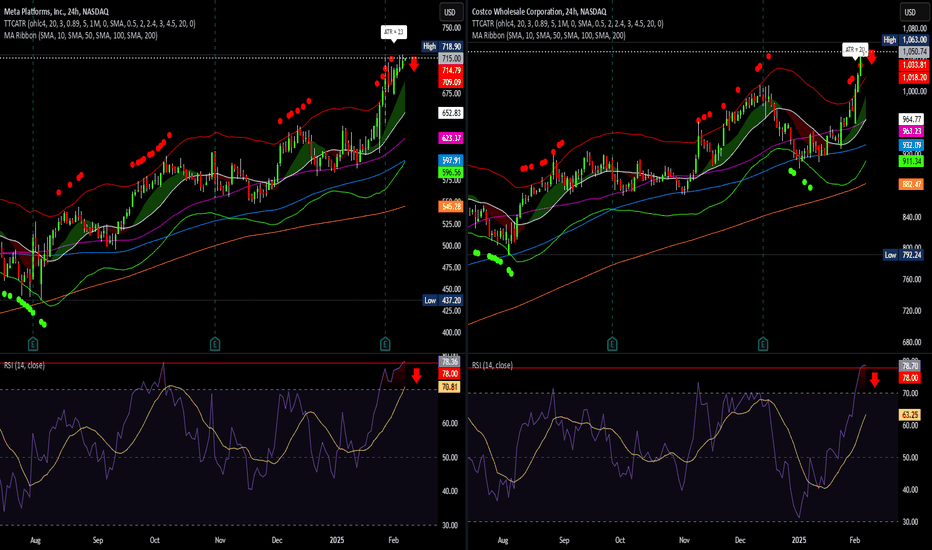
META & COST are overbought. With a RSI by 80 and trading above it's outer ATR band of 3x standard deviations. Once momentum fizzles out, gravity will bring META & COST back down to SMA20. So here's a straightforward trading idea. META levels: ATR 23 SMA 20 = 653 SMA50 = 623 SMA100 = 598 SMA200 = 545 COST levels: ATR 20 SMA 20 = 965 SMA50 = 963 SMA100 = 932 SMA200 = 882 META short trade idea: short 715 stop 725 profit 655 COST short trade idea: short 1060 stop 1070 profit 965 META options data: 2/21 expiry Put Volume Total 20,489 Call Volume Total 25,697 Put/Call Volume Ratio 0.80 Put Open Interest Total 105,207 Call Open Interest Total 131,858 Put/Call Open Interest Ratio 0.80 3/21 expiry Put Volume Total 8,533 Call Volume Total 19,062 Put/Call Volume Ratio 0.45 Put Open Interest Total 101,527 Call Open Interest Total 110,511 Put/Call Open Interest Ratio 0.92 4/17 expiry Put Volume Total 4,053 Call Volume Total 5,625 Put/Call Volume Ratio 0.72 Put Open Interest Total 32,737 Call Open Interest Total 53,495 Put/Call Open Interest Ratio 0.61 COST options data: 2/21 expiry Put Volume Total 4,458 Call Volume Total 5,217 Put/Call Volume Ratio 0.85 Put Open Interest Total 11,521 Call Open Interest Total 12,621 Put/Call Open Interest Ratio 0.91 3/21 expiry Put Volume Total 3,210 Call Volume Total 3,064 Put/Call Volume Ratio 1.05 Put Open Interest Total 25,964 Call Open Interest Total 22,294 Put/Call Open Interest Ratio 1.16 4/17 expiry Put Volume Total 592 Call Volume Total 1,388 Put/Call Volume Ratio 0.43 Put Open Interest Total 10,602 Call Open Interest Total 8,988 Put/Call Open Interest Ratio 1.18META short entry 722COST short entry 1055
Options360
QQQ range
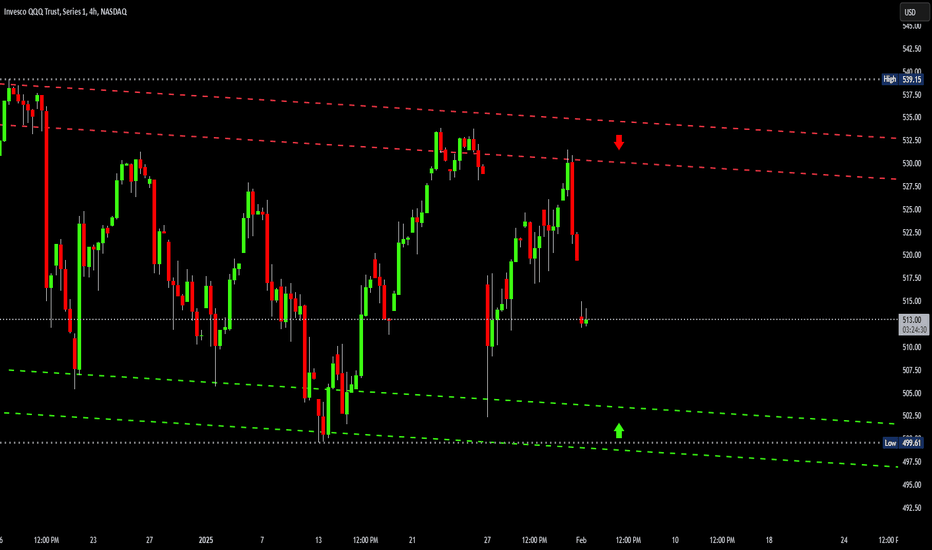
QQQ has printed a very obvious trading range pattern. This is a very simple trading idea. But sometimes the more straight forward trade is the best. On 12/24/24, 1/13/25 and 1/27/25 QQQ hit range lows around 500 - 505. On 12/16/24, 1/22/25 and 1/31/25 QQQ hit range highs around 530 - 535. So until there's a breakout or breakdown of this range pattern, I will stick to this trading range pattern. QQQ long trade idea: long 505 stop 500 profit 530 QQQ short trade idea: short 530 stop 535 profit 505 QQQ options data: 2/21 expiry Put Volume Total 151,543 Call Volume Total 54,732 Put/Call Volume Ratio 2.77 Put Open Interest Total 537,804 Call Open Interest Total 407,596 Put/Call Open Interest Ratio 1.32short entry at 532
Options360
Mega cap earnings watch
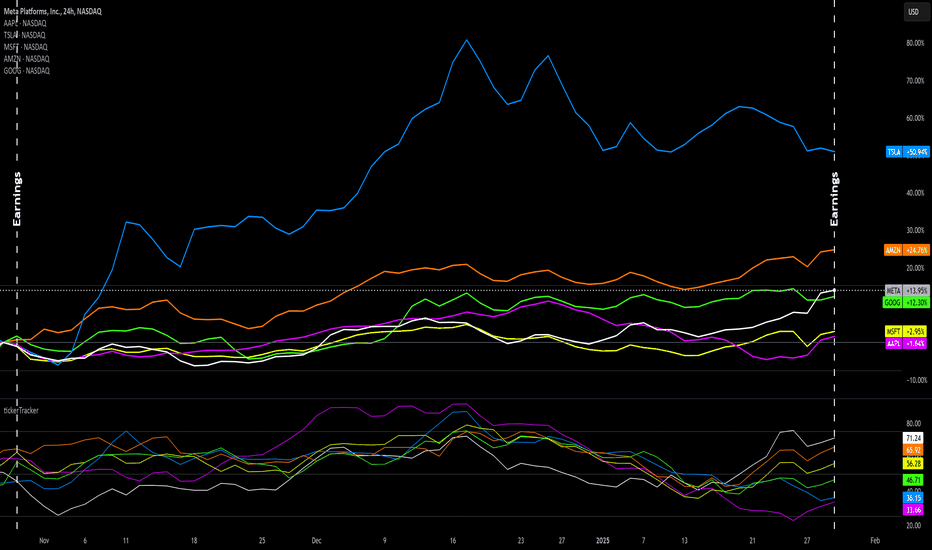
Mega cap earnings get started today. Here's a comparison chart of META, TSLA, MSFT, AAPL, GOOG & AMZN. With the ticker Tracker MFI oscillator on the 1 day ext chart 3 month view. Below is the list of dates and times of their earnings release. META 1/29 4:05pm Consensus EPS = 6.68 Revenue = 46.98 B TSLA 1/29 4:05pm Consensus EPS = .75 Revenue = 27.61 B MSFT 1/29 4:05pm Consensus EPS = 3.11 Revenue = 68.75 B AAPL 1/30 4:30pm Consensus EPS = 2.36 Revenue = 124.1 B GOOG 2/4 4:05pm Consensus EPS = 2.12 Revenue = 81.38 B AMZN 2/6 4pm Consensus EPS = 1.52 Revenue = 187.13 BMETA earnings per share was 8.02 and it's revenue was 48.39 B TSLA earnings per share was .73 and it's revenue was 25.71 B MSFT earnings per share was 3.23 and it's revenue was 69.63 BAAPL earnings per share was 2.40 and it's revenue was 124.30 BGOOG earnings per share was 2.15 and it's revenue was 96.47 B
Options360
Bitcoin crystal ball
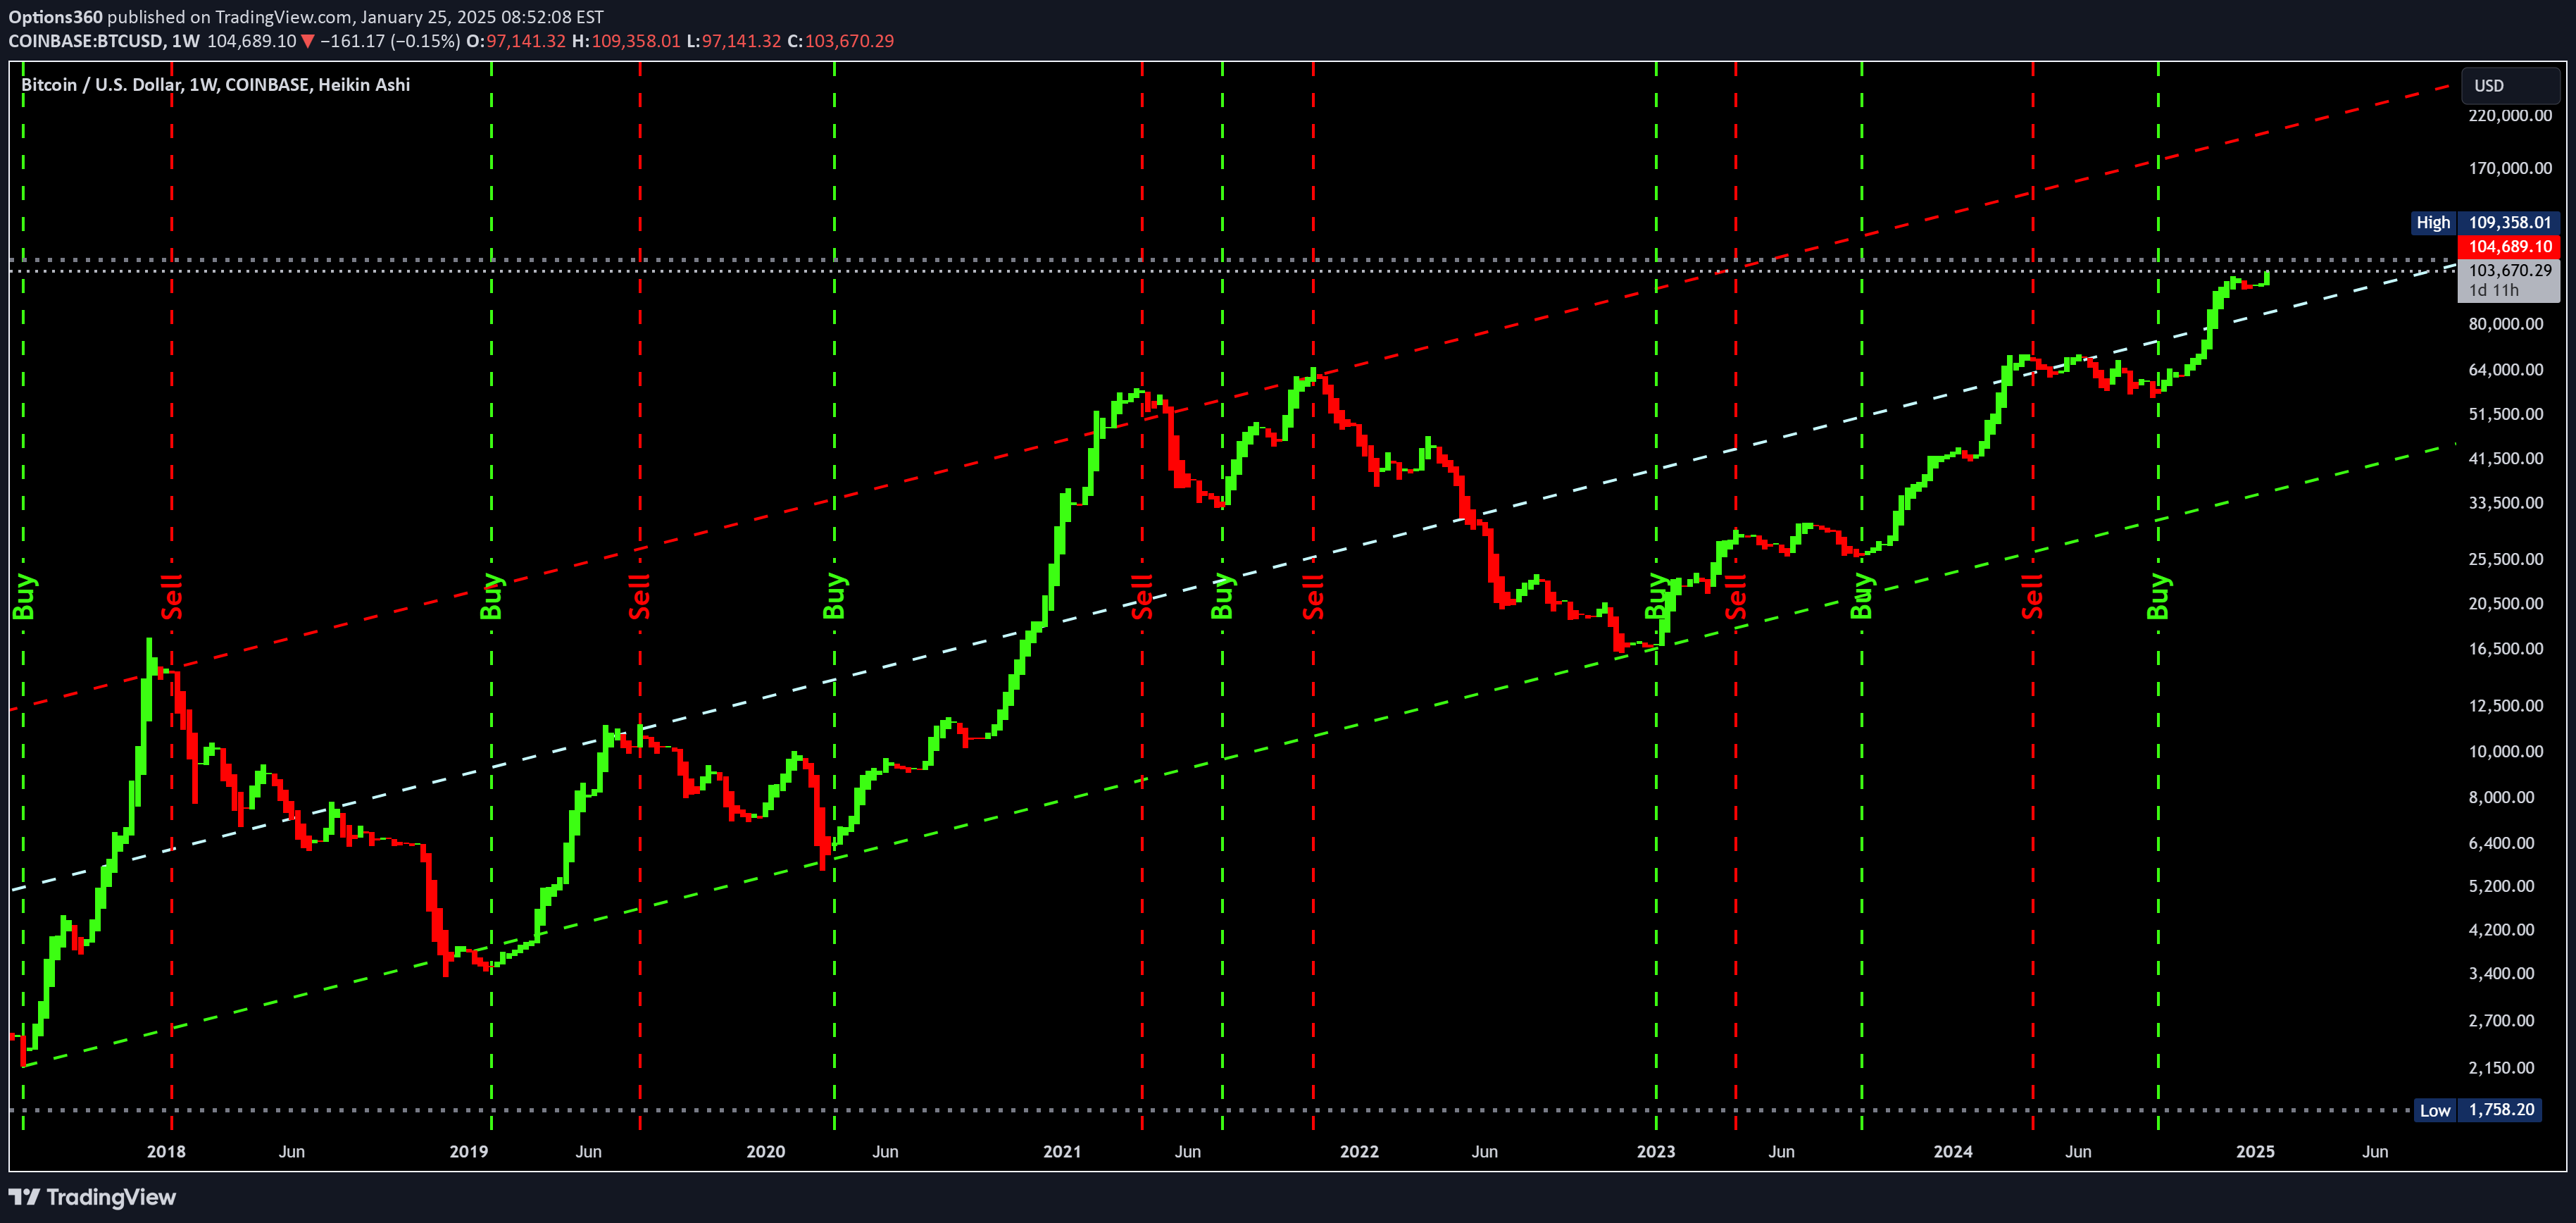
Every investor and trader has at sometime wished they had a crystal ball. You can do your own due diligence, taking the time to do technical and fundamental analysis weighing market sentiment and still not be 100% correct every single time. As the saying goes, hindsight is 20/20. So with that said, if you look back at Bitcoin's price discovery history, you can see the general and specific trades you "should" have made. However, how do we extrapolate this data into future trades we "should" make? For me, It's all based on probability and risk management. I look for high probability and low risk trades. Most of the time a trade is not ready for that perfect timing to trade. It takes planning and patience to setup a great entry and exit. The old adage, “it's not about timing the market, but about time in the market.” That's why investors simply hold on with a long term bullish trend. But, what if you had a crystal ball? Then obviously you would time selling the major tops and buying major lows. Here's a Bitcoin 1 week chart with Heikin Ashi candlesticks without wicks, to take out the visual noise. In the past 7 years, I have identified only 7 major long trades and 6 major short trades. Why is this important? It means that the last best time to go long was the week of 9/9/24. And it also means the next trade is a short trade. This does not mean the timing is to short Bitcoin today. It just means that if you had a crystal ball you would know when to exit your long position. For now Bitcoin is still a long to hold on to. BTC/USD crystal ball trades: #7 long = $54,566 w/o 9/9/24 short = ? w/o ? profit = ? time = ? #6 long = $24,900 w/o 9/11/23 short = $72,777 w/o 4/8/24 profit = $47,877 = 2.92x time = 7 months #5 long = $16,543 w/o 1/2/23 short = $31,050 w/o 4/10/23 profit = $14,507 = 1.88x time = 3 months #4 long = $29,302 w/o 7/19/21 short = $69,000 w/o 10/8/21 profit = $39,698 = 2.35x time = 3 months #3 long = $5853 w/o 3/30/20 short = $64,899 w/o 4/12/21 profit = $59,046 = 11.09x time = 14 months #2 long = $3341 w/o 2/4/19 short = $12,320 w/o 8/5/19 profit = $8979 = 3.69x time = 7 months #1 long = $1758 w/o 7/10/17 short = $16,275 w/o 1/8/18 profit = $14,517 = 9.26x time = 6 months
Disclaimer
Any content and materials included in Sahmeto's website and official communication channels are a compilation of personal opinions and analyses and are not binding. They do not constitute any recommendation for buying, selling, entering or exiting the stock market and cryptocurrency market. Also, all news and analyses included in the website and channels are merely republished information from official and unofficial domestic and foreign sources, and it is obvious that users of the said content are responsible for following up and ensuring the authenticity and accuracy of the materials. Therefore, while disclaiming responsibility, it is declared that the responsibility for any decision-making, action, and potential profit and loss in the capital market and cryptocurrency market lies with the trader.