
MoNi_MoN
@t_MoNi_MoN

What symbols does the trader recommend buying?
Purchase History
پیام های تریدر
Filter
MoNi_MoN
NVDA – 4D Structure Update | Fib Acceptance & Momentum Build
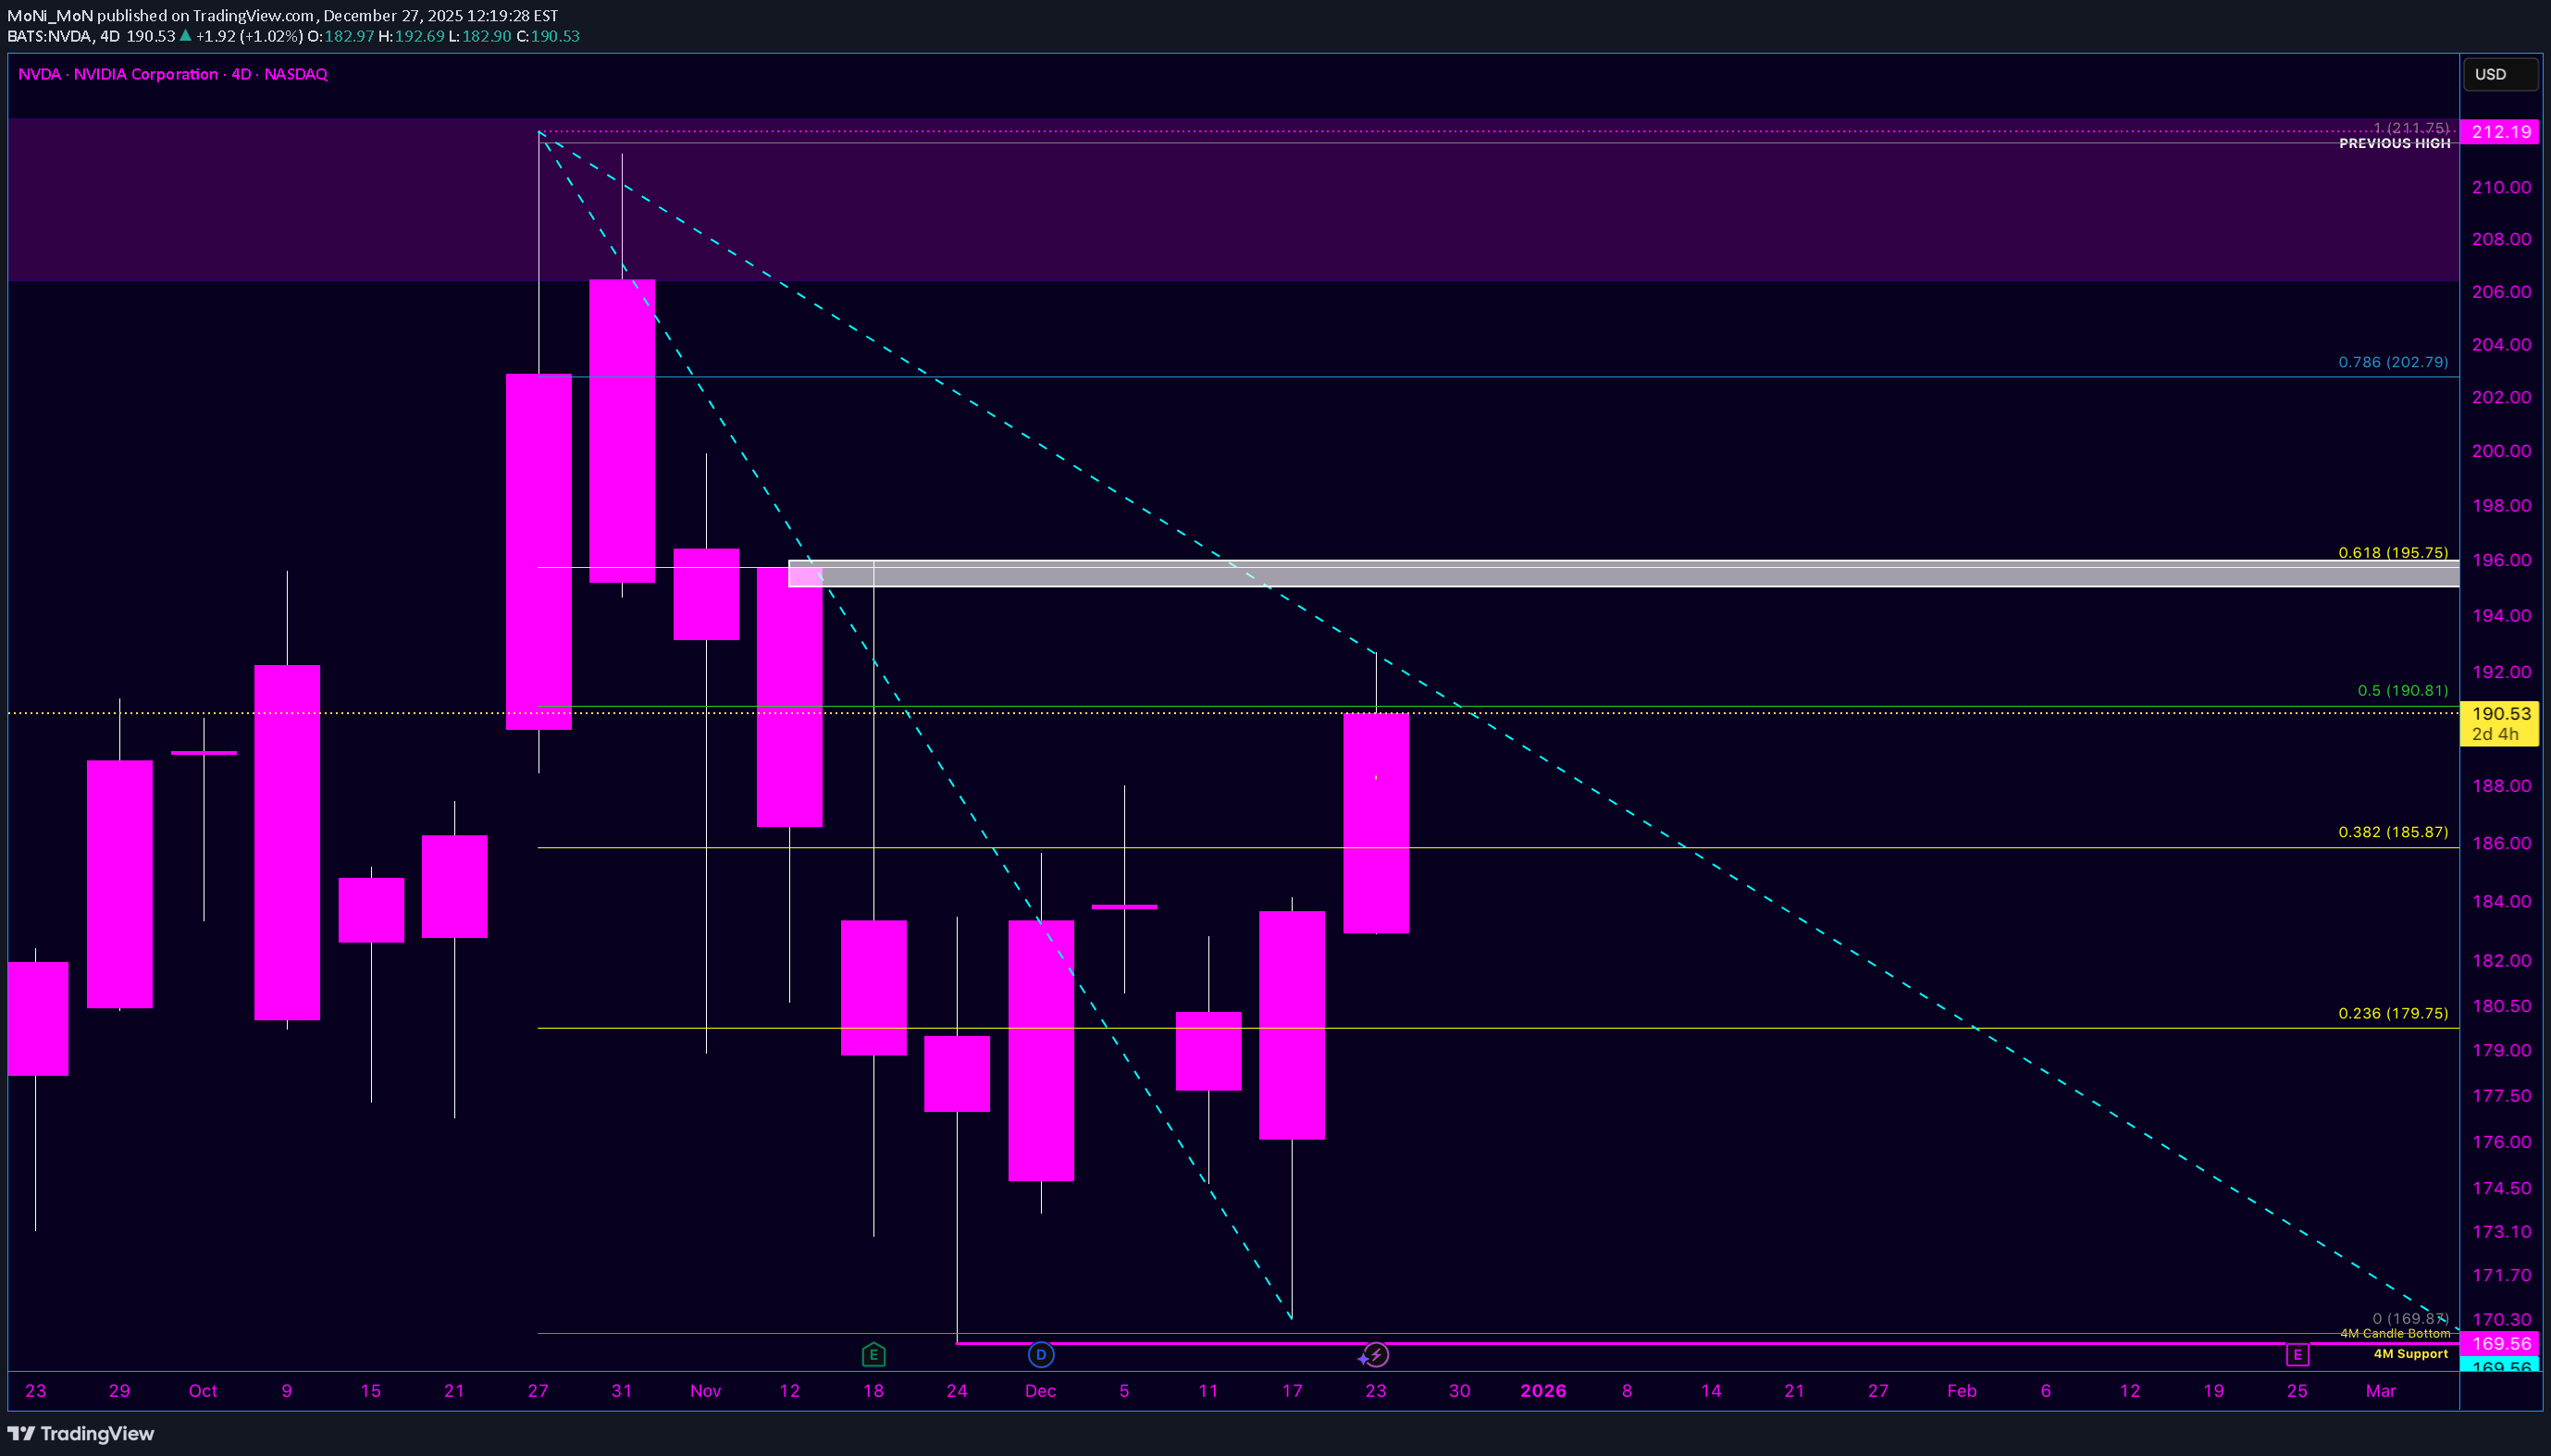
After weeks of compression, NVDA is finally showing structure that’s worth respecting on the higher timeframe. Price formed a clear impulse from the ~169–170 low into the 212 previous high zone. With that leg established, a Fibonacci retracement now has validity — and price action is already responding to it. Key observations: The 0.236–0.382 retracement zone acted as a strong acceptance area. Rather than a deep retrace, price consolidated and held above prior demand. NVDA is currently hovering around the 0.5 level (~190–191), which often acts as a decision zone. The fact that price is holding here suggests balance, not weakness. The 0.618 level (~195–196) is the first major continuation test. A clean reclaim and hold above this level would signal momentum continuation. The 0.786 retracement (~202–203) aligns with the psychological $200 level, creating a natural magnet if momentum builds. The previous high near ~212 remains the larger objective if structure continues to hold. From a structure perspective, this does not resemble a relief bounce. Price respected higher timeframe support, reclaimed mid-range levels, and is consolidating rather than selling off aggressively. As long as price holds above the mid-fib region, the bias remains constructive. Below ~185 would suggest continued range behavior, but above ~195 opens the door for acceleration toward the upper fib and prior highs. This is less about prediction and more about context — and right now, the market is showing acceptance, not rejection. Take that, take tha, Micheal Burry :D <3
MoNi_MoN
تئوری حیرتانگیز 223.10% در NVDA: ساختار، زمانبندی و احتمال انفجار قیمتی!
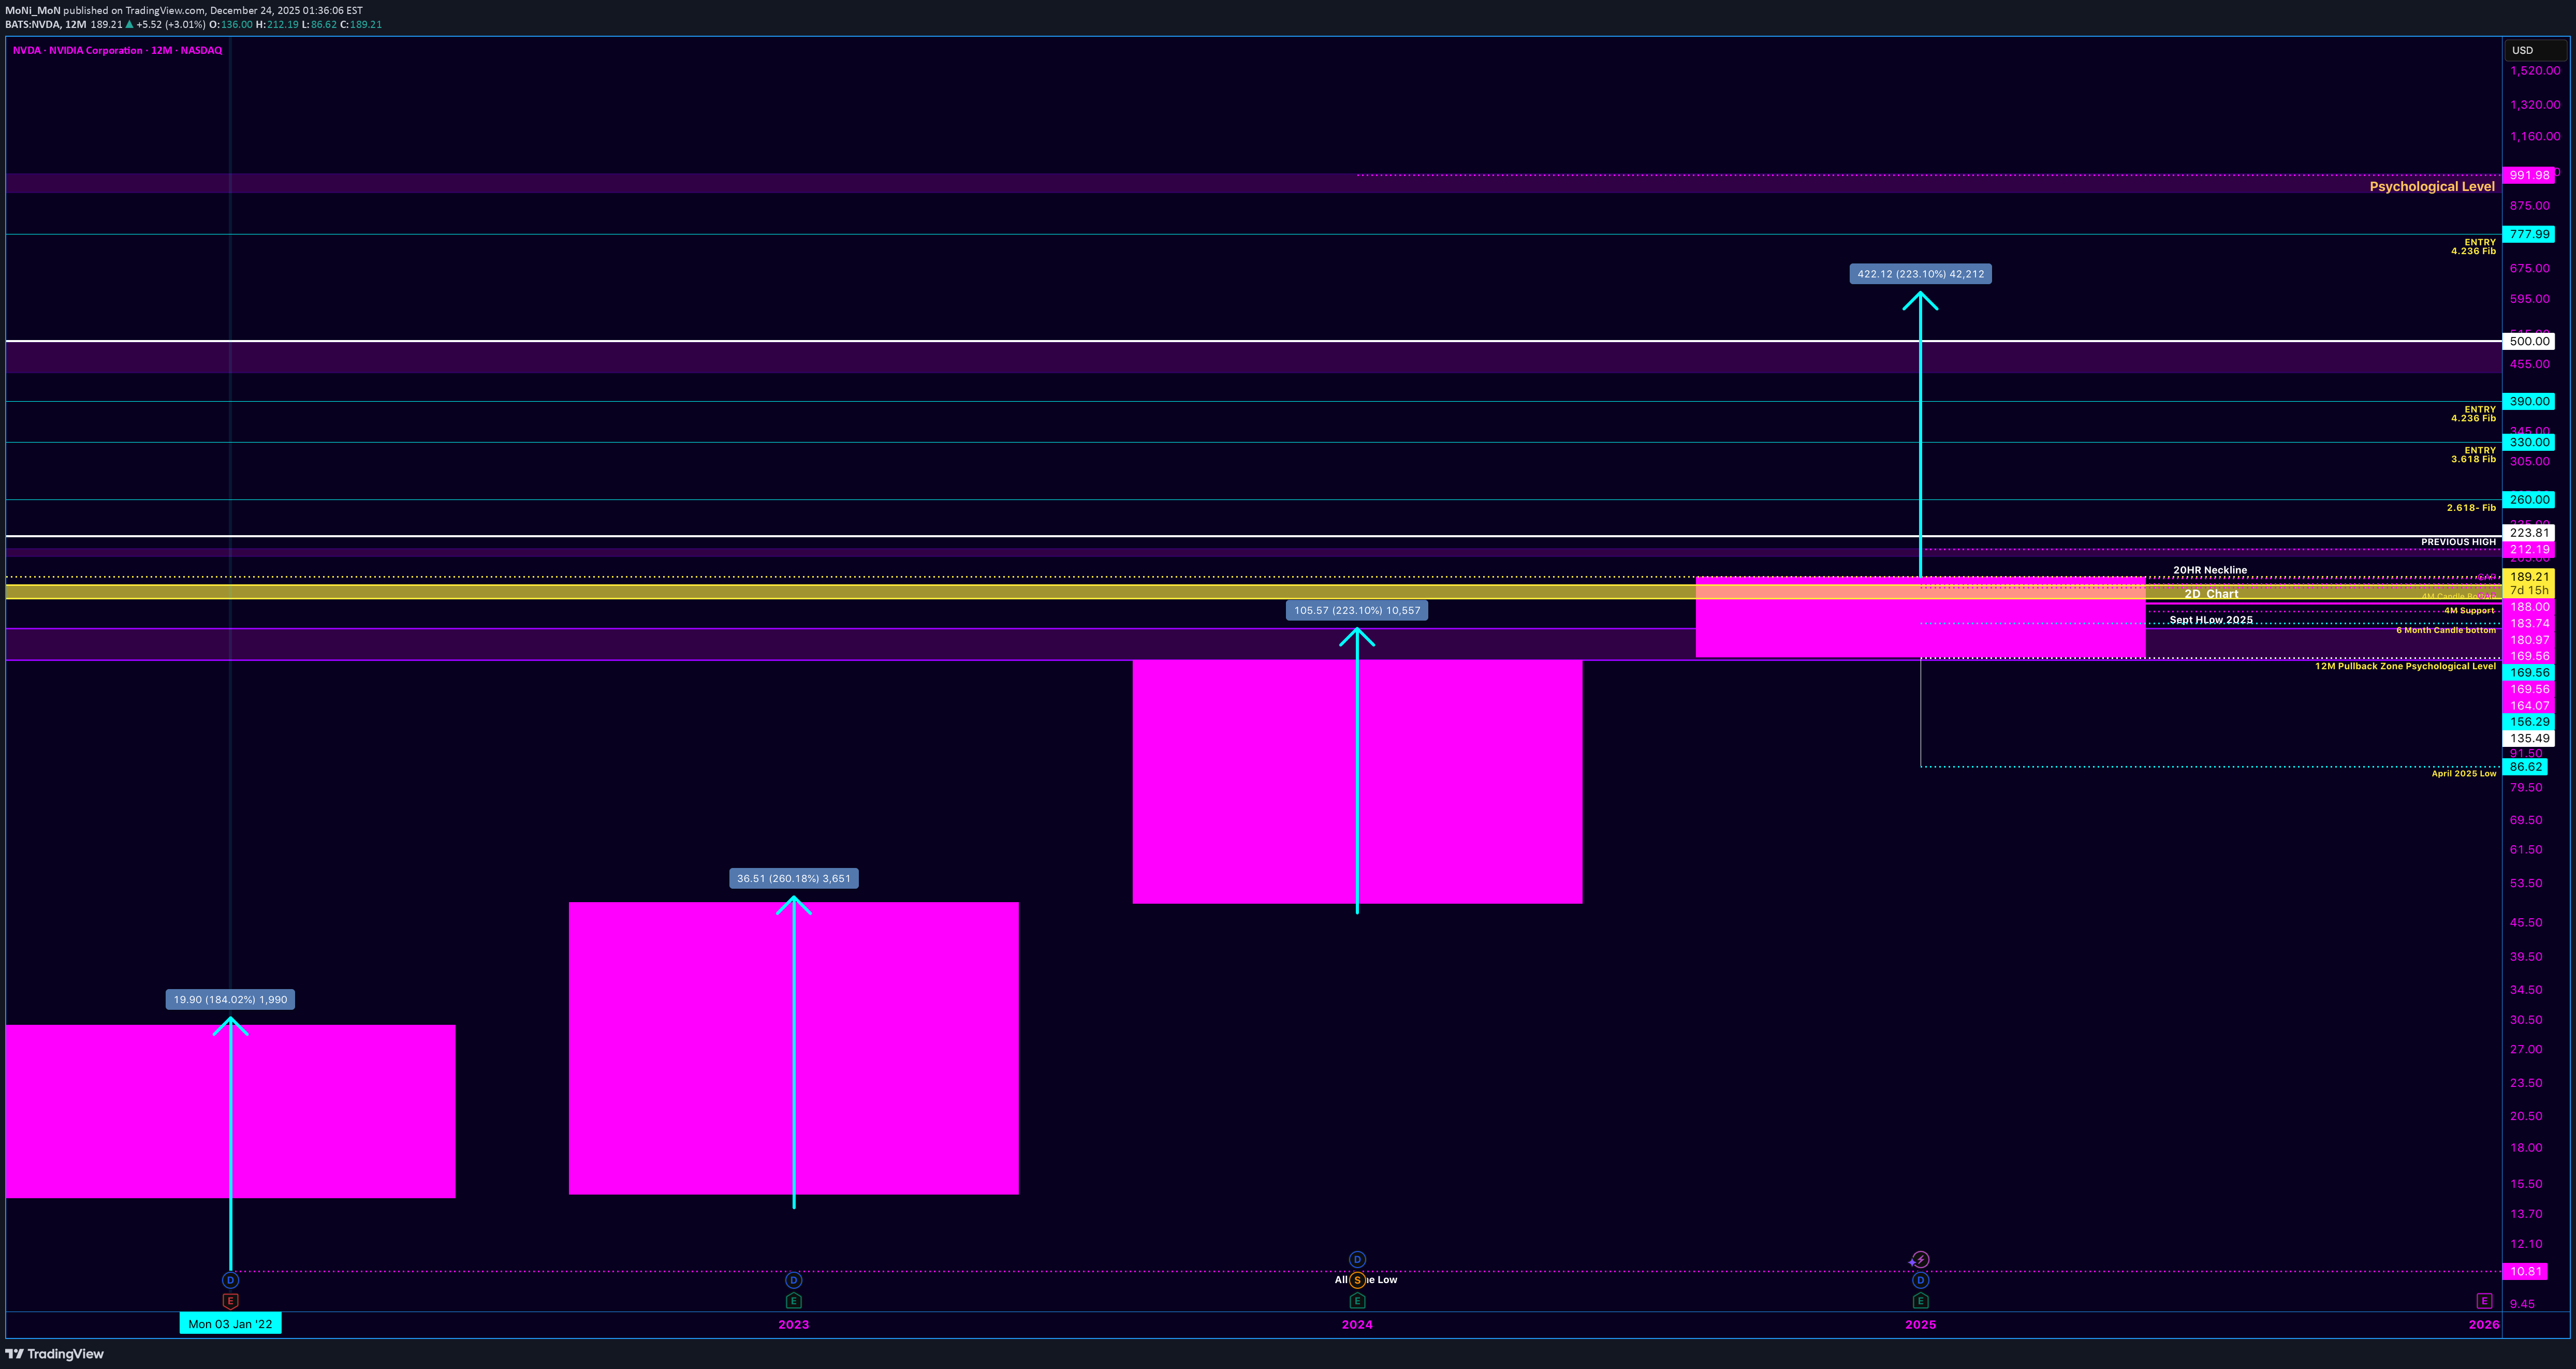
I want to expand on my NVDA thesis by adding one more layer that’s been on my mind — the 223.10% measurement — and how I’m viewing it strictly as a structural possibility, not a prediction. Everything below is still rooted in market structure and timing. Quick Recap: Where We Are Price ran from the $164 region into the $212 highs, then pulled back into the $169–$174 demand zone. That pullback reset momentum and held structure across higher timeframes (2D, 4M, 6M). From my perspective: The downside move completed the reset The market is now compressing This is pre-breakout behavior, not a failure The W formation is forming, but not confirmed. Key Confirmation Still Hasn’t Changed This remains true regardless of any upside theory: ➡️ Daily close + acceptance above ~$188 Until that happens, price is coiling. Above that level, the path back to $212 opens structurally. The 223.10% Theory (How I’m Looking at It) This part is pure structure math, not expectation. The previous large expansion candle on the higher timeframe measured approximately 223.10% from its base to its high. Instead of projecting randomly, I asked a simple question: What happens if the market repeats the same magnitude of expansion from the current structural base? So I: Took the 223.10% expansion Anchored it to the current price zone (~$189 area) Projected it upward mechanically That projection lands in the ~$600–$610 region. Important clarification: This is not a forecast This is not a target This is a measured possibility, based on prior behavior Markets don’t repeat perfectly — but they do rhyme, especially on higher timeframes. Why Timing Makes This Interesting (But Still Uncertain) The 12-month candle closes in ~7 days. That matters. If the market wanted to: Reclaim $212 Print strength into the yearly close Signal continuation into the next cycle This is when it would begin positioning — not after the candle closes. That said: Expansion of that magnitude would require momentum confirmation No confirmation yet = no assumption Structure comes first. Always. How I’m Framing This Mentally I’m not expecting a miracle candle. I’m not forcing an outcome. My framework is: Hold support Break and accept key levels Let expansion earn its way higher If price can’t reclaim $212, the 223.10% theory stays just that — a theory. But if it does? Then the market itself opens the conversation. Final Thought This thesis isn’t about being right — it’s about being positioned correctly when structure aligns with time. The homework was done earlier. Now it’s about watching execution into the close. Let the market decide. -MoNi
MoNi_MoN
NVDA: Structure Before Story
There’s been a lot of talk lately and Micheal Burry questioning NVDA and news Headlines all over the place . Opinions. Doubt. Validation-seeking from both sides of the trade. That’s normal when price compresses this tightly under a major level. But I want to be clear about how I’m approaching NVDA right now — because this isn’t about hype, and it’s not about chasing a breakout that hasn’t happened yet. This is about structure, timing, and patience. The Structure Comes First NVDA is not in a breakout. It’s in pre-breakout compression. The market already showed its hand on the downside: Support held Key demand zones defended Momentum reset without structural damage That pullback wasn’t weakness — it was a reset. Right now, price is compressing beneath a clearly defined neckline. That tells me the move isn’t finished — it’s being built. A true breakout only comes with acceptance and continuation, not excitement. Until then, this remains a developing formation, not a confirmed one. Why the Narrative Doesn’t Move Price (Yet) A lot of recent discussion has centered around earnings math, expectations, and whether the story “adds up.” That’s fair. Markets need skeptics. But price doesn’t wait for consensus — it moves when liquidity, positioning, and structure align. Not all demand is loud. Not all supply is public. And not all positioning shows up neatly in headlines. That doesn’t mean anything improper is happening — it means the market is more complex than a single narrative thread. Timing Is the Real Variable This isn’t a single-leg move. If NVDA resolves higher, it will be a campaign, not a spike. Key higher-timeframe candles are approaching resolution, and those closes matter far more than intraday noise. Compression into those windows often precedes expansion — but only when the market is ready. Until then, patience is the edge. My Positioning Philosophy I didn’t enter this trade for validation. I didn’t enter it for social proof. And I didn’t enter it expecting instant gratification. The work was done early. The levels were defined. The risk was accepted. Now it’s about execution, not emotion. Whether the market resolves higher immediately or continues to coil, I’m focused on structure — because structure tells the truth before the story does. No predictions. No promises. Just disciplined observation. Let the market speak.
MoNi_MoN
تحلیل ساختار بازار: چرا با وجود نوسانات، آرامش خود را حفظ کردهام (بررسی سطوح کلیدی NVDA)
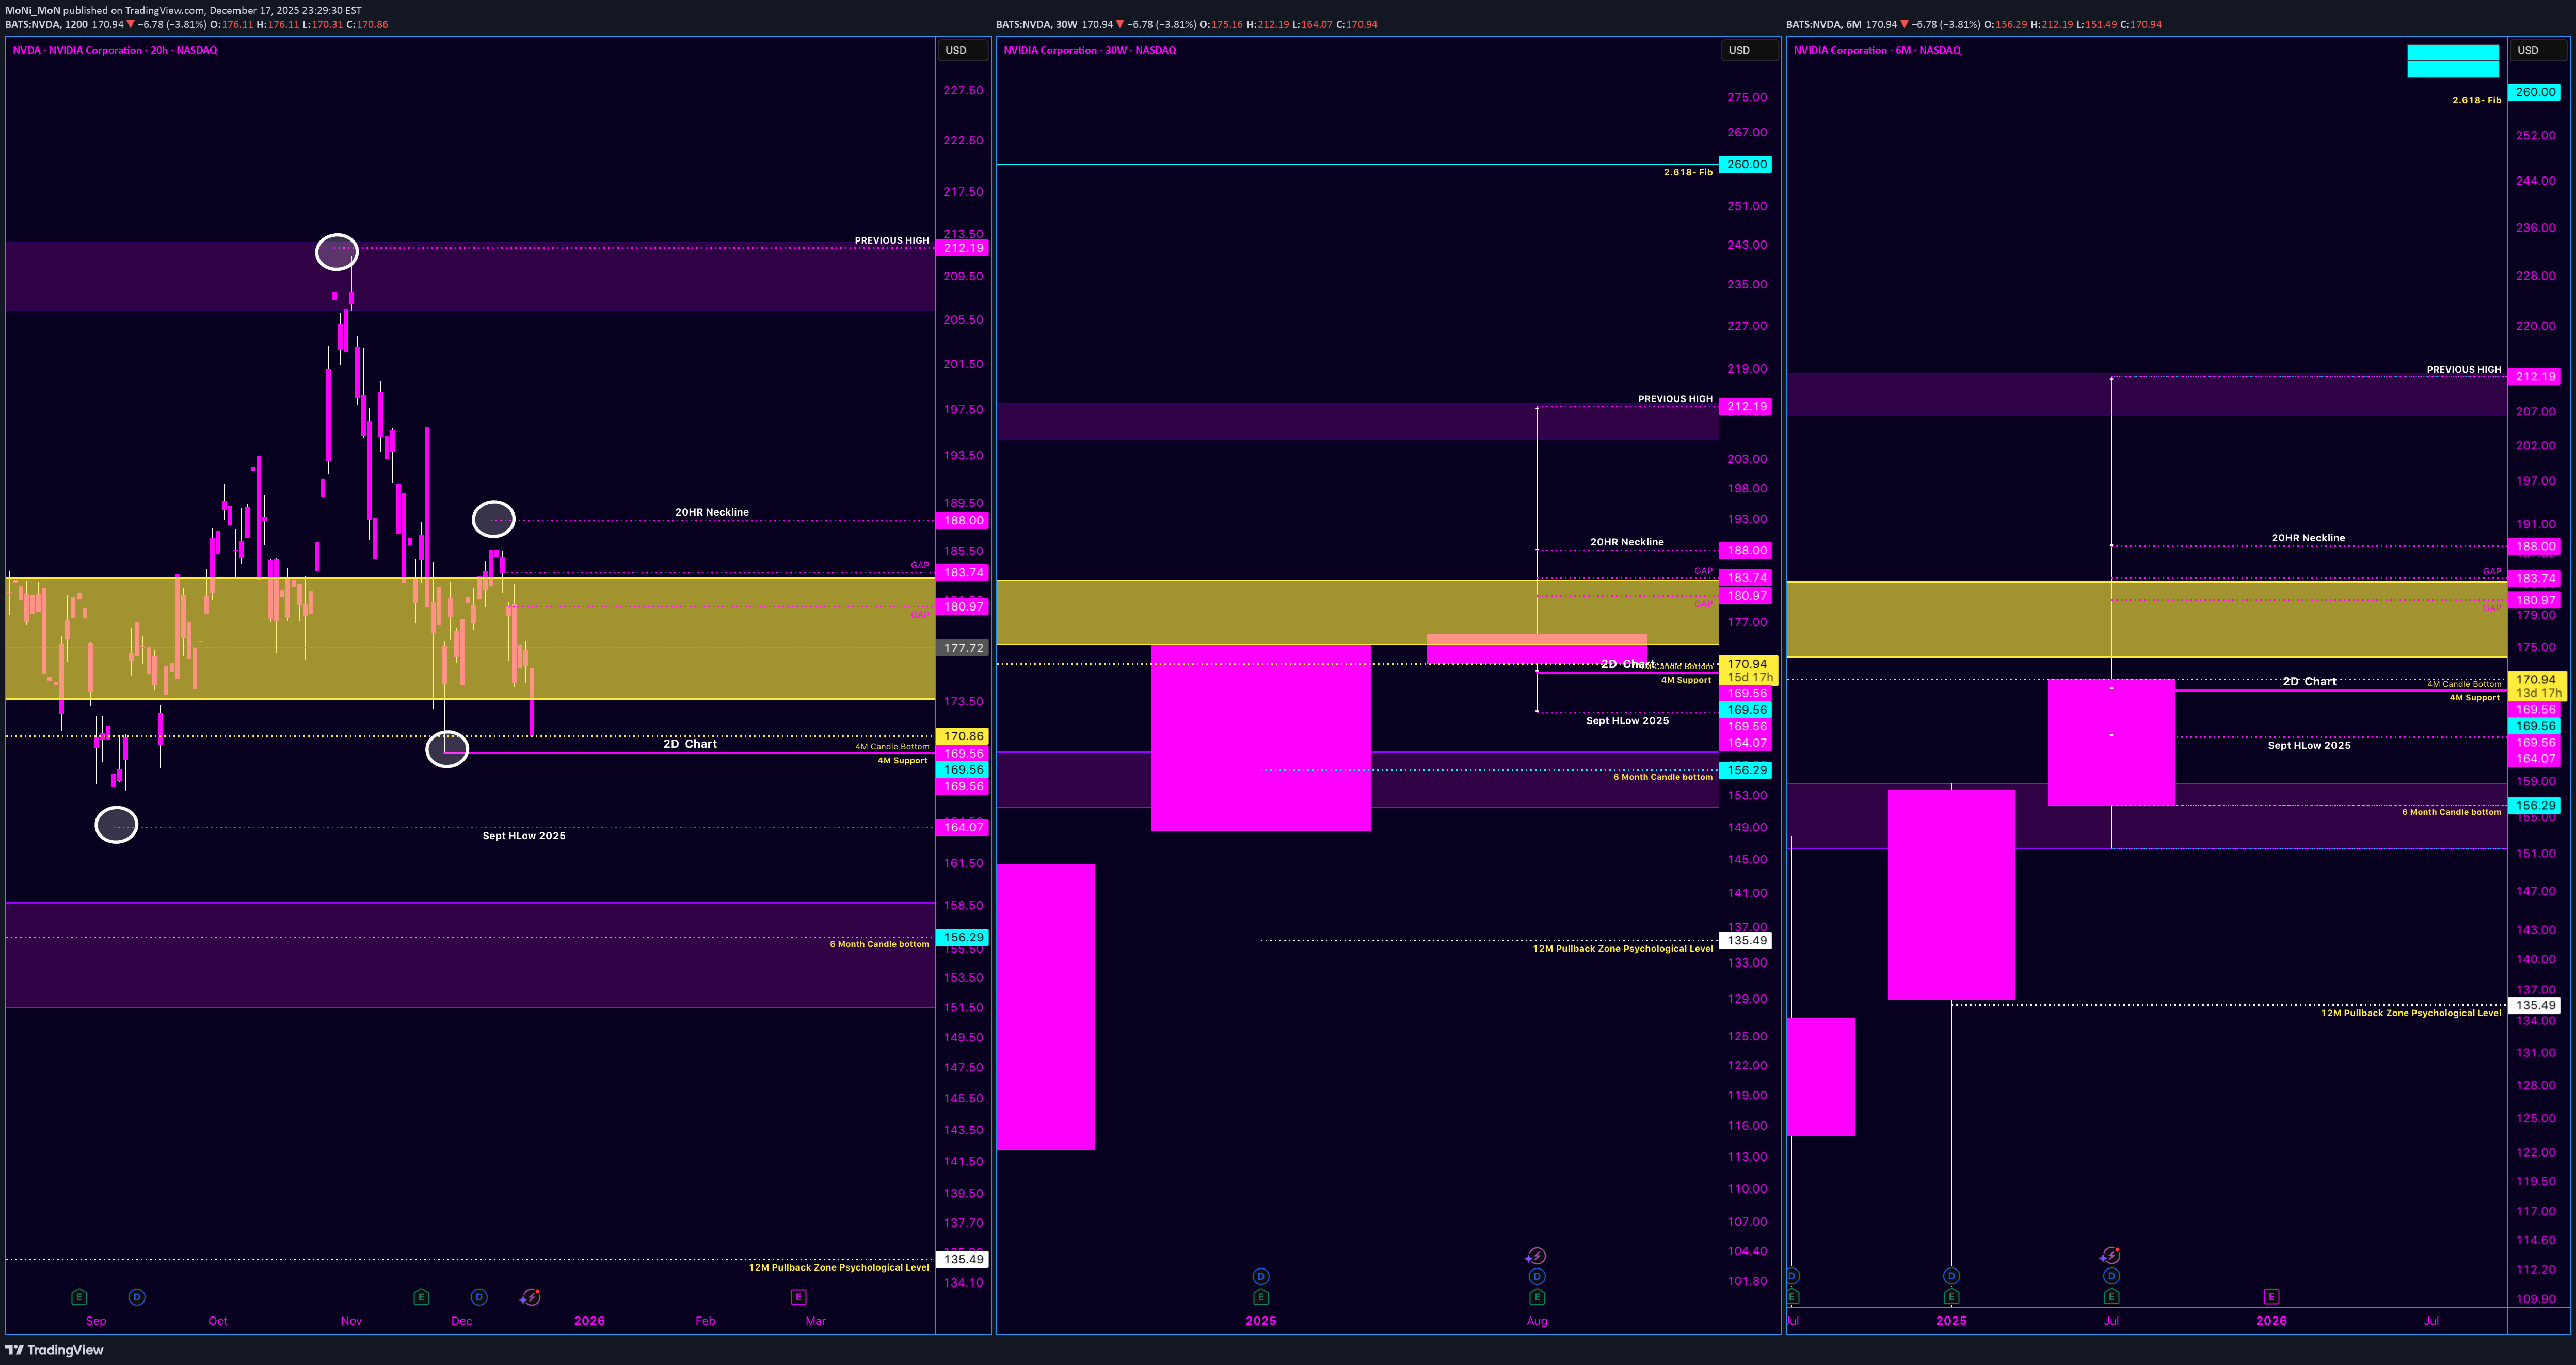
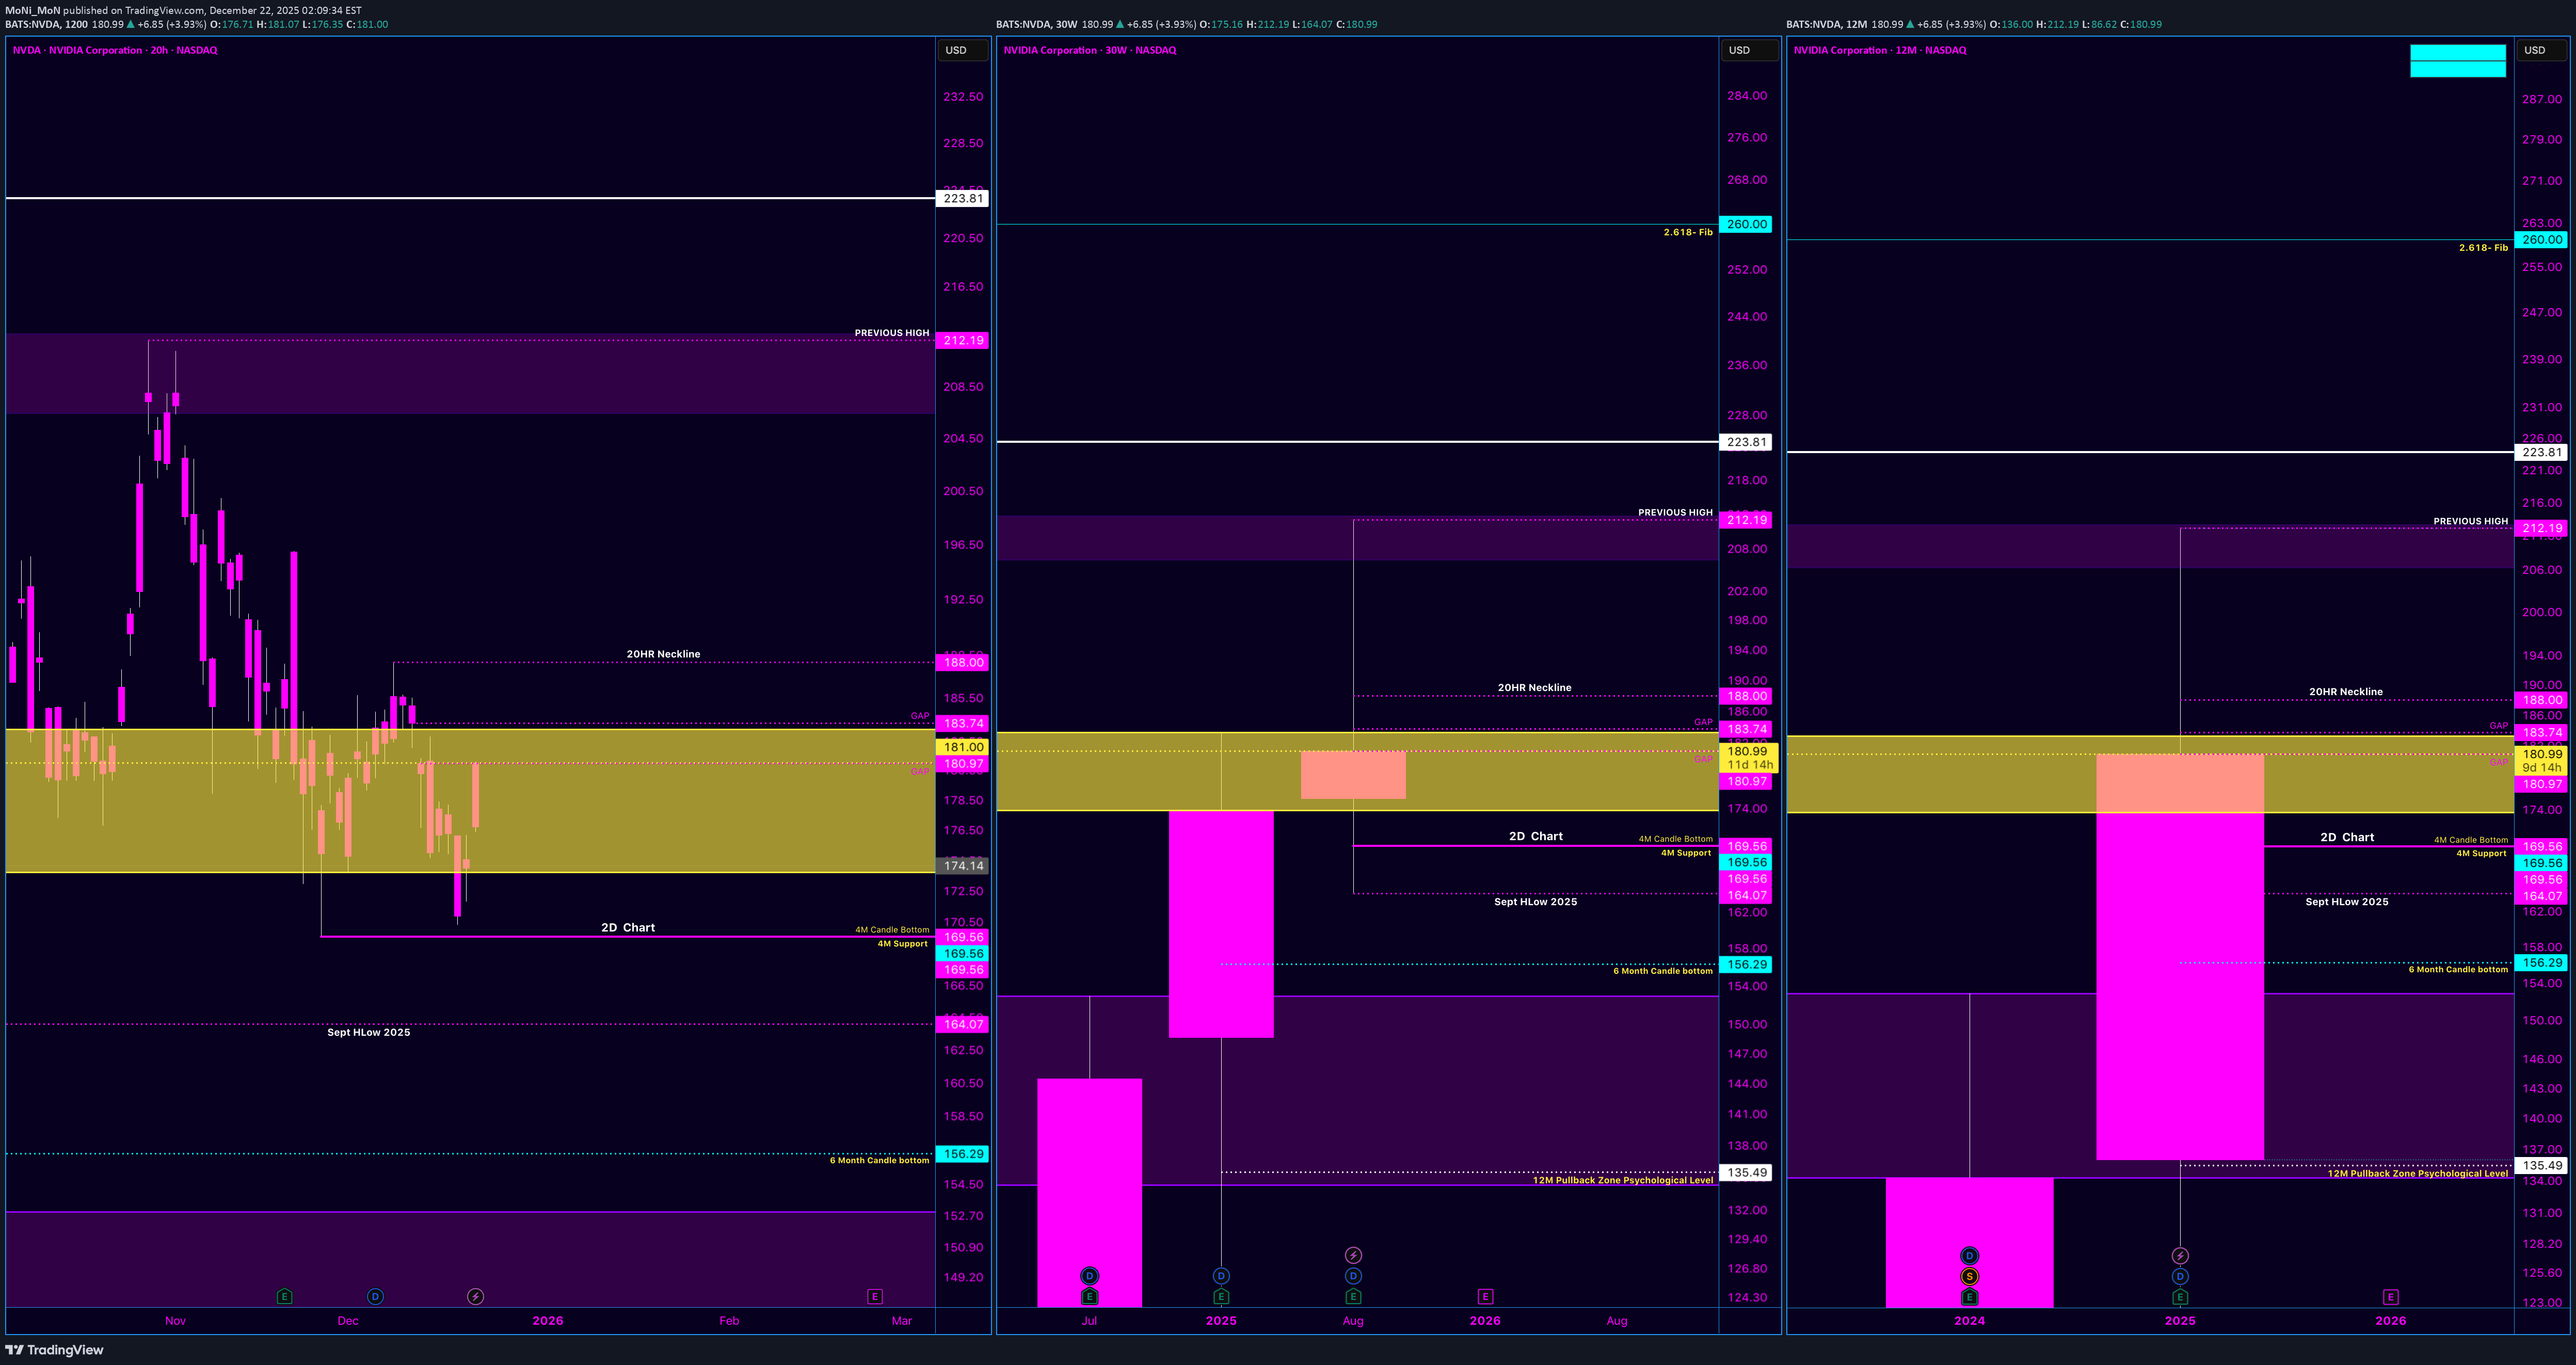
First off, I want to thank everyone for all the support on my last NVDA markup. You all showed so much love and support. Something that may seem small to some was actually a big highlight for me in my journey, and having my community behind me really meant a lot. So again—thank you. 🙏 This is how I see NVDA right now, stripping out the noise and focusing purely on structure. The Impulse That Matters We put in a clean low at 164.07 and ran all the way up to 212.xx. That move wasn’t random. It was strong, decisive, and directional — the kind of move that sets the tone for everything that comes after it. For me, that leg defines the range I care about. Everything since then is just price working off that expansion. The Pullback (Not a Breakdown) After topping near 212, price pulled back into 169.56. I don’t see that as weakness — I see it as digestion. That pullback: Stayed within higher-timeframe structure Respected prior acceptance Never turned into a clean bearish impulse So structurally, the trend didn’t break. It just paused. The Neckline / Balance Area The zone from 169.56 to 188 is the key area for me. This range has: Multiple reactions Overlapping candles Clear acceptance from both sides That tells me this isn’t trend failure — it’s balance. This is where the market is deciding whether it’s ready to continue or needs more time. That’s why I call it the neckline. Where We Are Now (Second Retest) MOST IMPORTANT Price pushed back toward 188, couldn’t hold it, and rotated back down into the 170+ area. To me, this looks like a second retest, not a breakdown. Markets rarely resolve on the first touch. They test, rotate, absorb — then decide. As long as we’re holding above 169.56, I see this as price revisiting the base before making its next move. The Big Picture (Why I’m Still Calm) So in my head, the structure is simple: 164.07 → 212.xx: Expansion 212.xx → 169.56: Pullback 169.56 → 188: Balance / neckline 188 → 170+: Second retest Nothing about that sequence screams “trend failure” to me. This is the market doing what markets do after a big move — slowing down, shaking out impatience, and testing conviction. I’m not trying to predict the next candle that is not my focus I’m watching whether structure holds and so far , it has. If 169.56 holds, the higher-timeframe story stays intact ( 6 Month Time frame/ Candle just looks healthy to me) If it doesn’t, then I reassess — not emotionally, just structurally. That’s it. No hype. No fear. Just price doing its thing and that why im staying call during this time.
MoNi_MoN
آیا انویدیا در سال ۲۰۲۴ به مرز ۱۰۰۰ دلار بازمیگردد؟ تحلیل تکنیکال صعودی
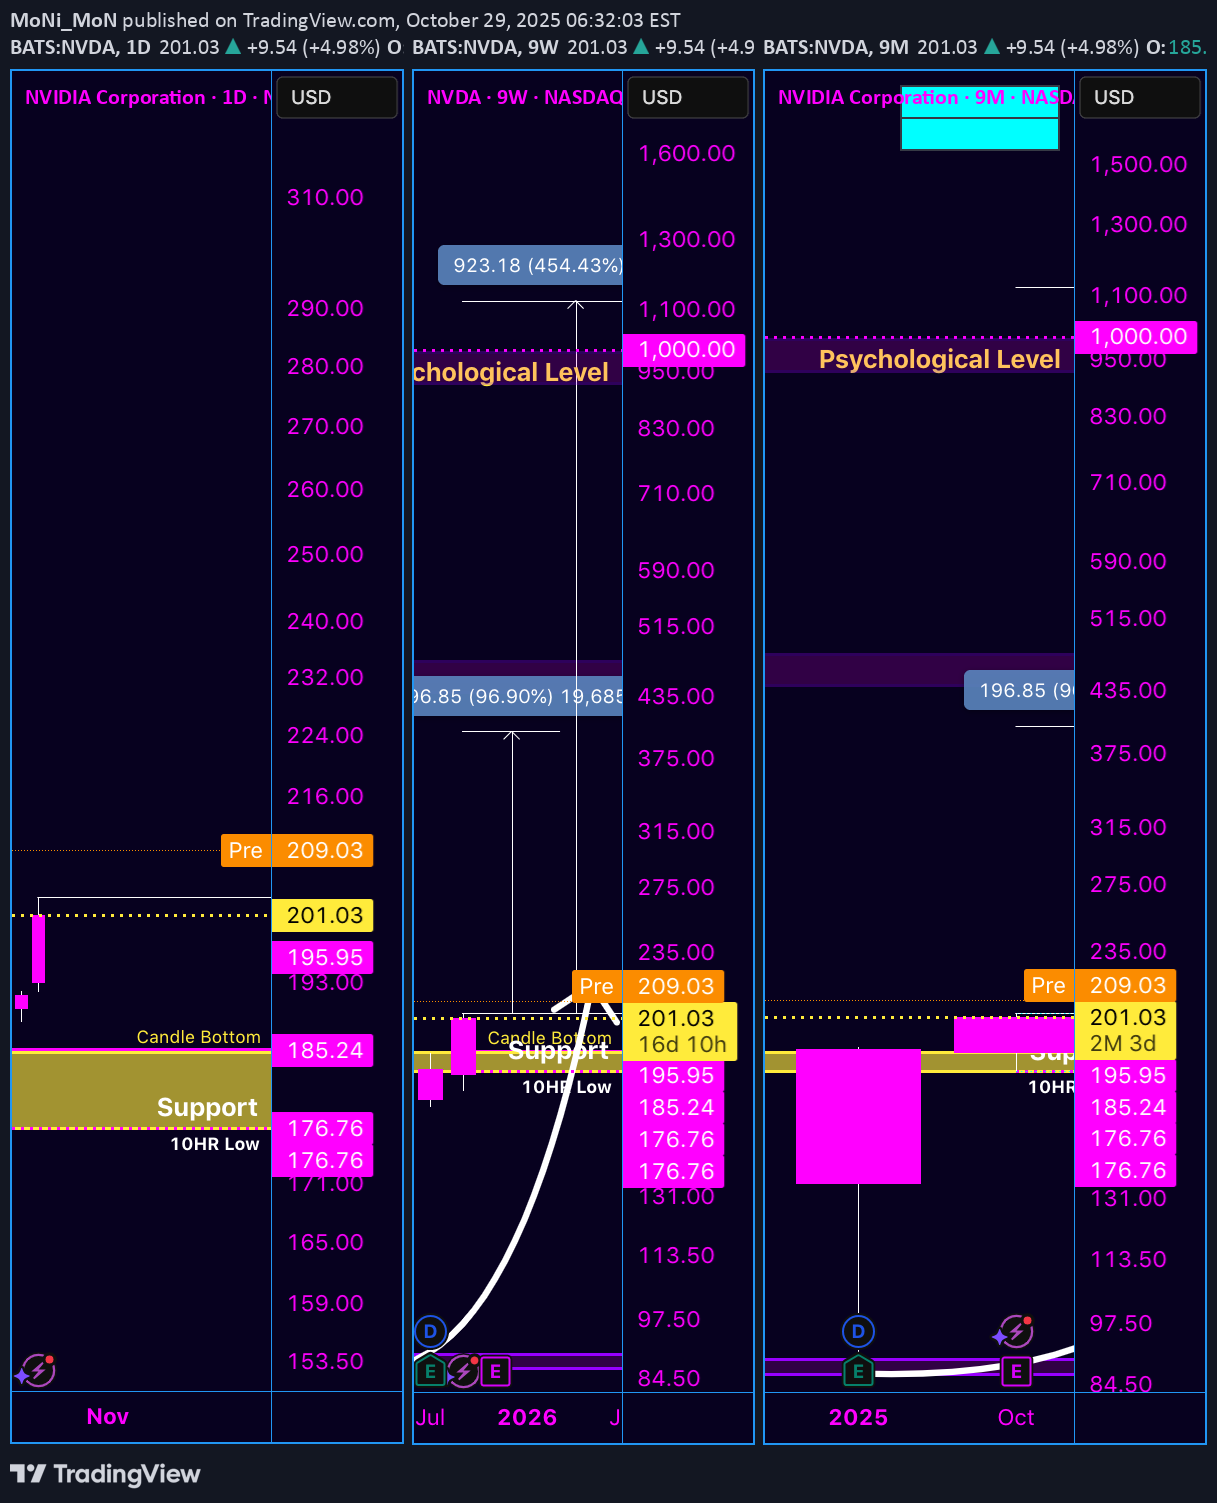
NVIDIA has been forming a clean long-term bullish structure: After its 10-for-1 stock split in June 2024, the post-split equivalent of the previous all-time high (~$1,150+) becomes the ~$1,000 zone. Price is currently establishing higher-lows around the $180-$200 range, which suggests support is stabilizing and a breakout could follow. The resistance cluster appears in the ~$230-$300 range next. Once that zone is decisively cleared, momentum toward ~$1,000 becomes far more plausible. Analysts have publicly discussed the possibility of NVIDIA reaching $1,000 or more, which adds a structural framework for the move. InvestorPlace Institutional demand for AI-infrastructure chips gives underlying support to the bullish case — the technical pattern is supported by real business strength. Why a Retest of ~$1,000 Makes Sense to me? The ~$1,000+ level represents the company’s prior pre-split peak, a major psychological barrier and structural target. With the lower base (support zone) forming now and the demand side robust, the next leg higher is likely to unfold once resistance around ~$300 is cleared. A move from ~$200 current to ~$1,000 is steep (~5×), but given the multi-year horizon and NVIDIA’s growth environment in AI, such a move aligns with long-term structural breakout patterns. The consolidation phase now gives the market time to absorb recent gains, allowing for a cleaner push higher rather than a sharp parabolic rise (which often leads to rapid pull-backs). Key Levels to Watch Support zone: ~$180-$200 — if this holds, the setup remains valid. Critical resistance: ~$230-$300 — a confirmed breakout above this zone should trigger acceleration. Structural target: ~$1,000 — once the midpoint breakout structure is in motion, this level becomes a logical target. Alternate scenario caution: If price drops below ~$180 and fails to regain ~$200 quickly, the setup would require reevaluation. My Belief I believe NVIDIA will retest the ~$1,000 level (or higher) over the next 1-2 years based on the clean structure, support formation, and macro-tailwinds in AI infrastructure. If the ~$230-$300 resistance is cleared convincingly, we’re entering the next leg of a multi-year bull run. Links NVIDIA 2024 1K
MoNi_MoN
THERE CAN ONLY BE ONE – THE STANDARD

XRP is ready for takeoff. On the 6W chart, a low was created at $1.61. Price broke above $3.39 and is moving back toward the 2025 high at $3.66. I don’t think people are ready for what’s about to happen. XRP has always been the token that outperformed Bitcoin — yet it’s still nowhere near Bitcoin’s price… for now. I remember years ago, Jimmy Vallee from Valhil Capital said XRP could reach $35K–$50K. With Ripple’s massive global banking partnerships, their invitation to the White House, and their victory over the SEC lawsuit — XRP is the most battle-tested and credible token out there. It’s been through the fire and came out shining. The days of buying XRP at $0.20 or $0.50 are gone. I still think we’re at a comfortable price right now, but once it gets past $100 — congratulations to those who held through the storms. I don’t need courses. I don’t need mentors. I don’t need paid signals or groups. I’ve reached a point in my trading career where I just know. Now, I’m on a mission to execute everything I’ve worked hard for over the last 11 years — to silence every doubter and naysayer. This is a mission for myself, my self-worth. Just me and the markets, closing out the noise, locked in on the goal. The #XRParmy is here to stay. 🚀
MoNi_MoN
Birthday Month&All I Want Is for XRP Retest Those Previous High

Right now, XRP is sitting at $2.99. But once it reclaims and surpasses that $3.84 level, we’ll officially be in uncharted territory. Some people say XRP is going to $100... others say $525... and there are even calls for $10K. All I know is this: once XRP prints a true higher high, the chart’s going parabolic. And I truly believe a lot of the Bitcoin maxis who clowned on XRP are going to be eating their words. We’ve waited, we've studied, and we've held through the chaos. So on my birthday, I’m not asking for much — just a retest of that all-time high, and a chance to ride the wave that’s been building for years. 📈 Let’s make history.
MoNi_MoN
BTC/USD – Retest Incoming? Market Prepping for the Next Move

Bitcoin is showing signs of strength as price climbs back toward the mid-zone of $105K+ after a healthy pullback. Looking across the multi-timeframe setup (5M, 20H, 12M), there are several key observations that may suggest the next leg up is brewing. 🧠 Structure Breakdown: 🔹 20H Chart We're seeing a potential retest forming after the recent bounce off the 0.786 Fib retracement (~$101,119), which aligns near the current local low at $100,377.01. Price is holding above this level, indicating buyer interest in this zone. A move toward the $108,388 to $109,048 zone is expected—this zone aligns with previous structure and Fibonacci projection. 🔹 5M Chart (Macro Outlook) On the 5M macro view, price is still holding above the previous major breakout zone, and the current candle is showing a strong recovery structure. If momentum continues, BTC may attempt to retest the $112,000 previous high. A close above that could open the door for price discovery into the $115K+ range. 🔹 12M Chart (Yearly) This is the big picture—BTC is still within a major macro range. After printing a long wick down to $74,420 earlier in the year, buyers stepped in aggressively. The yearly chart is now trading in the golden zone (0.618–0.786), with $95,976 and $101,119 acting as critical confluence levels. A successful retest of this area may lead to the completion of a bullish yearly continuation pattern, targeting the $112K breakout. 🚨 Key Levels to Watch: Support: $101,119 (0.786 Fib), $95,976 (0.618 Fib) Resistance: $108,388 → $112,000 (Previous High Zone) Breakout Trigger: Clean daily close above $109,048 Bearish Invalidator: Breakdown below $100,377 + momentum loss 📊 Final Thoughts: Bitcoin is showing signs of structure-based recovery, and the multi-timeframe analysis points toward a measured retest of key resistance. Watch for strong volume and bullish engulfing patterns at resistance zones. This isn’t a moment to guess — it’s a time to monitor, plan, and react to confirmation. 🔍
MoNi_MoN
JUNE GOLD CHART INSIGHT

Gold isn’t slowing down. Based on this structure, a retest at $3,500 looks inevitable. The Fibonacci levels line up, and current momentum shows strong continuation above the 0.618 zone. People keep saying Bitcoin is digital gold—but ironically, gold is outpacing the “digital coin” in real-time. These are wild times to be alive. 📈💰 Don’t sleep on real commodities while the crowd chases hype.
MoNi_MoN
XRP/USD – 12M Macro Outlook

🔍 XRP/USD – 12M Macro Outlook Currently, my primary focus remains on the 12-month (12M) chart, which provides the cleanest view of macro structure. From a technical standpoint, we are witnessing what appears to be a mid-cycle pullback within a broader bullish continuation. 📉 While it's theoretically possible for XRP to revisit the $2.00 level or lower, support has consistently held above that threshold across multiple higher time frames. Notably, the region between $2.00–$2.14 has shown to be a structural demand zone, aligning with prior breakout pivots and institutional accumulation zones. 📊 My conditions for confirmation: The current 12M candle must close above prior candle highs, establishing a higher high and preserving bullish market structure. A clean break and close above the $2.65–$2.70 range would signal momentum resumption, opening the door toward retesting the ATH zone of $3.40 and potentially forming new highs. ✅ This phase should be viewed as a market reset, not a reversal. The weekly and monthly momentum cycles are aligning for reaccumulation, and this kind of consolidation historically precedes parabolic expansion. In summary: 🧠 Bias: Bullish (macro) ⚠️ Risk level: Moderate (due to macro resistance near $2.65) 🛑 Invalidation: Weekly/monthly close below $2.00 🎯 Targets: $2.65 → $3.00 → $3.40 (ATH zone)
Disclaimer
Any content and materials included in Sahmeto's website and official communication channels are a compilation of personal opinions and analyses and are not binding. They do not constitute any recommendation for buying, selling, entering or exiting the stock market and cryptocurrency market. Also, all news and analyses included in the website and channels are merely republished information from official and unofficial domestic and foreign sources, and it is obvious that users of the said content are responsible for following up and ensuring the authenticity and accuracy of the materials. Therefore, while disclaiming responsibility, it is declared that the responsibility for any decision-making, action, and potential profit and loss in the capital market and cryptocurrency market lies with the trader.