Technical analysis by MoNi_MoN about Symbol NVDAX: Buy recommendation (12/18/2025)

تحلیل ساختار بازار: چرا با وجود نوسانات، آرامش خود را حفظ کردهام (بررسی سطوح کلیدی NVDA)
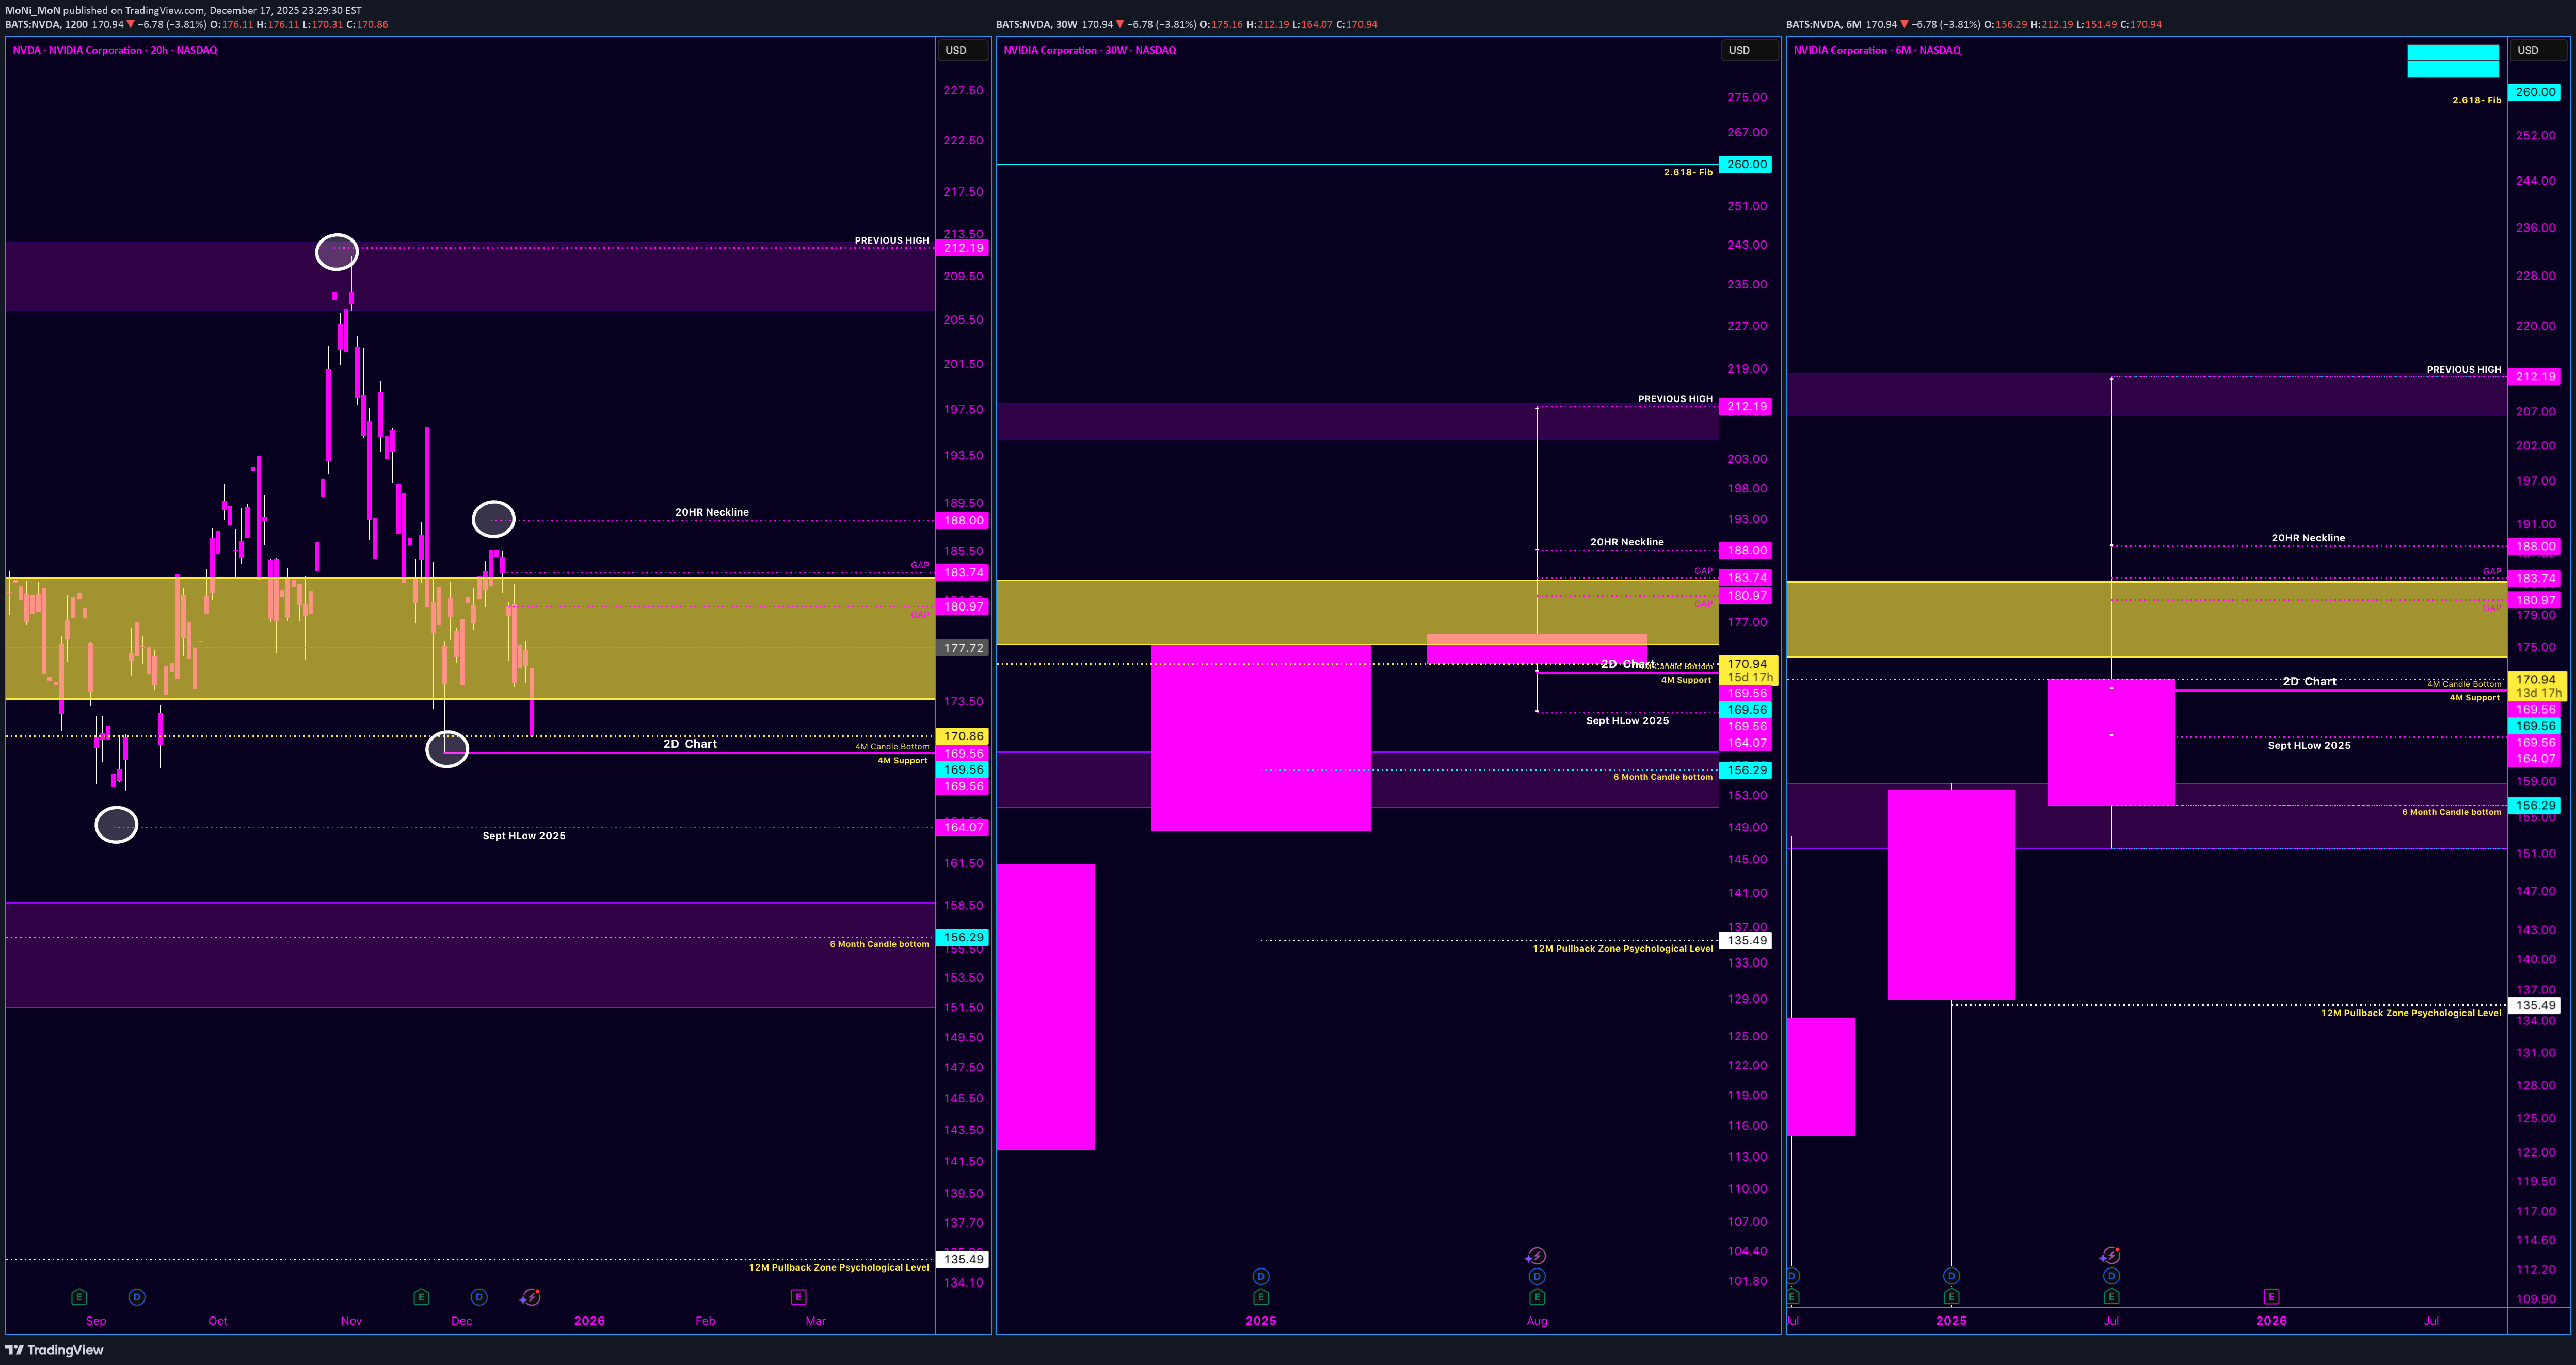
First off, I want to thank everyone for all the support on my last NVDA markup. You all showed so much love and support. Something that may seem small to some was actually a big highlight for me in my journey, and having my community behind me really meant a lot. So again—thank you. 🙏 This is how I see NVDA right now, stripping out the noise and focusing purely on structure. The Impulse That Matters We put in a clean low at 164.07 and ran all the way up to 212.xx. That move wasn’t random. It was strong, decisive, and directional — the kind of move that sets the tone for everything that comes after it. For me, that leg defines the range I care about. Everything since then is just price working off that expansion. The Pullback (Not a Breakdown) After topping near 212, price pulled back into 169.56. I don’t see that as weakness — I see it as digestion. That pullback: Stayed within higher-timeframe structure Respected prior acceptance Never turned into a clean bearish impulse So structurally, the trend didn’t break. It just paused. The Neckline / Balance Area The zone from 169.56 to 188 is the key area for me. This range has: Multiple reactions Overlapping candles Clear acceptance from both sides That tells me this isn’t trend failure — it’s balance. This is where the market is deciding whether it’s ready to continue or needs more time. That’s why I call it the neckline. Where We Are Now (Second Retest) MOST IMPORTANT Price pushed back toward 188, couldn’t hold it, and rotated back down into the 170+ area. To me, this looks like a second retest, not a breakdown. Markets rarely resolve on the first touch. They test, rotate, absorb — then decide. As long as we’re holding above 169.56, I see this as price revisiting the base before making its next move. The Big Picture (Why I’m Still Calm) So in my head, the structure is simple: 164.07 → 212.xx: Expansion 212.xx → 169.56: Pullback 169.56 → 188: Balance / neckline 188 → 170+: Second retest Nothing about that sequence screams “trend failure” to me. This is the market doing what markets do after a big move — slowing down, shaking out impatience, and testing conviction. I’m not trying to predict the next candle that is not my focus I’m watching whether structure holds and so far , it has. If 169.56 holds, the higher-timeframe story stays intact ( 6 Month Time frame/ Candle just looks healthy to me) If it doesn’t, then I reassess — not emotionally, just structurally. That’s it. No hype. No fear. Just price doing its thing and that why im staying call during this time.