
Michael_Wang_Official
@t_Michael_Wang_Official

What symbols does the trader recommend buying?
Purchase History
پیام های تریدر
Filter
Signal Type
Michael_Wang_Official

The crypto market has been rather lagging - in terms of performance - compared to other markets, as Bitcoin continues to range around the 100k range with every correction impacting altcoins to a higher degree. However, I believe that a bullish rally for crypto is imminent, and within crypto, the memecoin sector, specifically, will outperform all other assets. Macro Factors - The possible end (or at least temporary halt) to the wars (Iran-Israel, Ukraine-Russia). History has proven that equity markets continue to rally regardless of ongoing wars, but given that we see the situation de-escalate, we could expect further attention and conviction towards risk-on assets. - Fed's potential rate cuts in July. Fed Vice Chair for Supervision stated that if inflation remains tame, the Fed should begin lowering rates as soon as July (and it probably will). This will mark the end for quantitative tapering, and we'll begin to see massive liquidity flow back into the markets. - GENIUS Act (Guiding and Establishing National Innovation for U.S. Stablecoins Act): Essentially, the United States government will allow cryptocurrency (stablecoins) use within their regulatory boundaries, as it aligns with their strategic interests. Entities like Circle purchase US Bonds as collateral for their USDC stablecoins, which means that it's a win for both the US government and cryptocurrency market participants. I believe that we'll see an inflow of capital into the cryptocurrency markets, through stablecoins, some of which, if not the vast majority, will flow into risk-on assets like memecoins. Technical Analysis - From a TA perspective, there are multiple memecoins that present a massive opportunity, one of which is Fartcoin. - We can spot a textbook cup and handle pattern on the daily chart, after a whopping 90% drawdown from its all time highs. - We are currently seeing the formation of a handle, which is presented through the descending parallel channel. - Within the channel, there's also a textbook corrective ABC wave, as the ascending part of the cup has an impulse 12345 wave count. - Applying textbook charting techniques on this chart, we can consider an upside to the same degree as the depth of the cup, which would teleport Fartcoin's price to $2.8 levels - a 160% upside from the current price.
Michael_Wang_Official
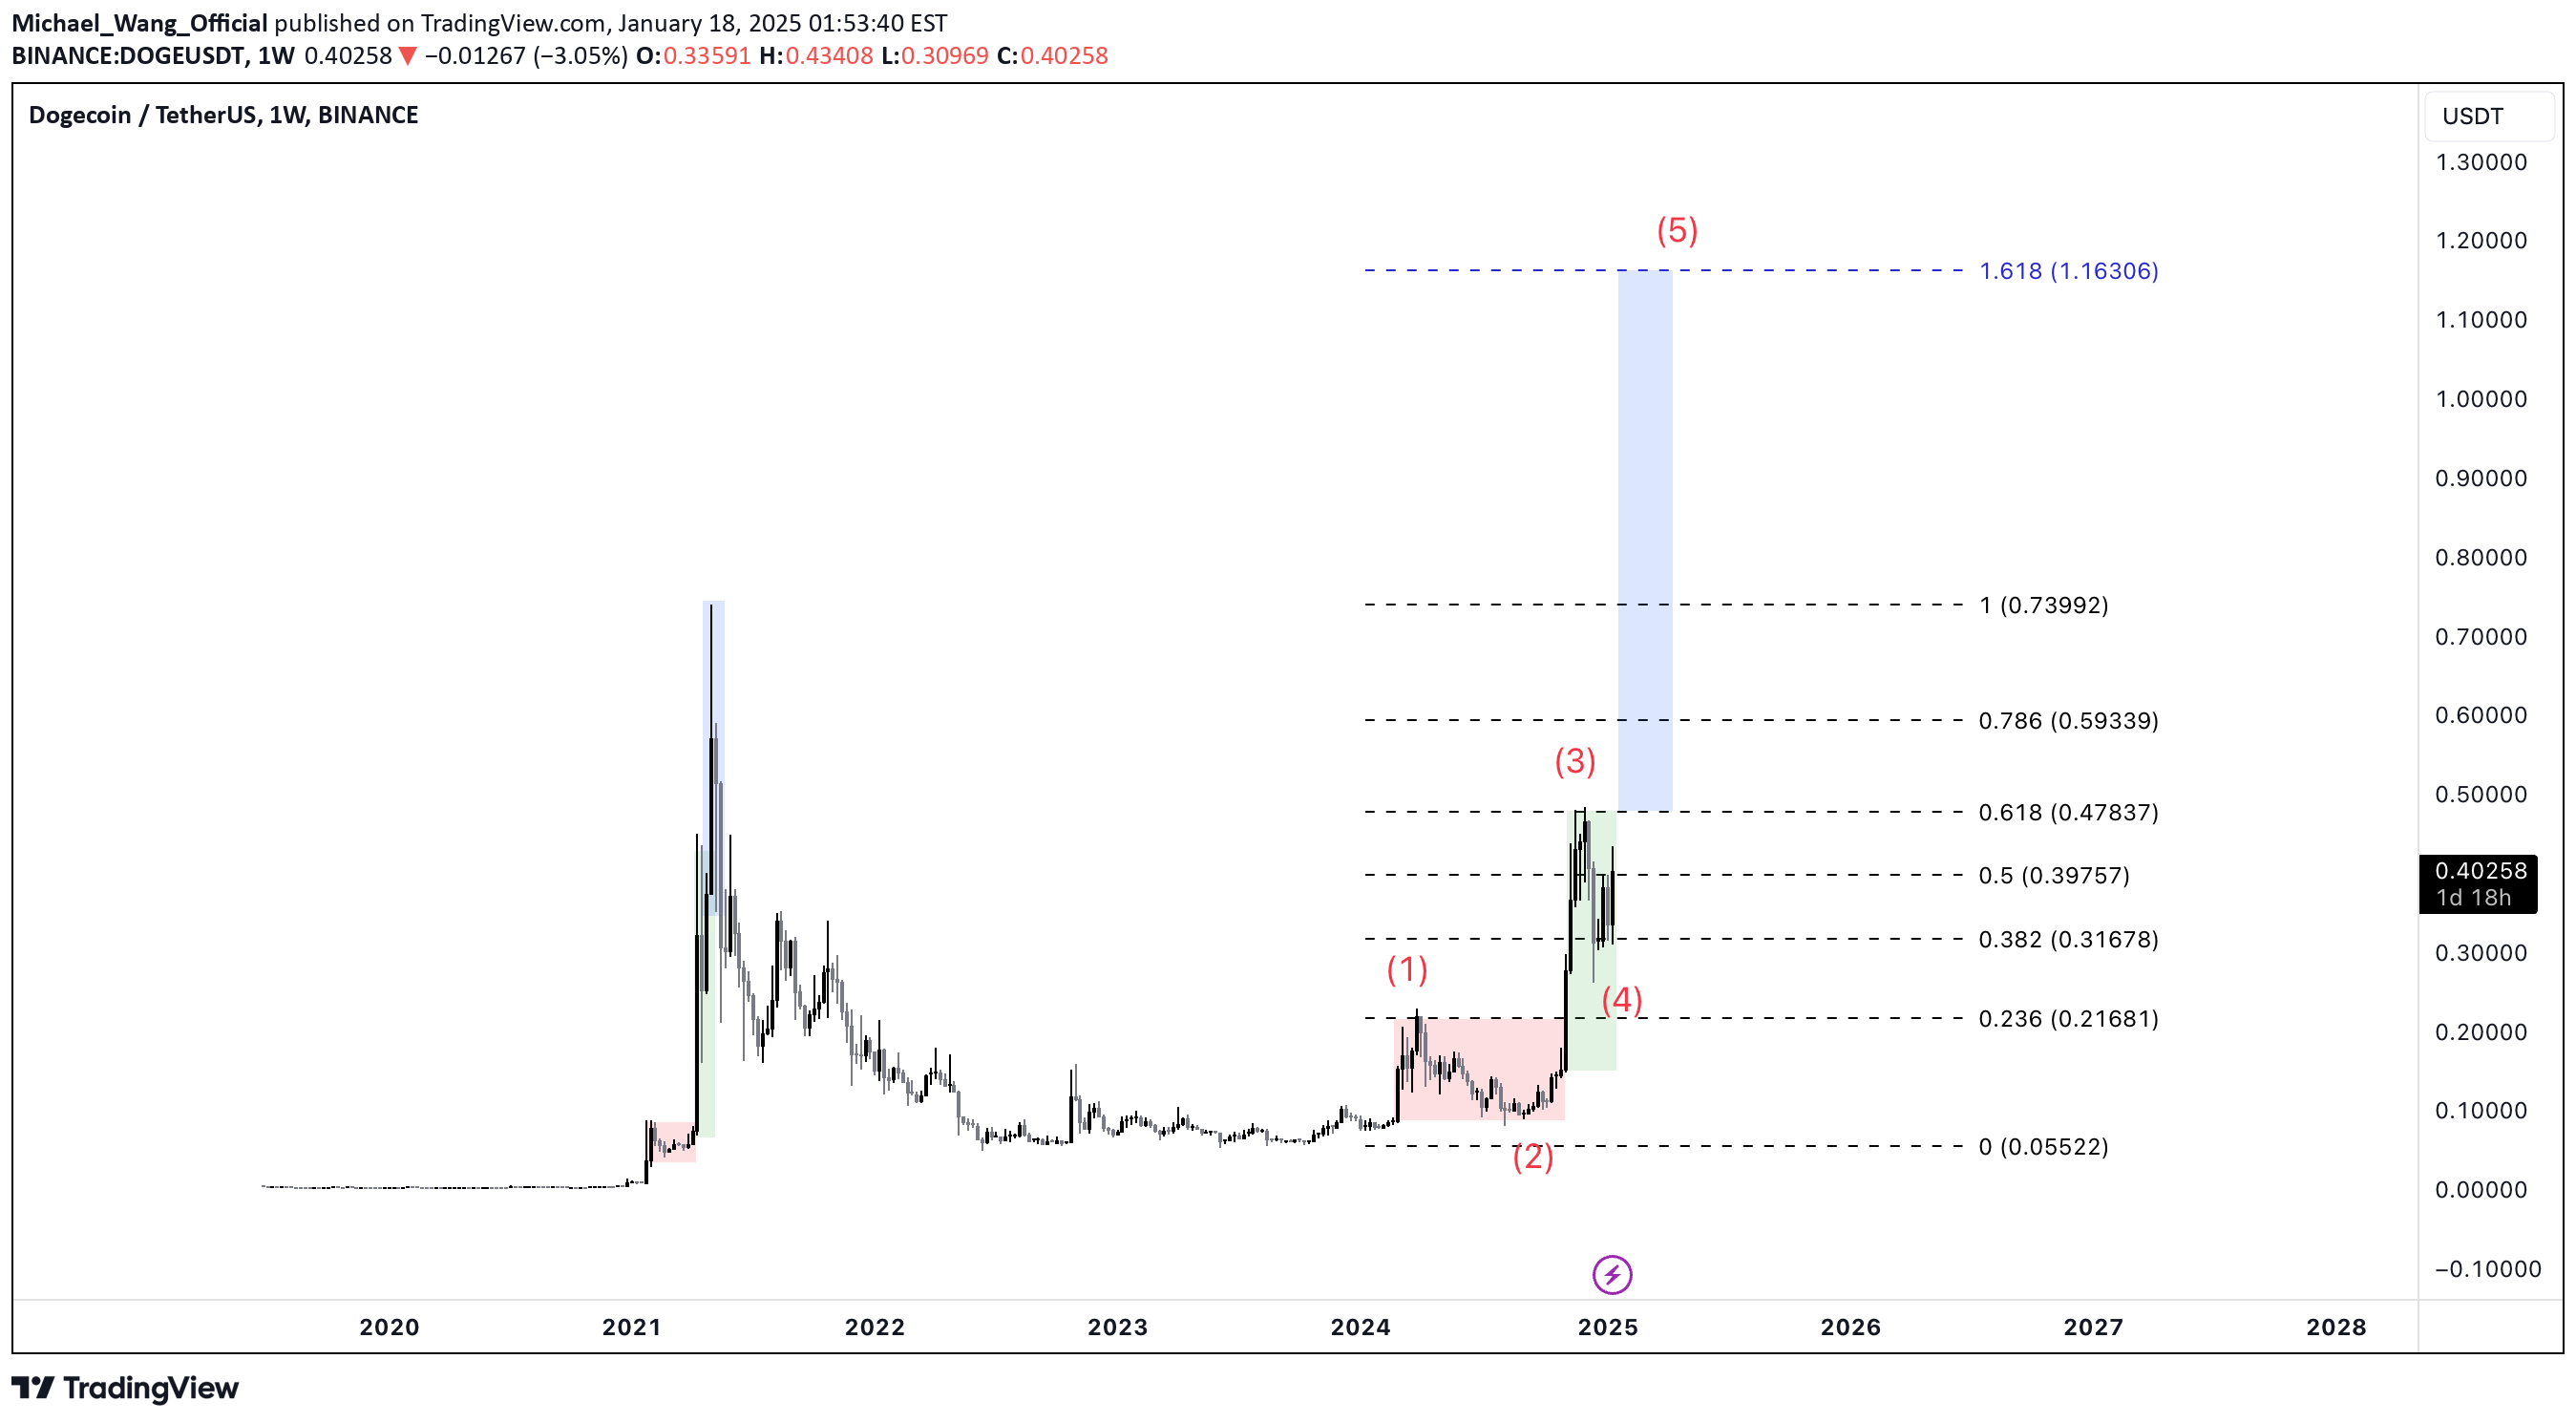
History doesn't repeat itself, but it often rhymes. Donald Trump, who is to assume office in a few days time, is an avid proponent of cryptocurrency. This entire bull run of 2024-2025 is based on memecoins, and it's hard to deny that attention will be shed on DOGE, the OG memecoin. From a technical analysis perspective, Dogecoin demonstrates perfect bounces off support and resistance of the fibonacci retracement levels. Drawing levels from its all time highs of 2021 to the lows of 2023, we have seen DOGE's impulsive and corrective waves perfectly strike the fib levels. Wave 1 formed its high at the 0.236 fib resistance, and wave 3 formed its high at the 0.618 fib resistance. We have recently seen local lows form at the 0.382 fib support, before a 12% spike in a single day. Given that extended wave 5s aren't unusual in the cryptocurrency space, and based on fractals from historical price action, it is not unreasonable to assume that DOGE can reach the 1.618 fibonacci resistance at $1.16, though I believe such highs may be short lived.
Michael_Wang_Official
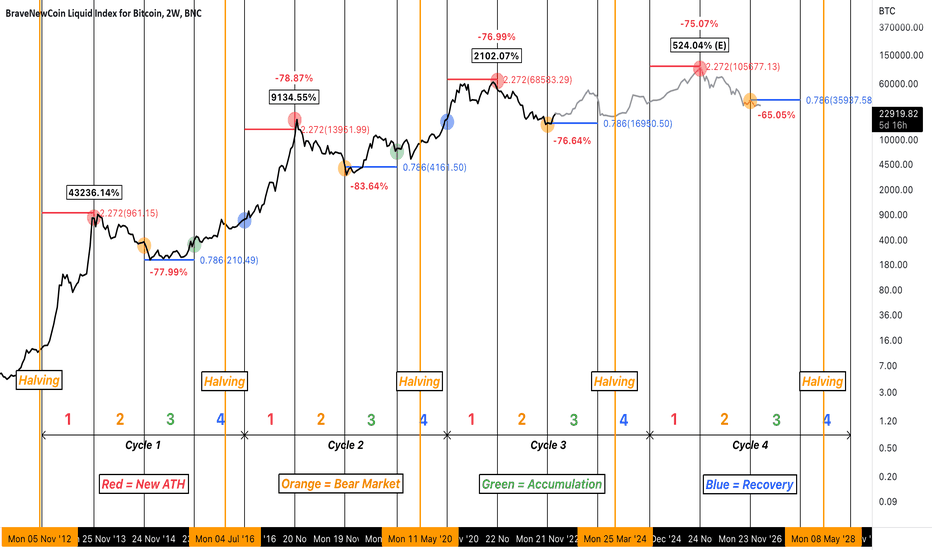
In this post, I'll be providing an explanation on market cycles referring to specific time periods and fibonacci support and resistance for key lows and highs. This post is not financial advice. This is for educational and entertainment purposes only. This post was inspired by @CryptoCon_ on twitter . Time Periods Explained - The chart may appear extremely messy, but let's break everything down one by one. - I first marked all November 28ths of every year on the chart, starting from 2012. - We can divide each cycle into a span of four years: - The first cycle lasting from Nov. 2012 to Nov. 2016, - The second cycle lasting from Nov. 2016 to Nov. 2020, - The third cycle lasting from Nov. 2020 to Nov. 2024, - and the fourth cycle beginning in Nov. 2024, ending in Nov. 2028. Again, keep in mind that this is an extremely speculative approach, based on the premise that what happened in the past, will continue to happen in the future in a similar manner. We can divide each of the cycles into 4 different phases. Phase 1: New All Time Highs - The first phase is the phase of a new all time high. - At the end of the first phase, Bitcoin marks its new all time highs. - Such was the case in 2013, 2017, 2021, and I expect it to be the case in 2025 as well. Phase 2: Bear Market - The second phase is the bear market phase. - After we see new all time highs, we start to see a decline. - In 2014, Bitcoin corrected 78% from its all time highs, - 85% from its all time highs in 2018, and 75% in 2022. Phase 3: Accumulation - This is a phase of accumulation. - However, this is not to say that we will only see sideways action. - From 2014 to 2015, we saw a classic price action of accumulation, - and from 2018 to 2019, we saw a textbook accumulation pattern, followed by an echo bubble. - However, it is imiportant to note that this echo bubble (or more specifically, its burst) is what set up the foundation for a massive bull rally that led to new all time highs. - According to this cycle, we are currently seeing Phase 3, where I expect a similar echo bubble to take place. I’ll elaborate more on the current status later. Phase 4: Recovery - This is the phase of recovery. This is where we know that the price has bottomed out already, and that we set off to rally towards new all time highs. - Interestingly enough, all Bitcoin halving events took place in the 4th phase of this cycle classification. Estimates for Cycle 4 - For the current cycle (cycle 4), I believe that the echo bubble thesis is in play. - The Fed cannot taper forever, and there is still enough liquidity to be injected into risky assets. - Despite Bitcoin moving from $16k to $23k in a matter of days, the interest from the general public is nonexistent. - I believe that a move to 30k is highly likely, and that depending on market situations, we may even see a move up to $45k in the end. Comparison of Past Echo Bubble - Let’s compare the current situation to that of the echo bubble in 2018-2019. - In 2018-2019, we saw Bitcoin rally 268% in an echo bubble. A move from $16k to $45k, today’s echo bubble, would account for a 211% move. - As for the degree of correction, in 2018-2019, we saw the price slash in half once again - a 56% downward move. - Taking that into account, and applying the same figure in today’s market situation, that would mean a correction from $45k to $23k. - If we trace fibonaccin lines based on this speculation, this gives us a target price of $105k per Bitcoin by 2025. - As for the bear market that will follow, we can expect a bottom to form around $36k, although it’s likely that prices will almost definitely hover below this level. Statistics - Let’s take a look at some patterns we can spot in terms of statistics: - In the first cycle, Bitcoin dropped 77.99% from its all time highs - In the second cycle, Bitcoin dropped 83.64% from its all time highs - In the third cycle, Bitcoin dropped 76.64% from tis all time highs - Assuming that Bitcoin drops 75-85% during the bear market after peaking at new all time highs, anticipating a 65% drop in 2026-2027 would be a conservative, yet realistic estimate. - As for the returns Bitcoin provided every cycle; - In the first cycle, Bitcoin delivered 43,236% returns from the lows to highs. - In the second cycle, it delivered 9,134%, which is a 78% reduced figure compared to the previous cycle. - In the third cycle, it delievered 2,102%, a 77% reduced figure compared to the previous cycle. - In the fourth cycle, the current cycle, if it reaches $105k all time highs, it would be delivering a 524% return from its lows, which is a 75% reduced figure compared to the third cycle. Conclusion In this post, I take a very rudimentary, speculative, yet simple and direct approach in analyzing Bitcoin’s cycle through this specific framework. This analysis aims to provide a general understanding of when things happen, and to what degree they take place. Based on this framework, I believe that we could see an echo bubble take place in 2023, with Bitcoin reaching $45k, before it corrects down to $23k. Around the end of 2023 to 2024, we would see a phase of recovery in which Bitcoin slowly crawls back up, until it reaches new all time highs of $105k in 2025 before correcting down below $36k in 2027. If you like this educational post, please make sure to like, and follow for more quality content! If you have any questions or comments, feel free to comment below! :)
Michael_Wang_Official
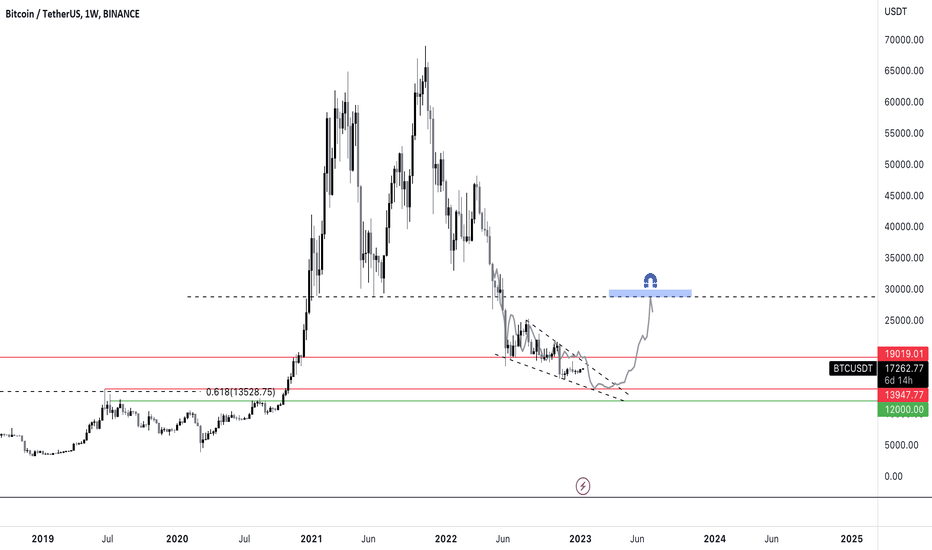
Happy new year everyone. It has been months since I've last posted. The bear market has been rough for everyone, including myself, and while I don't think we'll be headed towards a massive bull trend anytime soon, it might be too soon to let go of hope now. In this post, I'll explore a speculative scenario in which we retest $14k before moving to retest $28k, similar to the move we have seen in 2019. This post is not financial advice. This is for educational and entertainment purposes only. Any analysis or prediction about the future price of Bitcoin should be taken with a healthy dose of skepticism. With that being said, let's consider the following scenario: Analysis - I have taken fractals from the past, 2019, from historical price action that we refer to as an 'echo bubble'. - According to the fractals, one possible scenario is that we tap $14k, before making a 100% move up to $28k. - This would be a completely reasonable trajectory to have in mind, considering that we have seen a case for Bitcoin moving from $4k to $14k - Eventually, we would peak around summer of 2023, with everyone thinking that the macro bull market has resumed. - Personally, if this speculative scenario plays out, I would revert back to holding a massive cash position until the dust settles again. - People, including myself, thought we'd never get back below 20k, and here we are now, with people calling for $7k. Conclusion What I have witnessed in the past year was terrifying. Lots of people who have made generational wealth (both through crypto and equities) from 2017 to 2021, have lost everything. By everything, I don't mean seeing -70/80% losses on their accounts. I mean literally seeing nothing but 0. These were people who we thought have 'supposedly made it'. We can even take the case of the whales who had deposits on FTX. Of course, there were small retail investors who have lost their humble earnings , but there were also individuals who have lost millions on FTX. The market is the great humiliator, and will take from the impatient, and transfer wealth to the patient. Don't forget that there's always plenty of opportunities, and that more likely than not, you will have a chance to buy cheap Bitcoin - cheaper than you've ever anticipated. Stick to the plan, and make sure you accumulate assets of value. As to what is considered 'valuable', is something you have to ask yourself. If you like this post, please make sure to like, and follow for more quality content! If you have any questions or comments, feel free to comment below! :)
Michael_Wang_Official
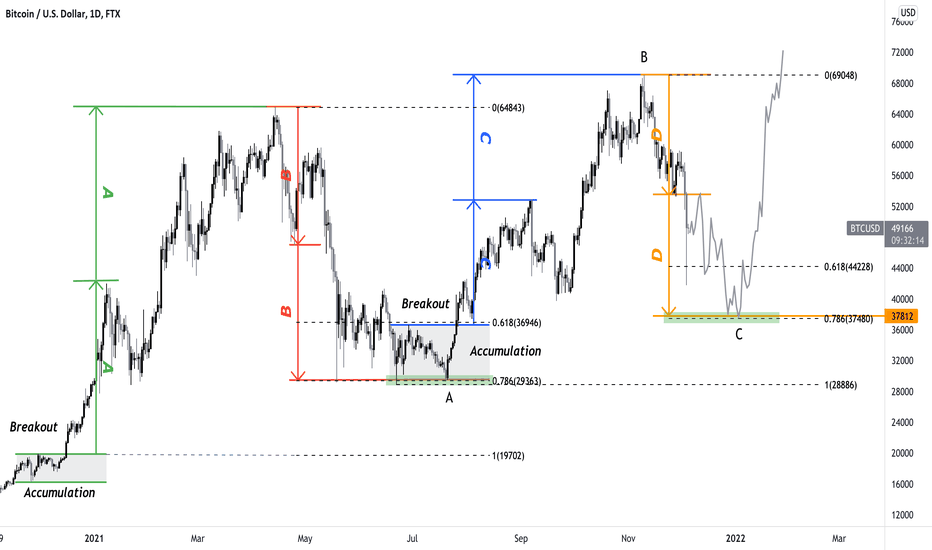
In this post, I'll be sharing a secret tip that I use to identify local tops and bottoms for Bitcoin. With that, I'll also demonstrate how that can be applied to Bitcoin's daily chart in order to explain where we're headed.Disclaimer: This is not investment advice. This is for educational and entertainment purposes only. I am not responsible for the profits or loss generated from your investments. Trade and invest at your own risk.The Technical Symmetry- The basic concept of what I refer to as the technical symmetry is as follows:- When we see an impulse, or a corrective move that makes a local high or local low, there's a high probability that it'll move up or down once again in the same proportion, regardless of the price action that takes place after a local top or bottom has formed.- For instance, take a look at the green arrows. We can see that after a small phase of accumulation, the price breaks out, and forms a local top near 42.5k.- While it does undergo a slight correction afterwards, we can see that the price continues to move upwards in the same direction, with the same degree of strength and momentum.- The key idea revolving this theory are market trends, and the strength and momentum behind the trend.- For corrective moves as well, we can also see how they can be applied to identify local bottoms with the arrows marked in red.Bitcoin Daily Chart Analysis- Now taking a look at Bitcoin's daily chart, we can see that the current corrective trend we're looking at (arrow D, orange), is very similar to the previous corrective trend (arrow B, red) in many ways.- Both moves demonstrated a dead cat bounce, and a huge bearish engulfing candle that left a huge downward wick- So using the technical symmetry theory, we can conclude that a move down to 37.8k is probable.- This level also aligns with the Fibonacci retracement support of 0.786- In the previous correction, we also saw Bitcoin bottom out at the 0.786 Fibonacci retracement level, and accumulate as the price ranged between the 0.786 support and the 0.618 resistance.- As for this short term downtrend, I expect something similar to happen in terms of the price action.- If we were to break through 61k with strong momentum, and close above those levels on the daily, this scenario would be negated, and we would immediately resume to the bull rally.- However, I feel that such scenario is less probable. Thus, any bounce we see up to 61k, unless solid confirmation is provided, should be viewed as an opportunity to shave off bags that might be underwater, as they should be interpreted as technical bounces.- It's also important to understand that such price action on the daily makes sense in terms of the Elliott Wave theory, and Bitcoin's macro bull trend.- Simply put, we are currently in the process of finalizing wave C from a running flat pattern on the 4th impulse wave.Macro Elliott Wave Analysis- On the macro trend, not much has actually changed.- Despite the fear from market participants, the macro Elliott Wave count remains rather solid.- As mentioned above, we are currently in the 4th impulse wave, which seems to be a running flat pattern.Running Flat Pattern Explained- For those of you who don't know, a running flat pattern is a corrective wave that takes place, in which wave C completes at a higher price than wave A, due to the existing bull sentiment and buy momentum within the market.- The smaller counts on the daily chart, and the larger trend on the weekly chart suggest that we are merely in a corrective phase within a larger bull trend.- So going back to Elliott Wave counts, the current trading range on the daily (between 30k and 60k) suggests the following:- Since wave C must complete at a higher price point than wave A, the price cannot fall below 28.5k.- Even if the price were to drop to 30k, since it is technically still higher than the price at which wave A was completed, the count would be valid.- Taking into consideration the fact that this is a running flat pattern, there is no guarantee that we won't touch the untapped demand at upper 30k regions before we resume to a bull trend.ConclusionA lot of people are looking for a relief rally to take place, thinking that $47-49k ranges are good buy opportunities. However, knowing that wicks tend to get retested again, and that there's a high probability that we are in a running flat pattern, there's a high probability that we'll be retesting upper 30k regions, specifically the $37.5-37.8k zone as the final price floor before moving onto the fifth impulse wave of this cycle. This would be a scenario that bring maximum pain to market participants, and as such, meticulous risk management will be key to survival.If you like this educational post, please make sure to like, and follow for more quality content!If you have any questions or comments, feel free to comment below! :)
Michael_Wang_Official
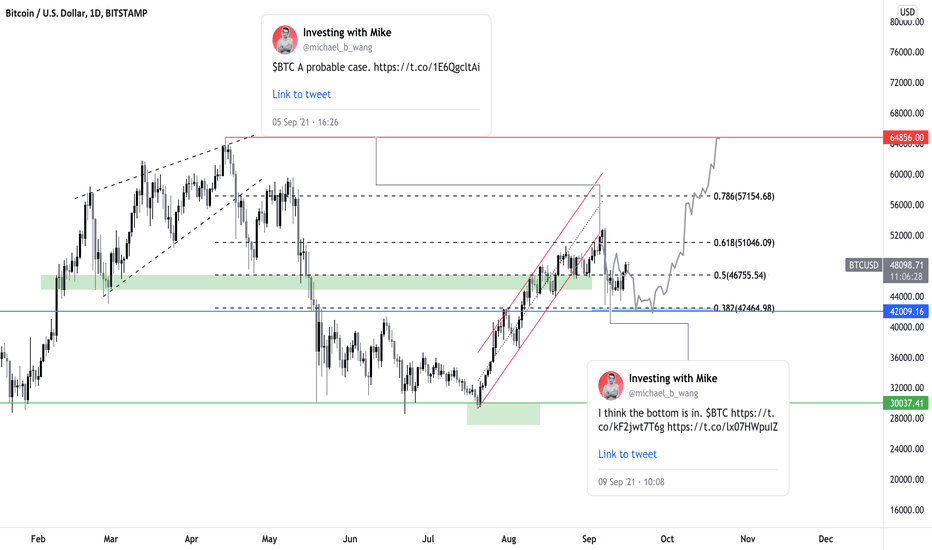
In this post, I'll be going through Bitcoin's daily chart, with references to my tweets to not only demonstrate how I was able to anticipate a sharp drop and bounce at 42K during the flash crash, as well as why I think our next stop will be retesting all time high levels.Disclaimer: This is not investment advice. This is for educational and entertainment purposes only. I am not responsible for the profits or loss generated from your investments. Trade and invest at your own risk.Past Price Action Analysis- From Feb. 2021 to Apr., we continued to form higher highs and lower highs, in which a rising wedge pattern was created- This could also be seen as an ending diagonal from the perspective of Elliott wave theories.- We saw an all time high formation at 64.8k, and a drop down to 28k- During the bottoming range, we had a phase of reaccumulation, from the perspective of the Wyckoff Theory.- For more information on why I saw this as a reaccumulation before another bullish rally, as opposed to the end of the bull run, click on the chart below:- The consolidation range had a support of 28k, and resistance of 42k.- We then broke out of that range and continued to rally upwards, forming higher lows and higher highs- Within this price action, we could see a parallel channel forming- Around the beginning of September, we broke down this channel, and while we did continue to make higher lows and higher highs, this price action was interpreted as a pullback retesting resistance, as opposed to a continuation upwards- As such, I knew that a rejection from the support-turned-resistance parallel channel would lead the price to retest its lows- Additionally, the price had bounced to the 0.618 Fibonacci resistance- So I was expecting a correction down to the $40-42k levels, but given Bitcoin's price, 40k seemed much less probable than 42k.- As we wicked down to 42K regions due to leveraged positions getting cleaned out, I knew that there was a high chance the bottom was in.Current Situation Analysis- So what am I seeing for Bitcoin now?- There is a reverse head and shoulders continuation pattern that is currently in play- The left shoulder formed in mid-April, and the head formation is marked by the drop from 60k to 28k, and the reaccumulation phase- The current price action is demonstrating the formation of the right shoulder- And as we break through key resistance levels, there's a high chance that we will revisit all time high levels in September/October- Once we break previous all time high levels, Bitcoin might start showing a parabolic trajectory once again.ConclusionIf you carefully read the analysis above, you'll notice that I never really (and never could) accurately predict the market. I was simply looking at the overall market structure and macro cycle, with an understanding of key support and resistance levels. Patience is the magic element that helped me make tens of thousands of dollars in the past few months, as I know from past experience that Bitcoin can drop 30-40% during its insane bull runs. I hope my analysis was helpful in demonstrating how I was able to prepare for Bitcoin's insane price action, and how I was able to take advantage of it.If you like this educational post, please make sure to like, and follow for more quality content!If you have any questions or comments, feel free to comment below! :)
Michael_Wang_Official
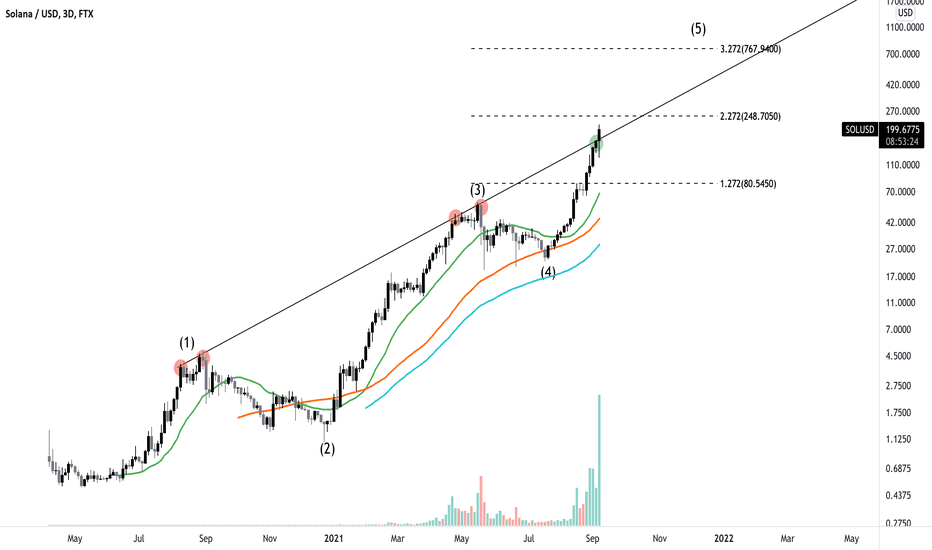
In this post, I'll be taking a technical approach to Solana (SOL) .Disclaimer: This is not investment advice. This is for educational and entertainment purposes only. I am not responsible for the profits or loss generated from your investments. Trade and invest at your own risk.Analysis- Solana is currently ranked #6 in terms of market cap, with a size of 58B.- It is a rising platform that is arguably more efficient and cheaper than existing ones.- Looking at the technicals, there are three main points that I found to be very bullish:- First, we broke through the trend line resistance that connects the higher highs.- Also, despite the massive price dump that took place across the entire crypto market yesterday, Solana has managed to maintain its momentum.- Third, the volume continues to increase as we trend upwards, demonstrating confidence from buyers.- The moving averages are also aligned in order, indicating that the overall uptrend on the longer frame is intact- Counting waves, we can see that we are currently in the midst of the fifth impulse wave.- Based on fibonacci retracement levels, we could expect strong resistance around $250, with a target up to $770.If you like this analysis, please make sure to like the post, and follow for more quality content!I would also appreciate it if you could leave a comment below with some original insight.
Michael_Wang_Official
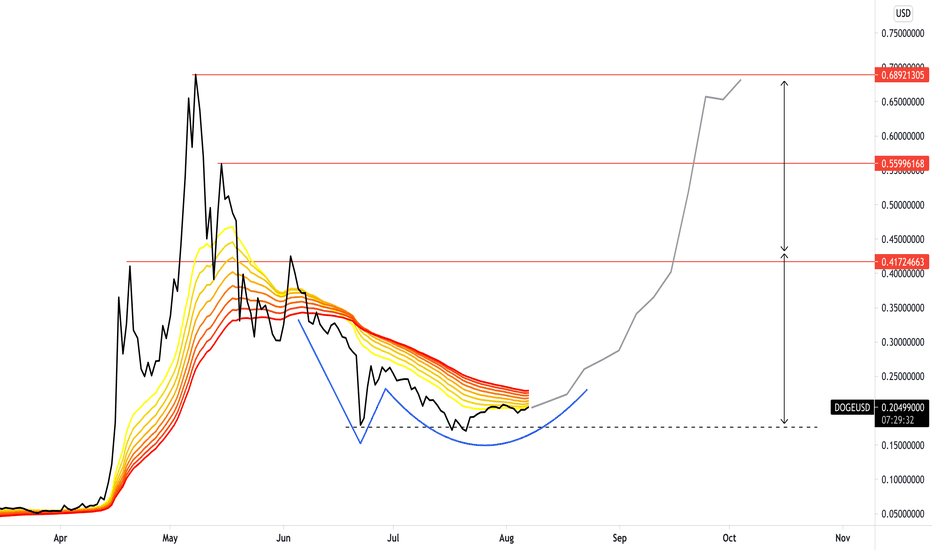
In this post, I'll be taking a technical approach to Dogecoin, one of the hottest memecoins in the crypto scene today.Disclaimer: This is not investment advice. This is for educational and entertainment purposes only. I am not responsible for the profits or loss generated from your investments. Trade and invest at your own risk.Analysis- The significant resistance lines are marked by the red horizontal lines- The price is currently trading below the Exponential Moving Average (EMA) Ribbon, indicating the need to break through in order to resume to the bullish trend- We have broken out of the short term downtrend, and have formed a bullish reversal pattern - the Adam and Eve pattern- Based on the formation of the Adam and Eve pattern and its neckline, we could expect a U shape recovery up to the $0.69 mark, given that Bitcoin doesn't correct severely.- I think that there is bullish market sentiment behind Dogecoin, that could ignite the beginning of a second rally.If you like this analysis, please make sure to like the post, and follow for more quality content!I would also appreciate it if you could leave a comment below with some original insight.
Michael_Wang_Official
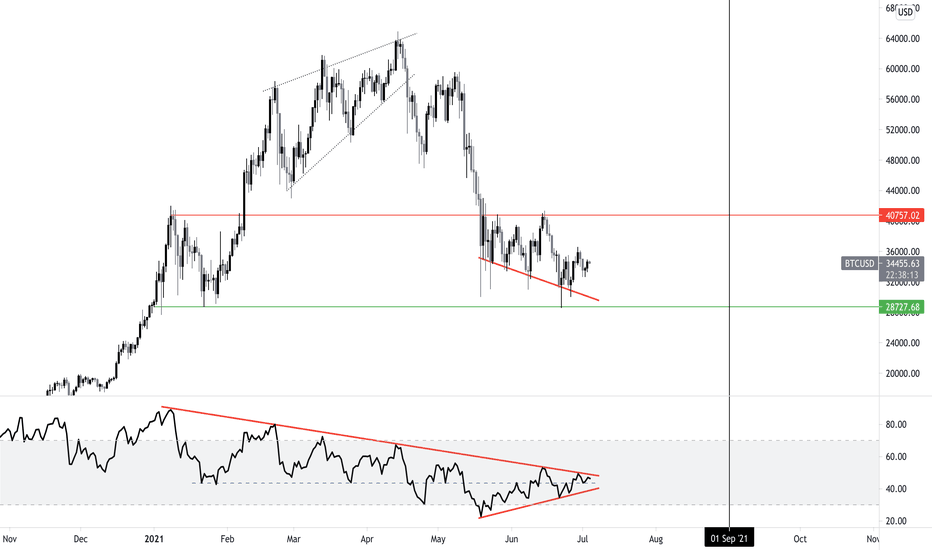
A lot of people have been talking about how Bitcoin's bullish rally is over for this cycle. However, according to my big picture, everything is still on track. So in this post, I'll demonstrate what I'm seeing for the daily chart, and signs of bullish confirmation I'll be looking for.Disclaimer: This is not investment advice. This is for educational and entertainment purposes only. I am not responsible for the profits or loss generated from your investments. Trade and invest at your own risk.Analysis- Bitcoin formed a rising wedge during its distribution phase, marking 64K as its local top.- We have broken down from local highs, and are currently accumulating within the ranges marked by the red and green lines.- The daily candle currently shows a hidden bullish divergence, with lower lows on the price action, and higher lows on the Relative Strength Index (RSI).- What's also noticeable from the RSI is that it has been accumulating within a triangular pattern, forming lower highs.- The apex of the pattern is located at around mid July, so we can anticipate a breakout then by the latest.- I don't expect this accumulation phase to last past Q3 2021.- A break above 40k is what I'll be looking for, and I'd want to see a close above 42.5k for firm bullish confirmation.ConclusionIf anything, this looks like a good region to accumulate more spot Bitcoin. Based on the long term market cycle, I believe that the probability of this bullish cycle having ended is very low.If you like this educational post, please make sure to like, and follow for more quality content!If you have any questions or comments, feel free to comment below! :)s3.tradingview.com/snapshots/g/GRsRiaGA.png
Disclaimer
Any content and materials included in Sahmeto's website and official communication channels are a compilation of personal opinions and analyses and are not binding. They do not constitute any recommendation for buying, selling, entering or exiting the stock market and cryptocurrency market. Also, all news and analyses included in the website and channels are merely republished information from official and unofficial domestic and foreign sources, and it is obvious that users of the said content are responsible for following up and ensuring the authenticity and accuracy of the materials. Therefore, while disclaiming responsibility, it is declared that the responsibility for any decision-making, action, and potential profit and loss in the capital market and cryptocurrency market lies with the trader.