
Mayfair_Ventures
@t_Mayfair_Ventures

What symbols does the trader recommend buying?
Purchase History
پیام های تریدر
Filter
Mayfair_Ventures
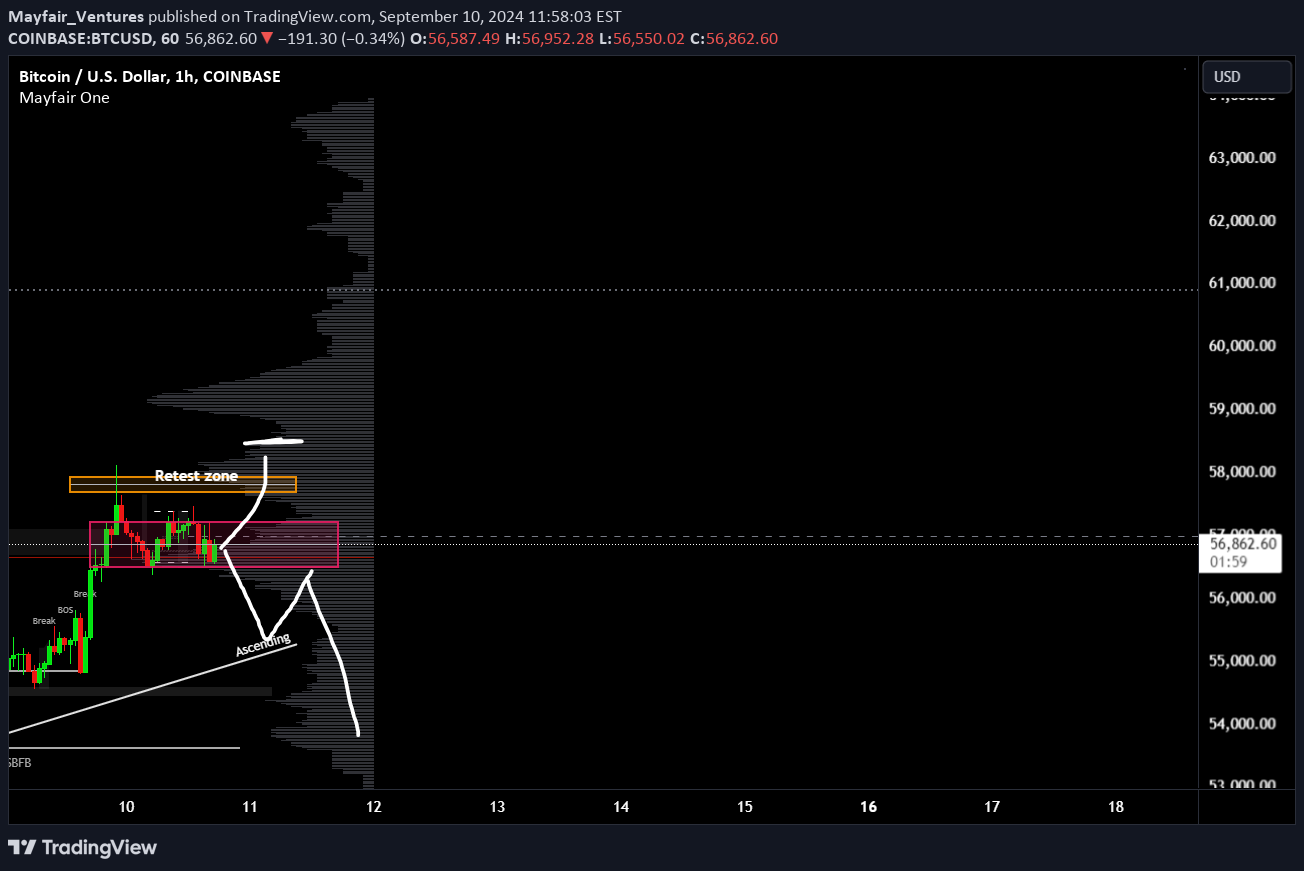
Market always looking for liquidity
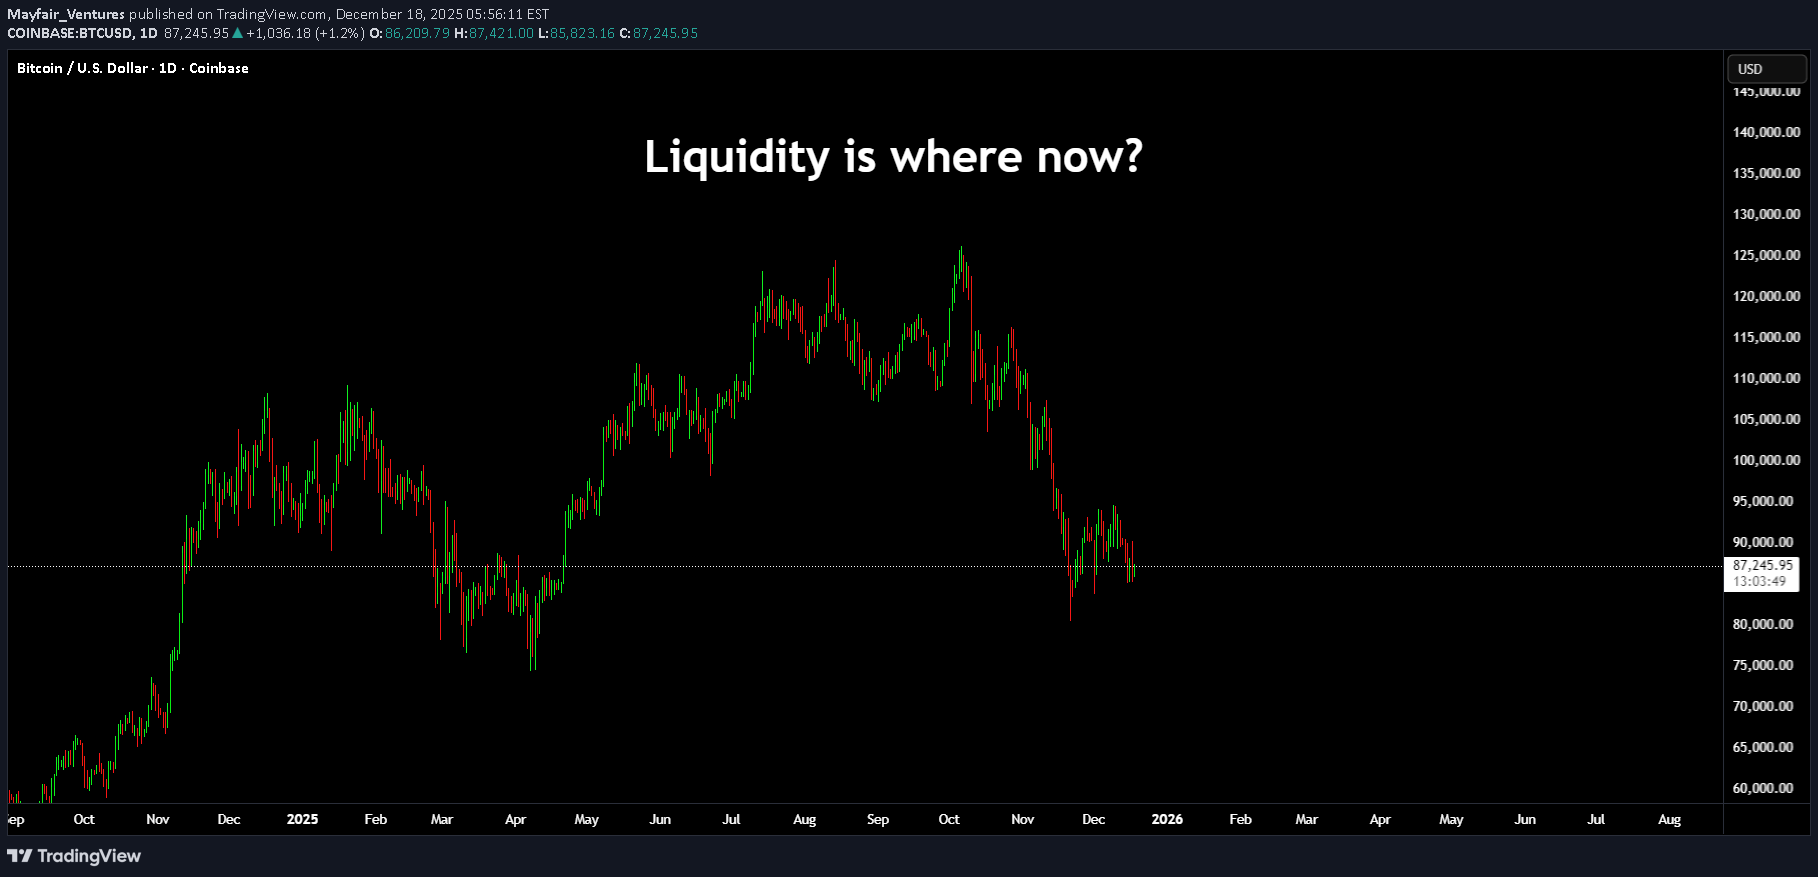
Unpopular opinion. But people are still waiting on $135k from 2021. Markets go up and they go down. Here's some general info - regardless of up or down. The basics... The local Point of control. The bigger picture. Once price reaches an external liquidity pocket, it runs out of steam as it's overcrowded in terms of the asset and there's enough supply to fulfil the demand. Depending on up or down directions. From there, the market looks to work a slower move to find internal liquidity - some will see this as a pullback or searching for an order block or imbalance. But the idea is to take eager players out and load up or sell off more for the bigger players. The price here has a nice pocket of liquidity sat just under the local low. The issue here is that there is a fair amount of buying liquidity down a lot lower, too. As you can see at roughly 60k. Next, we have a good chance that the Bank of Japan will hike rates in the next 24-48 hours. Anyway, be careful. It could be a thrill or it could be a deep slide before Xmas. Take it easy, be careful and happy Holidays to you! Disclaimer This idea does not constitute as financial advice. It is for educational purposes only, our principal trader has over 25 years' experience in stocks, ETF's, and Forex. Hence each trade setup might have different hold times, entry or exit conditions, and will vary from the post/idea shared here. You can use the information from this post to make your own trading plan for the instrument discussed. Trading carries a risk; a high percentage of retail traders lose money. Please keep this in mind when entering any trade. Stay safe.
Mayfair_Ventures
حجم و دلتا: رازهای ساده تحلیل بازار که همه نادیده میگیرند!
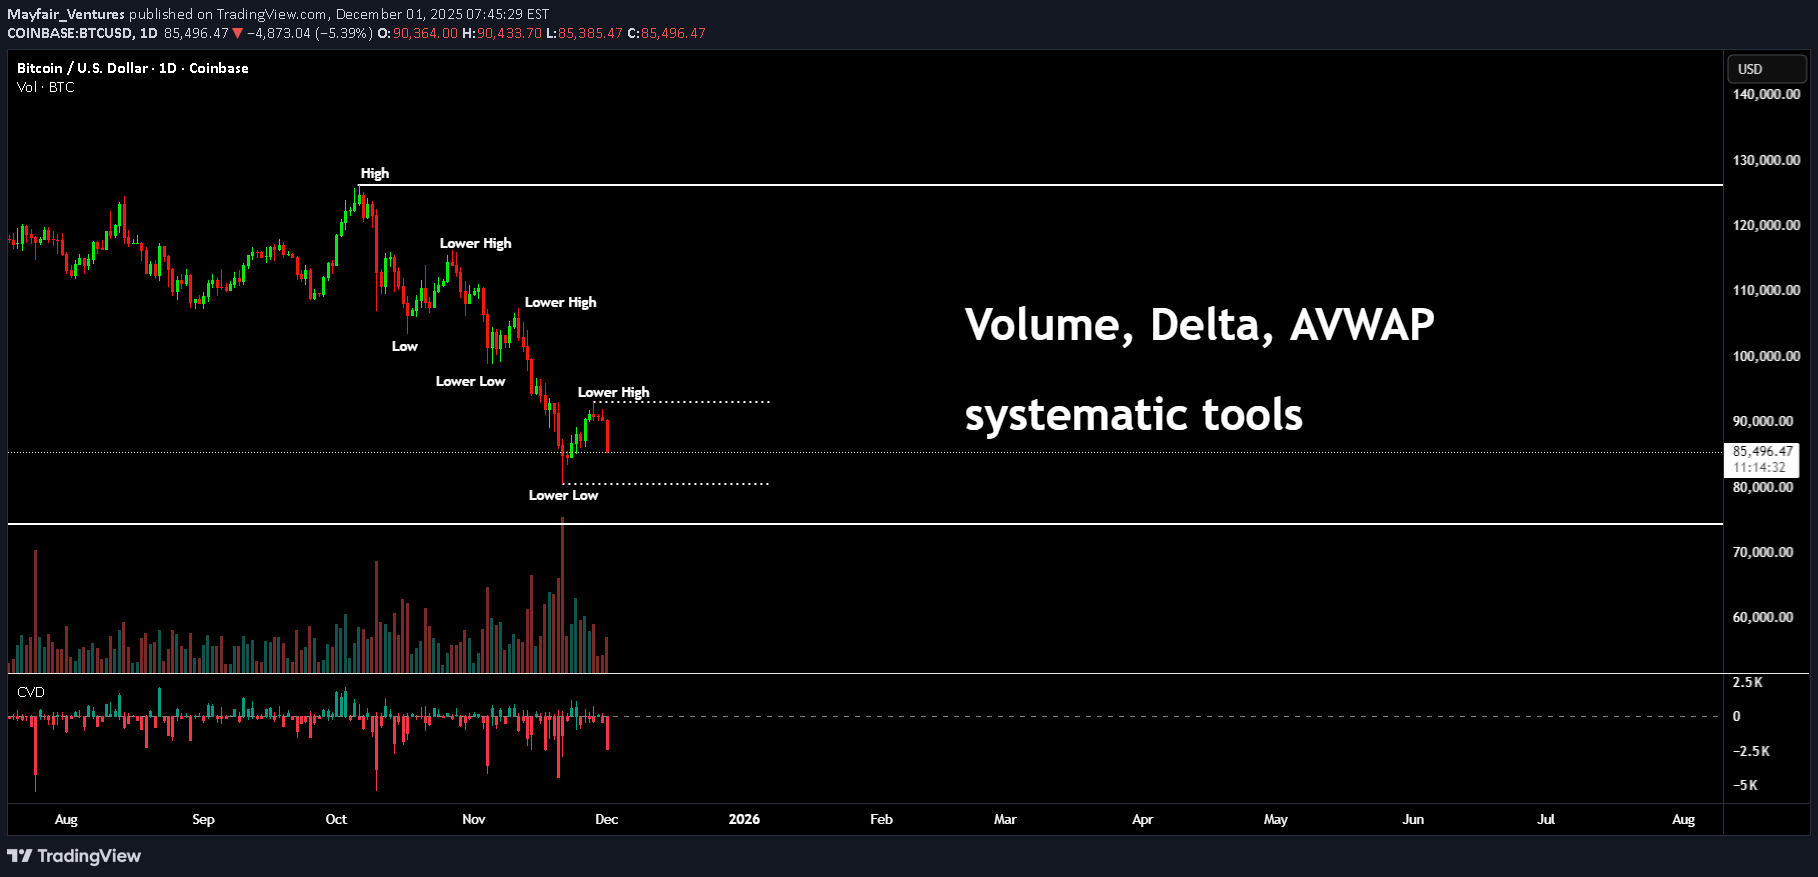
Ok, don't think this is about Bitcoin. This is just a good use case for these types of tools. All of which you can find for free here on TradingView People tend to not really understand some of these tools, maybe they get the idea but not the real value. For a long time, I used to trade footprint charts, volume delta and seeking more and more info. Now if you don't know what a footprint chart is, don't stress. Footprints are like looking inside a candlestick, it gives you both the buys and sells of each candle. That's about as much as you need to know. So why don't everyone use them? that is a complex question to answer, but in simple terms. There is no need. By following rule based techniques such as the mechanical trading system I shared in recent posts; Ok, so let me show you something. Take the simple volume tool (I have also added a CVD) more on this later. But with a quick glance, we can spot the price rising and volume dropping off. This is called Divergence. As you can see price then carries on up and the volume and CVD tools start printing a different story. Again, not an attack on Bitcoin (I know how precious and defensive some of you get). This is for any instrument. Here's another little technique; there is a pattern known as a master pattern. It's a dumbed down Wyckoff. But basically after accumulation or distribution, you see an expansion phase. This is often called a UTAD or a spring (depending on the direction) I have shown this with the PoC as the main auction area. The consolidation - also known as fair value is an area where a lot of buying and selling took place. After expanding to roughly equal distances either side of the consolidation. The price will test the PoC or middle of the auction zone again. However, where people fail to see the obvious. IS as simple as understanding the CVD and volume story. We could add other tools such as the AVWAP. You can see price rotates around the auction area. Zoom out; Here we see price drop below the blue "Value area" meaning it has dropped and is likely to rotate back to the underside of the above auction area. This we can say is a re-test. So, let's assume we rise - obviously buyers will be buying the dip. After a retest. There are even more clues as to where price will seek liquidity. For this, see the volume profile. Now, lets add another technique. This is known as internal and external liquidity. We took out prior bullish liquidity (external) then moved back internal. Price will likely seek the next leg higher, but remain internal. All before seeking external, Bearish liquidity. Here's a simple picture of highs and lows that turn into lower highs and lower lows. To get a clear read on this; we will need the price to break one of these two levels. Once we do, we have confirmation and a bias as to what pool of liquidity will go after next. But... Is there something that gives an early clue? Well yes. Look at the CVD. You see, this doesn't have to be all that complicated. Market will seek liquidity, markets don't push up and up forever. There's a saying in this space, if you can't spot liquidity, then you are the liquidity. Stay safe all! Disclaimer This idea does not constitute as financial advice. It is for educational purposes only, our principal trader has over 25 years' experience in stocks, ETF's, and Forex. Hence each trade setup might have different hold times, entry or exit conditions, and will vary from the post/idea shared here. You can use the information from this post to make your own trading plan for the instrument discussed. Trading carries a risk; a high percentage of retail traders lose money. Please keep this in mind when entering any trade. Stay safe.
Mayfair_Ventures
تحلیل چند زمانی ساده: راز موفقیت تریدرها در هماهنگسازی نمودارها
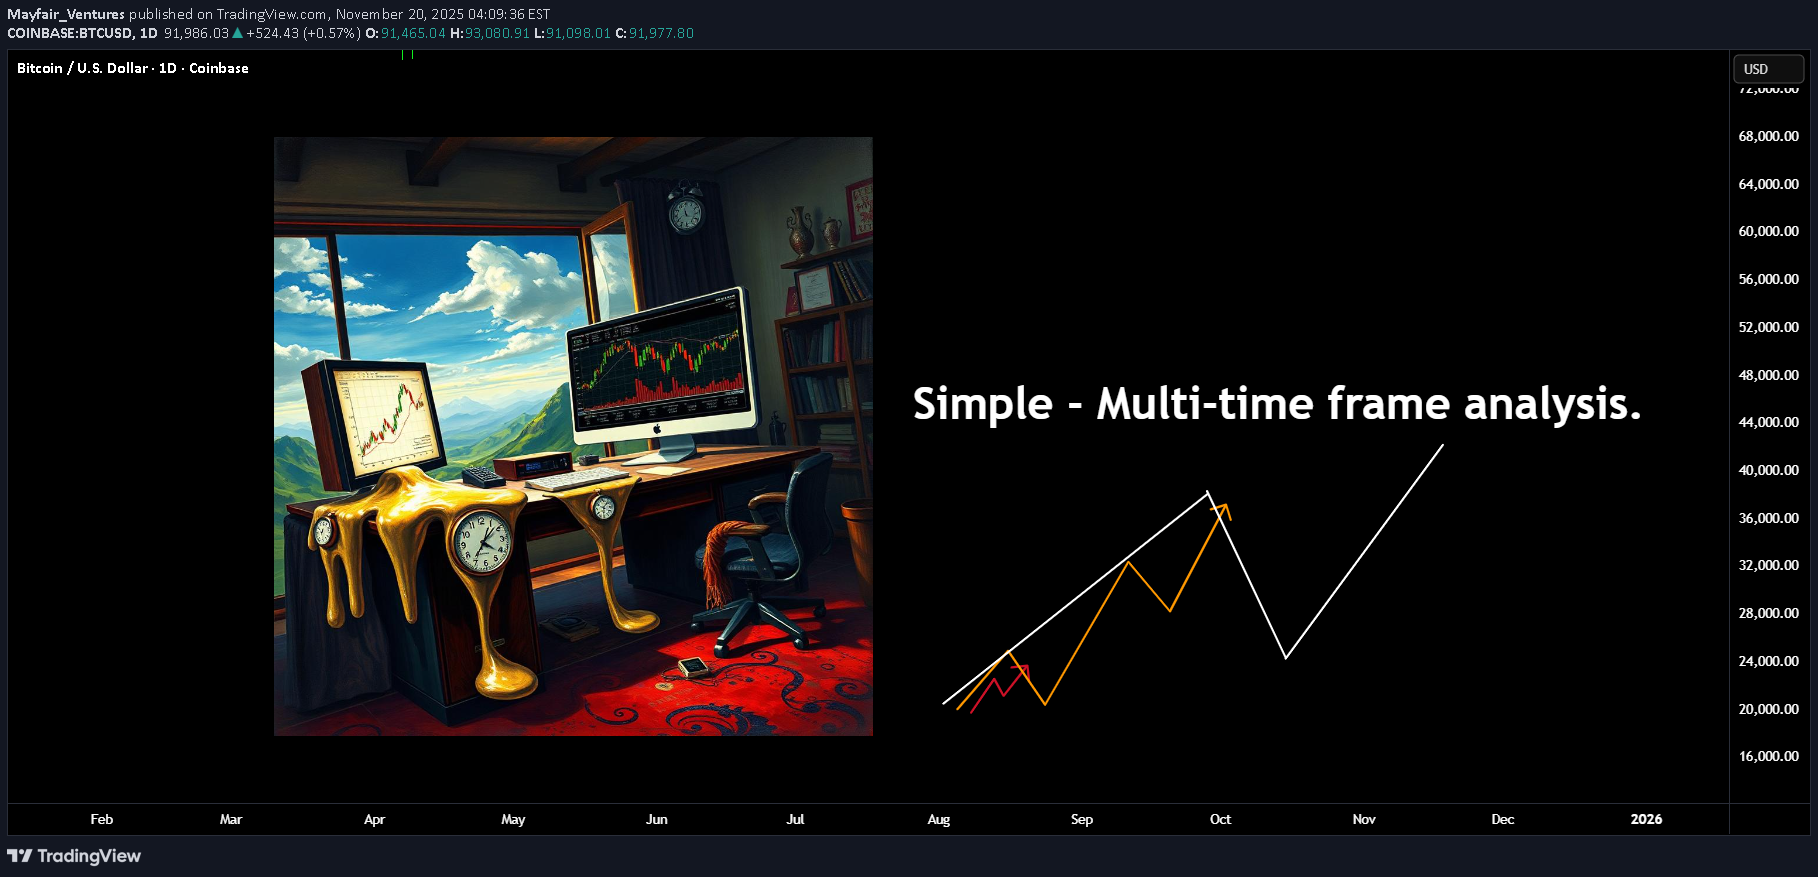
Here's another area many traders struggle with. The real value in using multiple timeframes is to know what to look for and when to look for it! As I have mentioned in a lot of my posts, all of this comes back to Dow theory; you don't need to make life hard on yourself. instead, simplify your approach and align a small number of timeframes and you will be surprised at the results. Let me give you an example; In this image above, you can see a clear push-up and a high, then a pullback. Why not use this high? It had a clear change of character to the downside. Well, the answer is - you would view these as separate timeframes. Although they are viewed on the exact same timeframe as my image. One you could call a primary trend and one a secondary. For a bit more depth, see this post. If you are already familiar with the idea, then the next thing you want to understand. What phase is the primary trend in? This becomes important as you drill down to the entry timeframes, as what you are trying to do is to understand a general bias. Once you grasp this, you can even trade the counter-trend moves (if you like). Ok, so with that being said. Let's add the second timeframe. As you can see, the orange line represents the primary trend, whilst the internal white path now represents the secondary trend. Why this is key, is because at this stage, the larger trend also could be doing one of two things. Going UP or DOWN. Up - Down - Once you understand the larger trend, the internal will work to facilitate the next leg of that higher degree. Of course, there will be reversals (but that's for another post). Working with an uptrend for the sake of an example; Price pushes up and then pulls back. If we know the ranges, I have covered this in several posts recently (mechanical). We can quickly identify the higher timeframe range. Once price breaks above this range, at some stage, you will expect to see a lower timeframe change of character, which is simply the start of a pullback on this higher timeframe. There are several ways to take advantage of this (again, another post). But working with this example. The first move above the range happened overnight or when you were not at your desk. You now have the information to work with the next phase. Assuming price is in a larger uptrend, you want to start to align these timeframes. This will be the case regardless of where in the move you are. These are only examples. This image above shows the trigger trend in alignment with the higher timeframe. This image below shows the opposite. Of course, there is more risk involved here as the bigger trend is going the other way, but as long as you acknowledge that, then opportunities will present themselves in both directions. Here's a few examples on where or how to use this. The second option is using the higher (secondary) not the trigger, but exactly the same concept. Finally, the third option is using all three of the timeframes. Firstly, you know the larger move is up. The second has started to align. Finally, the trigger trend (the minor) has it's change of character and you expect now the move to continue to the upside. This gives a higher risk-to-reward ratio and often it's a higher probability in terms of the outcome. For the simple reason, the two higher timeframes now agree. Some of the other posts connected to this one. Anyways! Take it easy. Disclaimer This idea does not constitute as financial advice. It is for educational purposes only, our principal trader has over 25 years' experience in stocks, ETF's, and Forex. Hence each trade setup might have different hold times, entry or exit conditions, and will vary from the post/idea shared here. You can use the information from this post to make your own trading plan for the instrument discussed. Trading carries a risk; a high percentage of retail traders lose money. Please keep this in mind when entering any trade. Stay safe.
Mayfair_Ventures
بزرگترین اشتباه معاملهگران مبتدی چیست؟ (راز سادگی در بازار)
After 25 years playing this game, it is incredible to see the same issues today for new traders as there have always been. In a nutshell, OVERCOMPLICATION!!! New traders will often go looking for as much information as possible, adding instruments, screens, indicators, timeframes, news feeds. Anything looking for an edge. Go back over 100 years and Charles Dow - yes, the same Dow behind the #DJI (The industrial average) laid down a very simple framework for understanding the markets. I have written several posts here on TradingView about Dow Theory here's one of them. Inside this post, you will see this image. For some of you familiar with either Elliott Wave principles or Wyckoff Techniques, you might recognise some elements of an image like this. Both Richard Wyckoff and Ralph Elliott were onto something. But over the years these techniques have been "added to" creating hybrids and then assumptions are often made. Complex is key... Or so they think. When you try and trade an Elliott wave cycle on a 5-minute chart on some instrument that has not been fully adopted by institutional players, you are asking for trouble. Psychology is more important in trading than, quite possibly 99.9% of other aspects of trading. So whilst people tend to add to the technical analysis part of trading, they often ignore the psychology controlling the market. I am not talking about psychology in terms of simple risk management and high probability moves. I am talking about the piece of the psychology studies that controls the masses. Sentiment is one thing, the psychology that drives sentiment is where the failing and struggling traders simply ignore. I wrote a post - trying to add some humour. Here's a Simpson's post. ========================================= Let me give you an example; People tend to use simple off the shelf indicators; now when millions use the same tools. Why is it that 90% + of traders still lose money? Here is a snapshot of the MACD and RSI side by side. Now look closely at the price action. What additional info are you getting from these lagging indicators (rhetorical question). . Let's look at this in a simple way; no indicators, clean chart, Dow Theory in focus. When price moves up you will often see accumulation, then as price reaches it's next area of interest and starts to pullback (oversimplified) you will see, even on smaller timeframes as this is not always obvious on the same timeframe. a distribution pattern. Overall, the price action has created a simple Elliott Wave move from a zero point, up to one and pushing down for a two. Where this gets interesting, and simple... Is the psychology behind it, The momentum up is often created by early buyers (yes, state the obvious) these buyers have been accumulating. Then, as retail jumps in because RSI says so. The price pulls back. This is often deep into the zone it just left, retail often using small timeframes and tight stops - 5 pips, 10 pips. So you often see a PB of 11 pips (example) and you get that feeling of "why does it always hit my stop and then go in my desired direction"? The momentum from taking these stops, then goes on to create an impulsive 2-3 move in EW terms. This is stops becoming opposing orders. Thus creating momentum to break the high of the 1 move. New stops from shorts get triggered and momentum traders enter positions. All of which fuels a larger rally. Now, when you break this down. You can draw ranges and operate inside these ranges to know the general bias. And just like that, you are on the right side of the market more often than not. Here's a more detailed post on this aspect. To give an example here: The larger swing creates a range. An obvious high and low as marked in this image. Then as the move inside happens; Think Dow Theory; The market is giving a very clear clue. We just took out a fresh high and the market is seeking liquidity. That internal move will have a fractal move inside; let's call that a trigger move. Keep in mind, the larger trend does not change it's directional bias until it breaks the old low or the fresh high. Now, although the price does not have to. The price can pull all the way back to the low and not change the larger trend. Once you get to grips with this, you will stop trying to predict the market and instead work with price action. Less, really, is more! Have a great weekend!!! Disclaimer This idea does not constitute as financial advice. It is for educational purposes only, our principal trader has over 25 years' experience in stocks, ETF's, and Forex. Hence each trade setup might have different hold times, entry or exit conditions, and will vary from the post/idea shared here. You can use the information from this post to make your own trading plan for the instrument discussed. Trading carries a risk; a high percentage of retail traders lose money. Please keep this in mind when entering any trade. Stay safe.
Mayfair_Ventures
Shocking Pattern Tricks That Make Trading Them Easy!
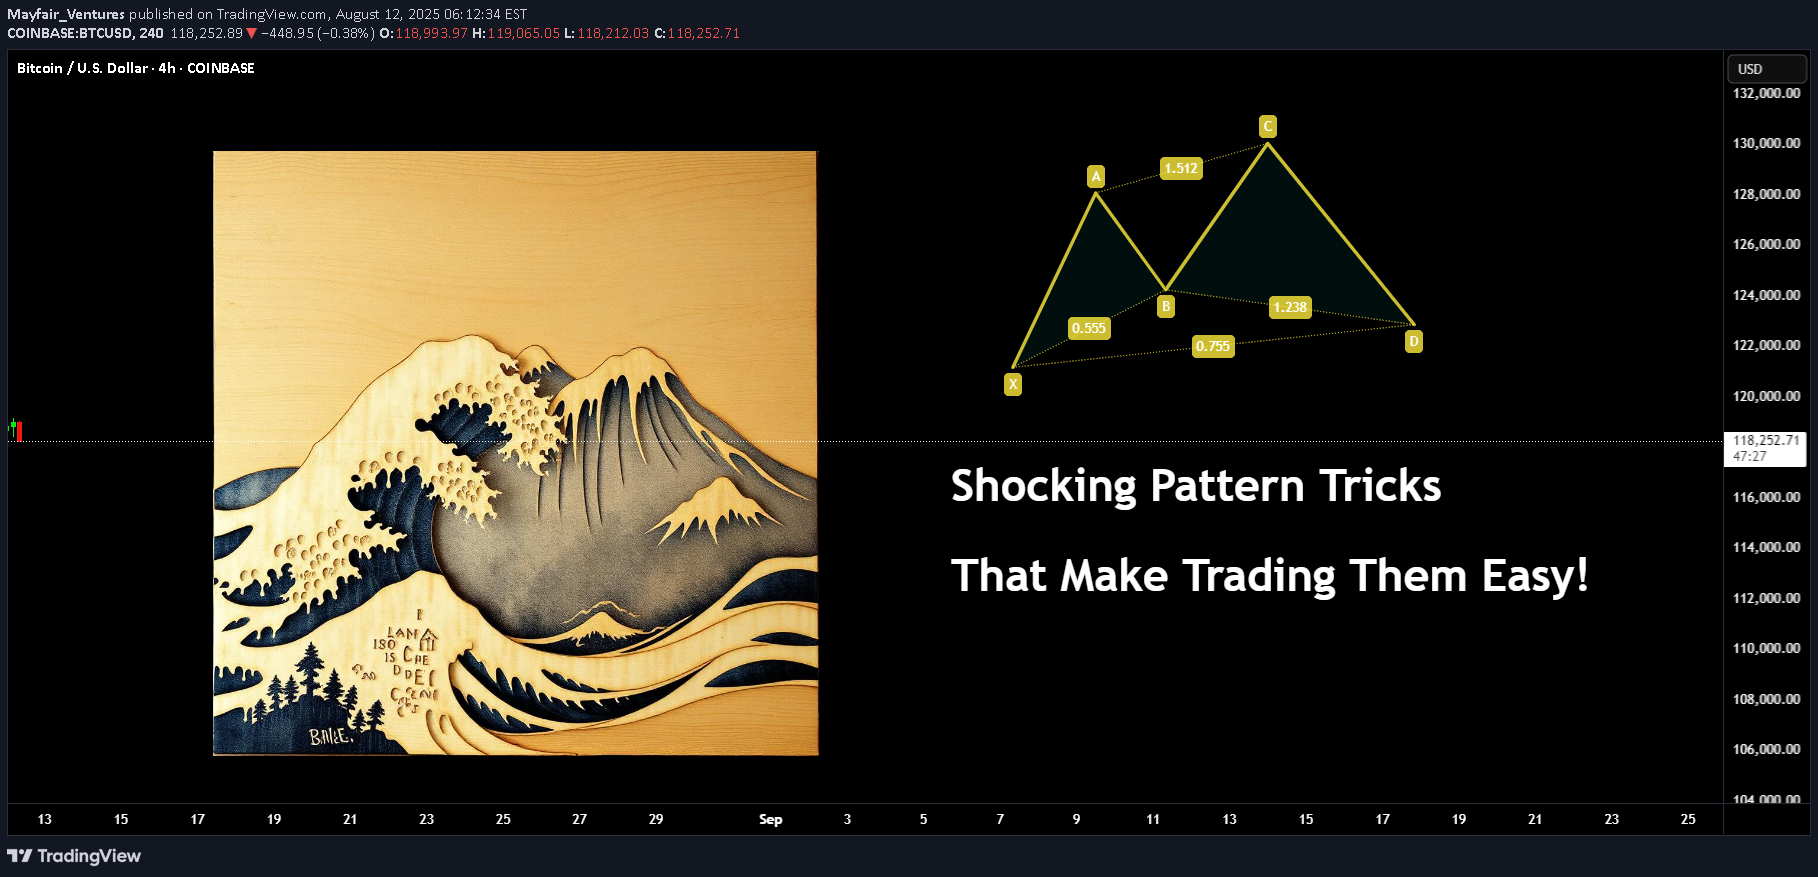
Here's another little viewpoint you might not have thought much about before. Trading patterns is more popular than you would believe. Some seem to think it's magic or some kind of secret. The issue is people tend to get fixated on the wrong things, such as the exact Fibonacci relationships and so on. Let me show you something to simplify the concept, regardless of the pattern. Example : You might have seen a Crab pattern? What you would then expect after spotting one on the chart is a move like this. But, have you ever stopped to think what the price action is actually saying? It has ZERO to do with Fib relations. Think of what the trend is doing I have covered the basics of Dow theory in several posts here. An example of such a post is here (you need to click the image to see the full post). Ok, Now you can see it's only part of a higher degree wave count. Let's add an example of liquidity and a range. Are you starting to see it already? Here's a post on the ranges... Change the pattern from a Crab to a Bat. Now look at it and logically what is the chart behind the pattern saying? Both bullish and bearish versions. What about the good, old head and shoulders technique? If you are unsure about the pattern, it's market something like this (examples only) don't comment something like "the levels are wrong" all of these were freehand to show the concept without accuracy. Looking at the H&S pattern - you can actually see the logic simplified. Again, if you don't know about internal and external liquidity, here's another post on the topic. What happens next is the internal structure changes, which then eventually leads to the higher TF change of structure. And if you were to follow either Fib levels or Elliott Wave counts you will notice the regular move internally looks similar. (marked in red). This post is just to show you an example and how obvious these can be. Once you learn the basics, you won't need the complex version to follow price and use this to your advantage. Have a great week! Disclaimer This idea does not constitute as financial advice. It is for educational purposes only, our principal trader has over 25 years' experience in stocks, ETF's, and Forex. Hence each trade setup might have different hold times, entry or exit conditions, and will vary from the post/idea shared here. You can use the information from this post to make your own trading plan for the instrument discussed. Trading carries a risk; a high percentage of retail traders lose money. Please keep this in mind when entering any trade. Stay safe.
Mayfair_Ventures
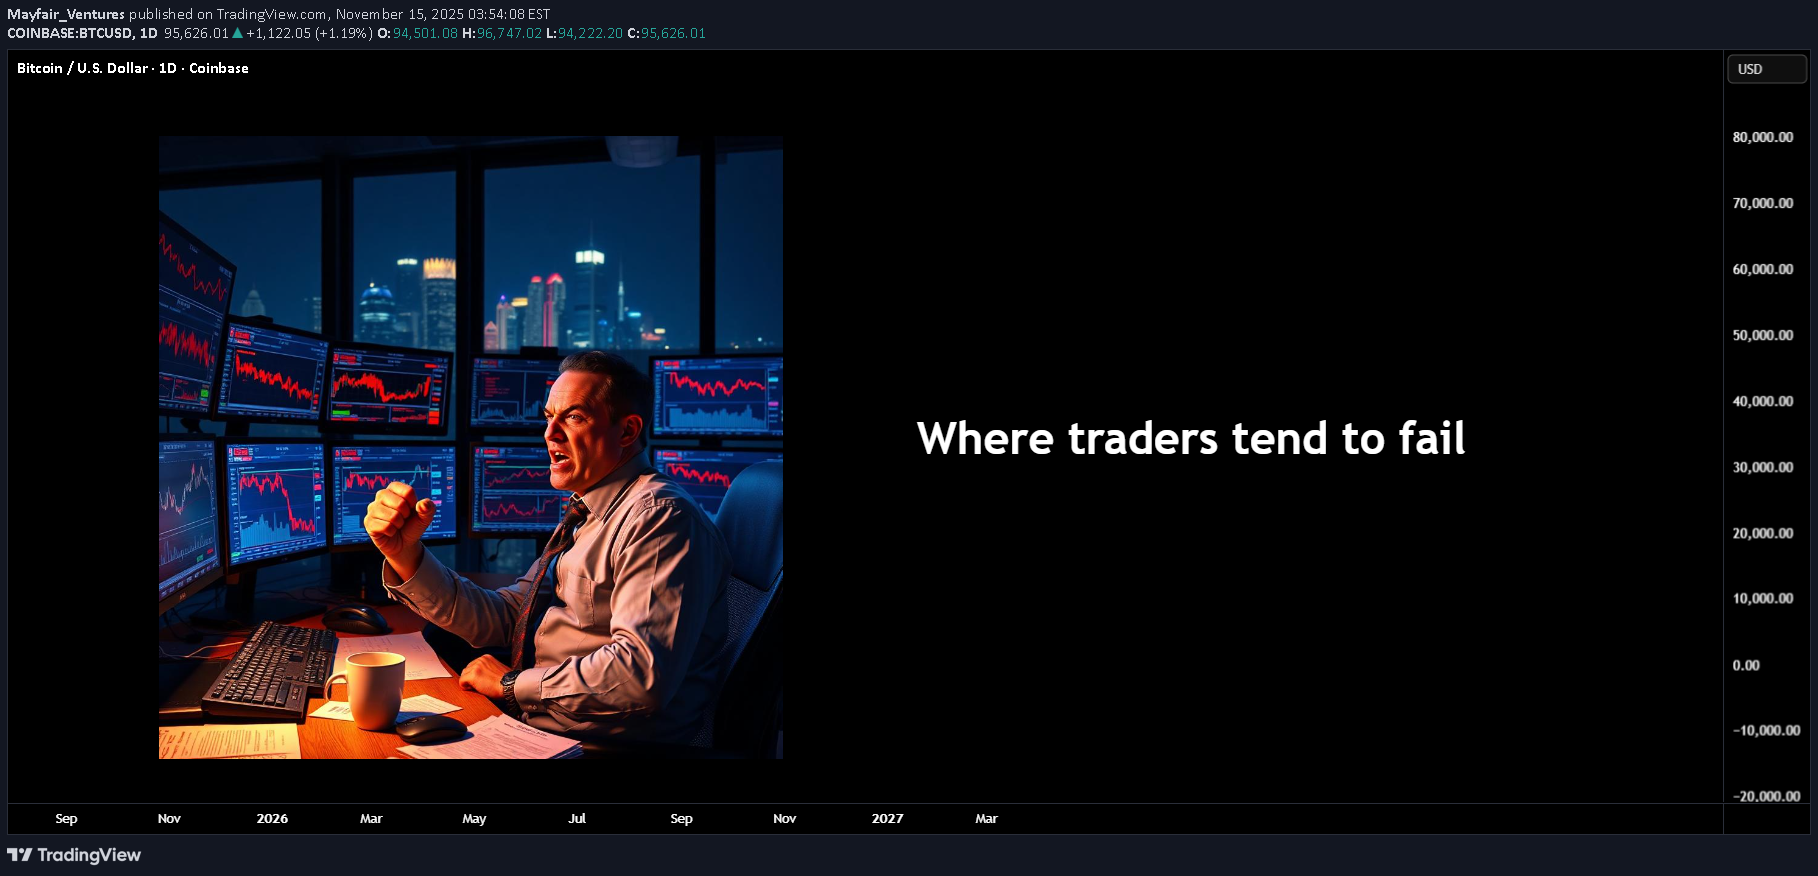
Why the 95% fail
It's no secret that over 90% of retail traders lose money. I am not talking about throwing some money into crypto and hoping for the moon type wins or losses. I mean actually trading and making a living from it. You see, when you start, you are hungry for information - what's the best course, who has the best strategy, what if I trade 25 instruments on a 1-minute timeframe. Surely more profits... After doing this for over 25 years, you get to see people come and go, sometimes they come back with a new idea and more funds to give the market. But overall, some of the core problems are - all the gear and no idea. Not only do people invest in screens, the latest hardware and of course the legendary Bloomberg subscription for 24/7 news. What about indicators? Has your screen ever looked a little bit like this? The issue with more indicators is the majority of them lag to price action, re-paint or are simply not needed. Then combine that with the lack of experience, and you are left questioning do I buy or sell if my RSI is up but the moving average just crossed down? You are not alone, most traders have been there if not all! It is hard enough when even the brokers and exchanges fight against you - have you ever seen a scam wick directly to your stop and bounce? What about the A-book vs the B-book? In an A-book model, the broker passes their clients' trades directly to the market. Essentially, the broker acts as a middleman, executing trades on behalf of clients in the open market. This means that the broker's profits come primarily from commissions and spreads rather than trading against the client. B-book, the broker takes the opposite side of the client's trades, essentially acting as the counterparty. Instead of sending trades to the open market, the broker keeps them internally. The next one that always tickles me is the 100% win rate strategy that someone automated and for a few hundred dollars, it's all yours!! Look, if there was a silver bullet, a 100% winning strategy you could buy off the shelf - we wouldn't have any other profession on the planet! The world's population would be professional traders. You know the saying " if it sounds too good to be true, it probably is". You see Elliott waves where they have no right to be. Simply no logic or using them on a tick chart and hoping for miracles. How about getting some financial advice from a spotty teen who rented a sports car for a video shoot this afternoon? Yeah, sounds like a good plan to help you retire young! ============================== So, how to avoid all of these things? Well, to start with, your tradingview chart, on a regular laptop or desktop with one screen, removing all the indicators and increasing the timeframe. Then you reduce the number of pairs you look at and get to know them. Treat them like a new language. Learn the character traits, how they behave around major news events, what happens to them if the dollar goes up or oil drops 5%. Don't treat trading like a game. Instead, treat it like a business, use hours that suit your lifestyle. Deploy proper risk management. Don't see it as a one trade one win type concept. Treat it with respect and profit from it weekly. You will find, when you learn to manage risk correctly, you care very little about markets going up or down. You tend to sleep with ease and a growing bank balance. The market has plenty of soldiers fighting on its side, and it does its best to recruit you to fight against yourself! In summary, less screens, less data inputs (indicators), less instruments, higher timeframes, ignore the influencers, Proper risk management and learn to understand there is no silver bullet. Trading is statistics and that's all it is. You can be very profitable with a low strike rate and a large risk-to-reward ratio. Or as simple as a 2% gain per 1% loss and a 50/50 win rate still makes you money! Disclaimer This idea does not constitute as financial advice. It is for educational purposes only, our principal trader has over 25 years' experience in stocks, ETF's, and Forex. Hence each trade setup might have different hold times, entry or exit conditions, and will vary from the post/idea shared here. You can use the information from this post to make your own trading plan for the instrument discussed. Trading carries a risk; a high percentage of retail traders lose money. Please keep this in mind when entering any trade. Stay safe.
Mayfair_Ventures
Internal and external liquidity
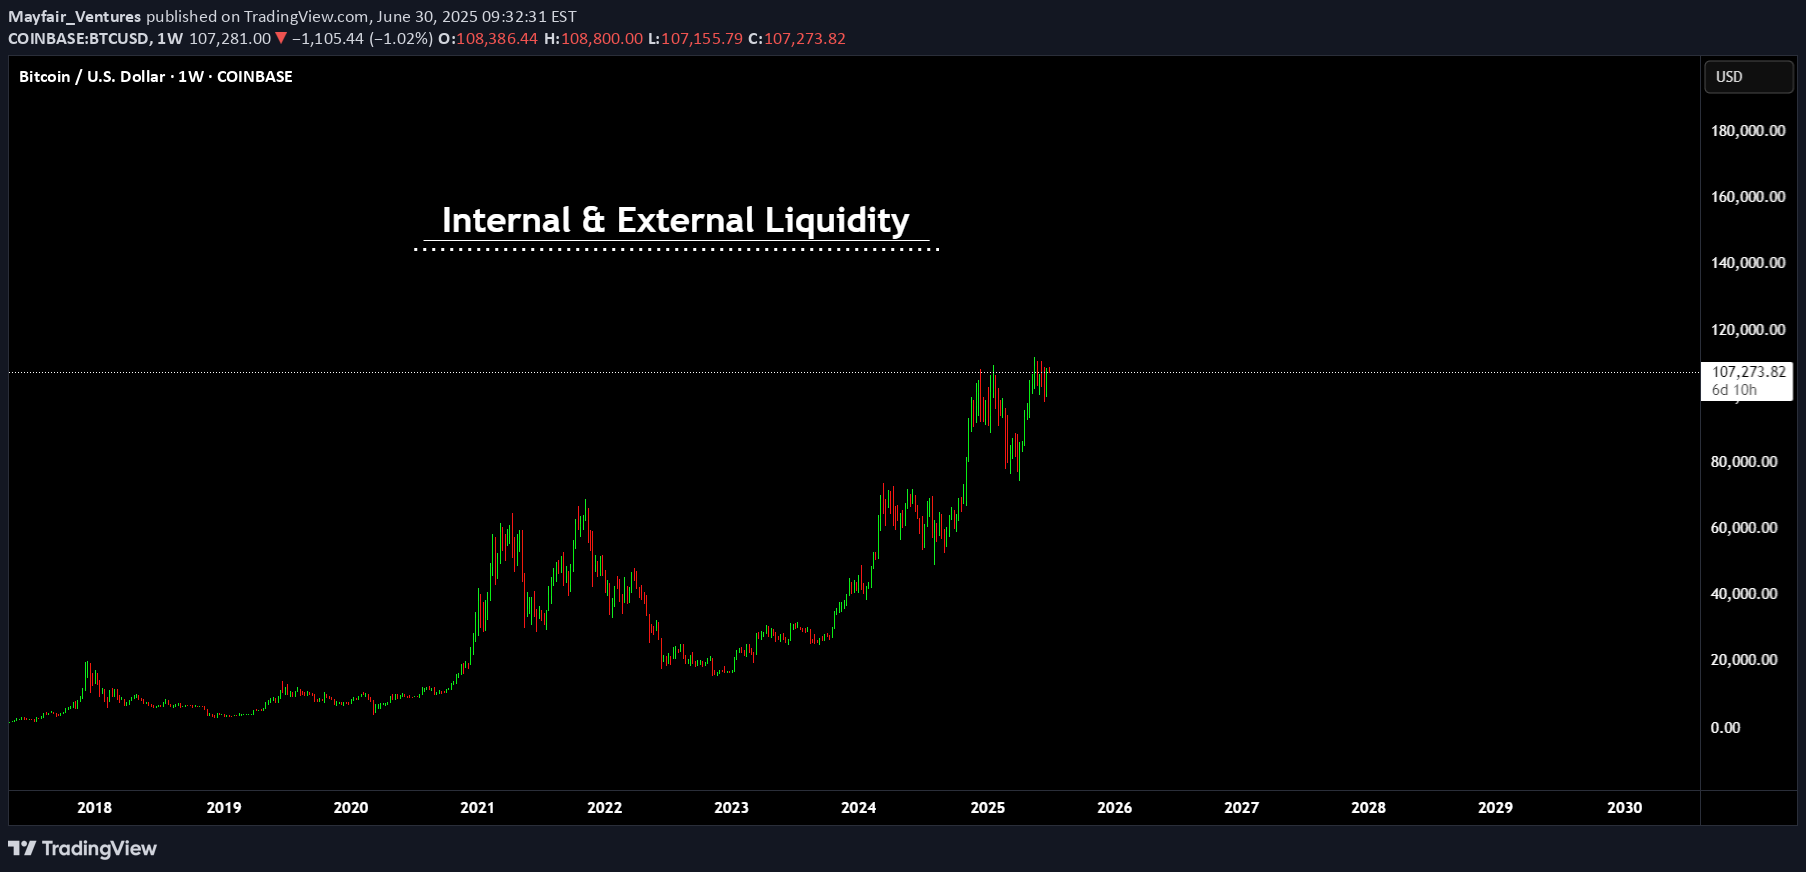
Here's another mechanical lesson for you. In my last post I covered a mechanical technique to identify swing ranges. Rule-based, simple and repeatable. In this post, I want to share another little technique, again part of the mechanical series. But this time I want to talk about liquidity. Most traders talk about liquidity, they might even have a grasp of what it is. But most do not know how liquidity forms the sentiment and how that creates a type of algo for the market. You might have heard of Elliott wave theory. There is a saying along the lines of "you ask 10 Elliott traders for their count and you get 11 answers". But the point is here, when you simplify the concept, it's clear to see that sentiment caused by liquidity swings is what causes a repeatable pattern in the market. Let's take the idea of the ranges from my last post. Now after a fair amount of accumulation, this level becomes "defended" - the price will gradually move up until old short stop losses are tagged and new long entries are entered into. This allows the institutional players to open up their orders without setting off the alarm bells. Price then comes back from external liquidity to find internal liquidity (more on this in a later post). But then it looks for the next fresh highs. As the highs are put in, we can use the range technique to move our range to the new area as seen in the image above. Next we will be looking for an internal move, not just internal to the range, but a fractal move on the smaller timeframe that drives the pullback down. See this in blue. The logic here is simple; on the smaller timeframes we have witnessed an accumulation at the 2 region and as we spike up for 3; we will witness a distribution on the smaller timeframes. Wyckoff called this the accumulation, followed by a mark-up and then the distribution and a mark-down. It is this pattern, over and over again that leads to this type of structure. This will then be re-branded by various analysts who will call it things like a head and shoulders, smart money will see a change of character and a retest before breaking the structure. This is all the same thing - just a different naming convention. Again, I hope this helps some of you out there! Disclaimer This idea does not constitute as financial advice. It is for educational purposes only, our principal trader has over 25 years' experience in stocks, ETF's, and Forex. Hence each trade setup might have different hold times, entry or exit conditions, and will vary from the post/idea shared here. You can use the information from this post to make your own trading plan for the instrument discussed. Trading carries a risk; a high percentage of retail traders lose money. Please keep this in mind when entering any trade. Stay safe.
Mayfair_Ventures
Bitcoin Smart money part 1
Here is a little post on why the SMC ideas are part of the bigger picture - I wasn't sure if these new video ideas are capped to 15minutes. Sure I read that somewhere. I'll do another video in the next few days either way. For now I think we are still busy going NOT FAR. Link to other post; Disclaimer This idea does not constitute as financial advice. It is for educational purposes only, our principle trader has over 20 years' experience in stocks, ETF's, and Forex. Hence each trade setup might have different hold times, entry or exit conditions, and will vary from the post/idea shared here. You can use the information from this post to make your own trading plan for the instrument discussed. Trading carries a risk; a high percentage of retail traders lose money. Please keep this in mind when entering any trade. Stay safe.
Mayfair_Ventures
The Parallels of Trading and Golf

As both a Professional trader, but amateur golfer. recently tried to explain to someone the similarities, especially in the emotional side of golf and trading. I thought it might make an interesting article. Golf, much like trading, is a sophisticated blend of skill, strategy, and psychology. While trading involves navigating financial markets, golf requires skilful manoeuvring across challenging terrains. Both activities demand a strategic mindset, the ability to adapt, and the resilience to handle emotional highs and lows. The Right Club for the shot In golf, a player selects from a variety of clubs, each designed for a specific type of shot and distance. In trading, an investor uses different strategies tailored to particular instruments and timeframes. Just as a golfer wouldn’t use a driver for a close-range putt, a trader shouldn’t apply a long-term investment strategy on a 1-minute timeframe. The key is understanding which tools to utilise for the setup, whether it’s choosing a wedge to escape a bunker or a driver to blast the ball down the fairway. Different Scenarios Golf courses are full of diverse challenges, from long par 5s to intricate par 3s as well as those horrible 4s too long to drive, yet technical. A golfer must adapt their approach to the difficulty of each hole, just as a trader must respond to different market conditions. A poor shot on a par 5 might still recover with subsequent careful play, similar to how traders can bounce back from a loss with well-planned actions in subsequent trades. Success in both fields relies on adapting to circumstances while focusing on the overall objective. Remember there are 18 pins on a golf course, one bad shot doesn’t cripple the account (I mean, doesn’t end the game). Managing Emotions Golf is notorious for inducing a wide range of emotions, from the frustration of a missed putt to the euphoria of a perfect drive. Trading elicits similar emotional responses; the thrill of a profitable trade contrasts sharply with the despair of a loss. You ever notice that you take profits early and let losses run too long? Yup; not wanting the ball in the woods is the same, yet we still reach for the driver. Both golfers and traders must manage their emotions effectively to maintain focus and make rational decisions. Emotional discipline is vital; letting emotions dictate actions often leads to mistakes, whether it's over-swinging in frustration or impulsively buying or selling a stock. Risk management in either scenario. Learning and Improving Professional golfers continuously work to refine their swings and improve their game. Similarly, traders must commit to ongoing education and self-improvement. Doctors or lawyers don’t become professionals after watching one or two videos online. Neither does a trader. Analysing past performances, whether it’s reviewing a golf game or assessing trading results, is crucial for identifying areas of improvement and fine-tuning strategies moving forward. But only you can do this “honestly” claiming a birdie when it should be marked as a bogey is only cheating yourself. To Master the Art The pursuit of mastery in both golf and trading is a lifetime journey. Neither field offers shortcuts to success; both require dedication, practice, and resilience. However, the sense of accomplishment and reward from mastering a challenging golf course or successfully navigating complex markets can be immensely satisfying and still that one bad shot is soul-destroying. Disclaimer This idea does not constitute as financial advice. It is for educational purposes only, our principle trader has over 20 years' experience in stocks, ETF's, and Forex. Hence each trade setup might have different hold times, entry or exit conditions, and will vary from the post/idea shared here. You can use the information from this post to make your own trading plan for the instrument discussed. Trading carries a risk; a high percentage of retail traders lose money. Please keep this in mind when entering any trade. Stay safe.
Mayfair_Ventures
The Bitcoin Lotto

Remember when the excitement of the lottery was all about the potential of life-changing wins from just a small ticket price? Fast forward to today, and Bitcoin has emerged as the new frontier of that thrilling potential. Once priced at a humble $1,000, Bitcoin was accessible and brimming with promise. Today, with its value as high as $60,000, the landscape has undeniably transformed, offering new opportunities and considerations for investors worldwide. Bitcoin isn't just a digital currency; it's a revolution that's reshaping financial markets, much like the anticipation of hitting the jackpot. However, unlike the traditional lottery, Bitcoin investment isn't purely about luck—it's about smart, informed decision-making, historical insight, and future potential. Imagine being part of a technological evolution that's not just a game of chance but also a calculated step toward financial empowerment. When navigating these markets, you want to stay clear of the echo chambers. We have had tails of "98k next month and $135,000 In December" back in 2021. The main issue with the sentiment at the current levels, are it seems everyone and their dog bought Bitcoin under $20,000 at the exact bottom. They were also calling longs at 69k. It's an inflation beater, it's just had 12 ETF's approved, there's a price multiplier, sell your house and buy Bitcoin. It looks like Trump might win back the White House and of course, he has endorsed Bitcoin. The question shouldn't really be "where does this go" instead it should be "why isn't it there yet". I've joked a couple of times - If you bought a house at 69,000 in 2021 and now in 2024 it's worth 59,000 should you sell it or hold it, I have had replies like "You should have bought Bitcoin"... This is not a bash against Crypto; it's knowing the value and understanding the perception vs reality dilemma. The controlled aspect of the move up from 15k to 73 and that high being just enough of a liquidity grab much like 65k to 69k. Years apart, means there is a lot of control in an asset many claim "Cannot be controlled". The sentiment was all about Freedom and liberty; no institutional control, no government control - Go Trump, Go Blackrock. My questions remain, If you were lucky in at sub 10k prices - you have had a good trade (providing you profited obviously) Paper gains are not wins. But where does the additional funding come from for a double of it's current price? Why are we not at 100k+ already after a Trump endorsement, a halving, a price multiplier, 12 ETF's approved? The world of Social media has made it easier for keyboard warriors to catch every bottom, sell every top (yet never sell anything) and claim paper gains to the moon. Investing doesn't need to be the same as a lotto ticket. It just needs a good understanding of why liquidity moves the way it does and who's side the profits usually come back to. Anyway - food for thought this weekend! Have a good one. Stay safe
Disclaimer
Any content and materials included in Sahmeto's website and official communication channels are a compilation of personal opinions and analyses and are not binding. They do not constitute any recommendation for buying, selling, entering or exiting the stock market and cryptocurrency market. Also, all news and analyses included in the website and channels are merely republished information from official and unofficial domestic and foreign sources, and it is obvious that users of the said content are responsible for following up and ensuring the authenticity and accuracy of the materials. Therefore, while disclaiming responsibility, it is declared that the responsibility for any decision-making, action, and potential profit and loss in the capital market and cryptocurrency market lies with the trader.