
MarketIntel
@t_MarketIntel

What symbols does the trader recommend buying?
Purchase History
پیام های تریدر
Filter
MarketIntel
XRP: Likely to Move Lower
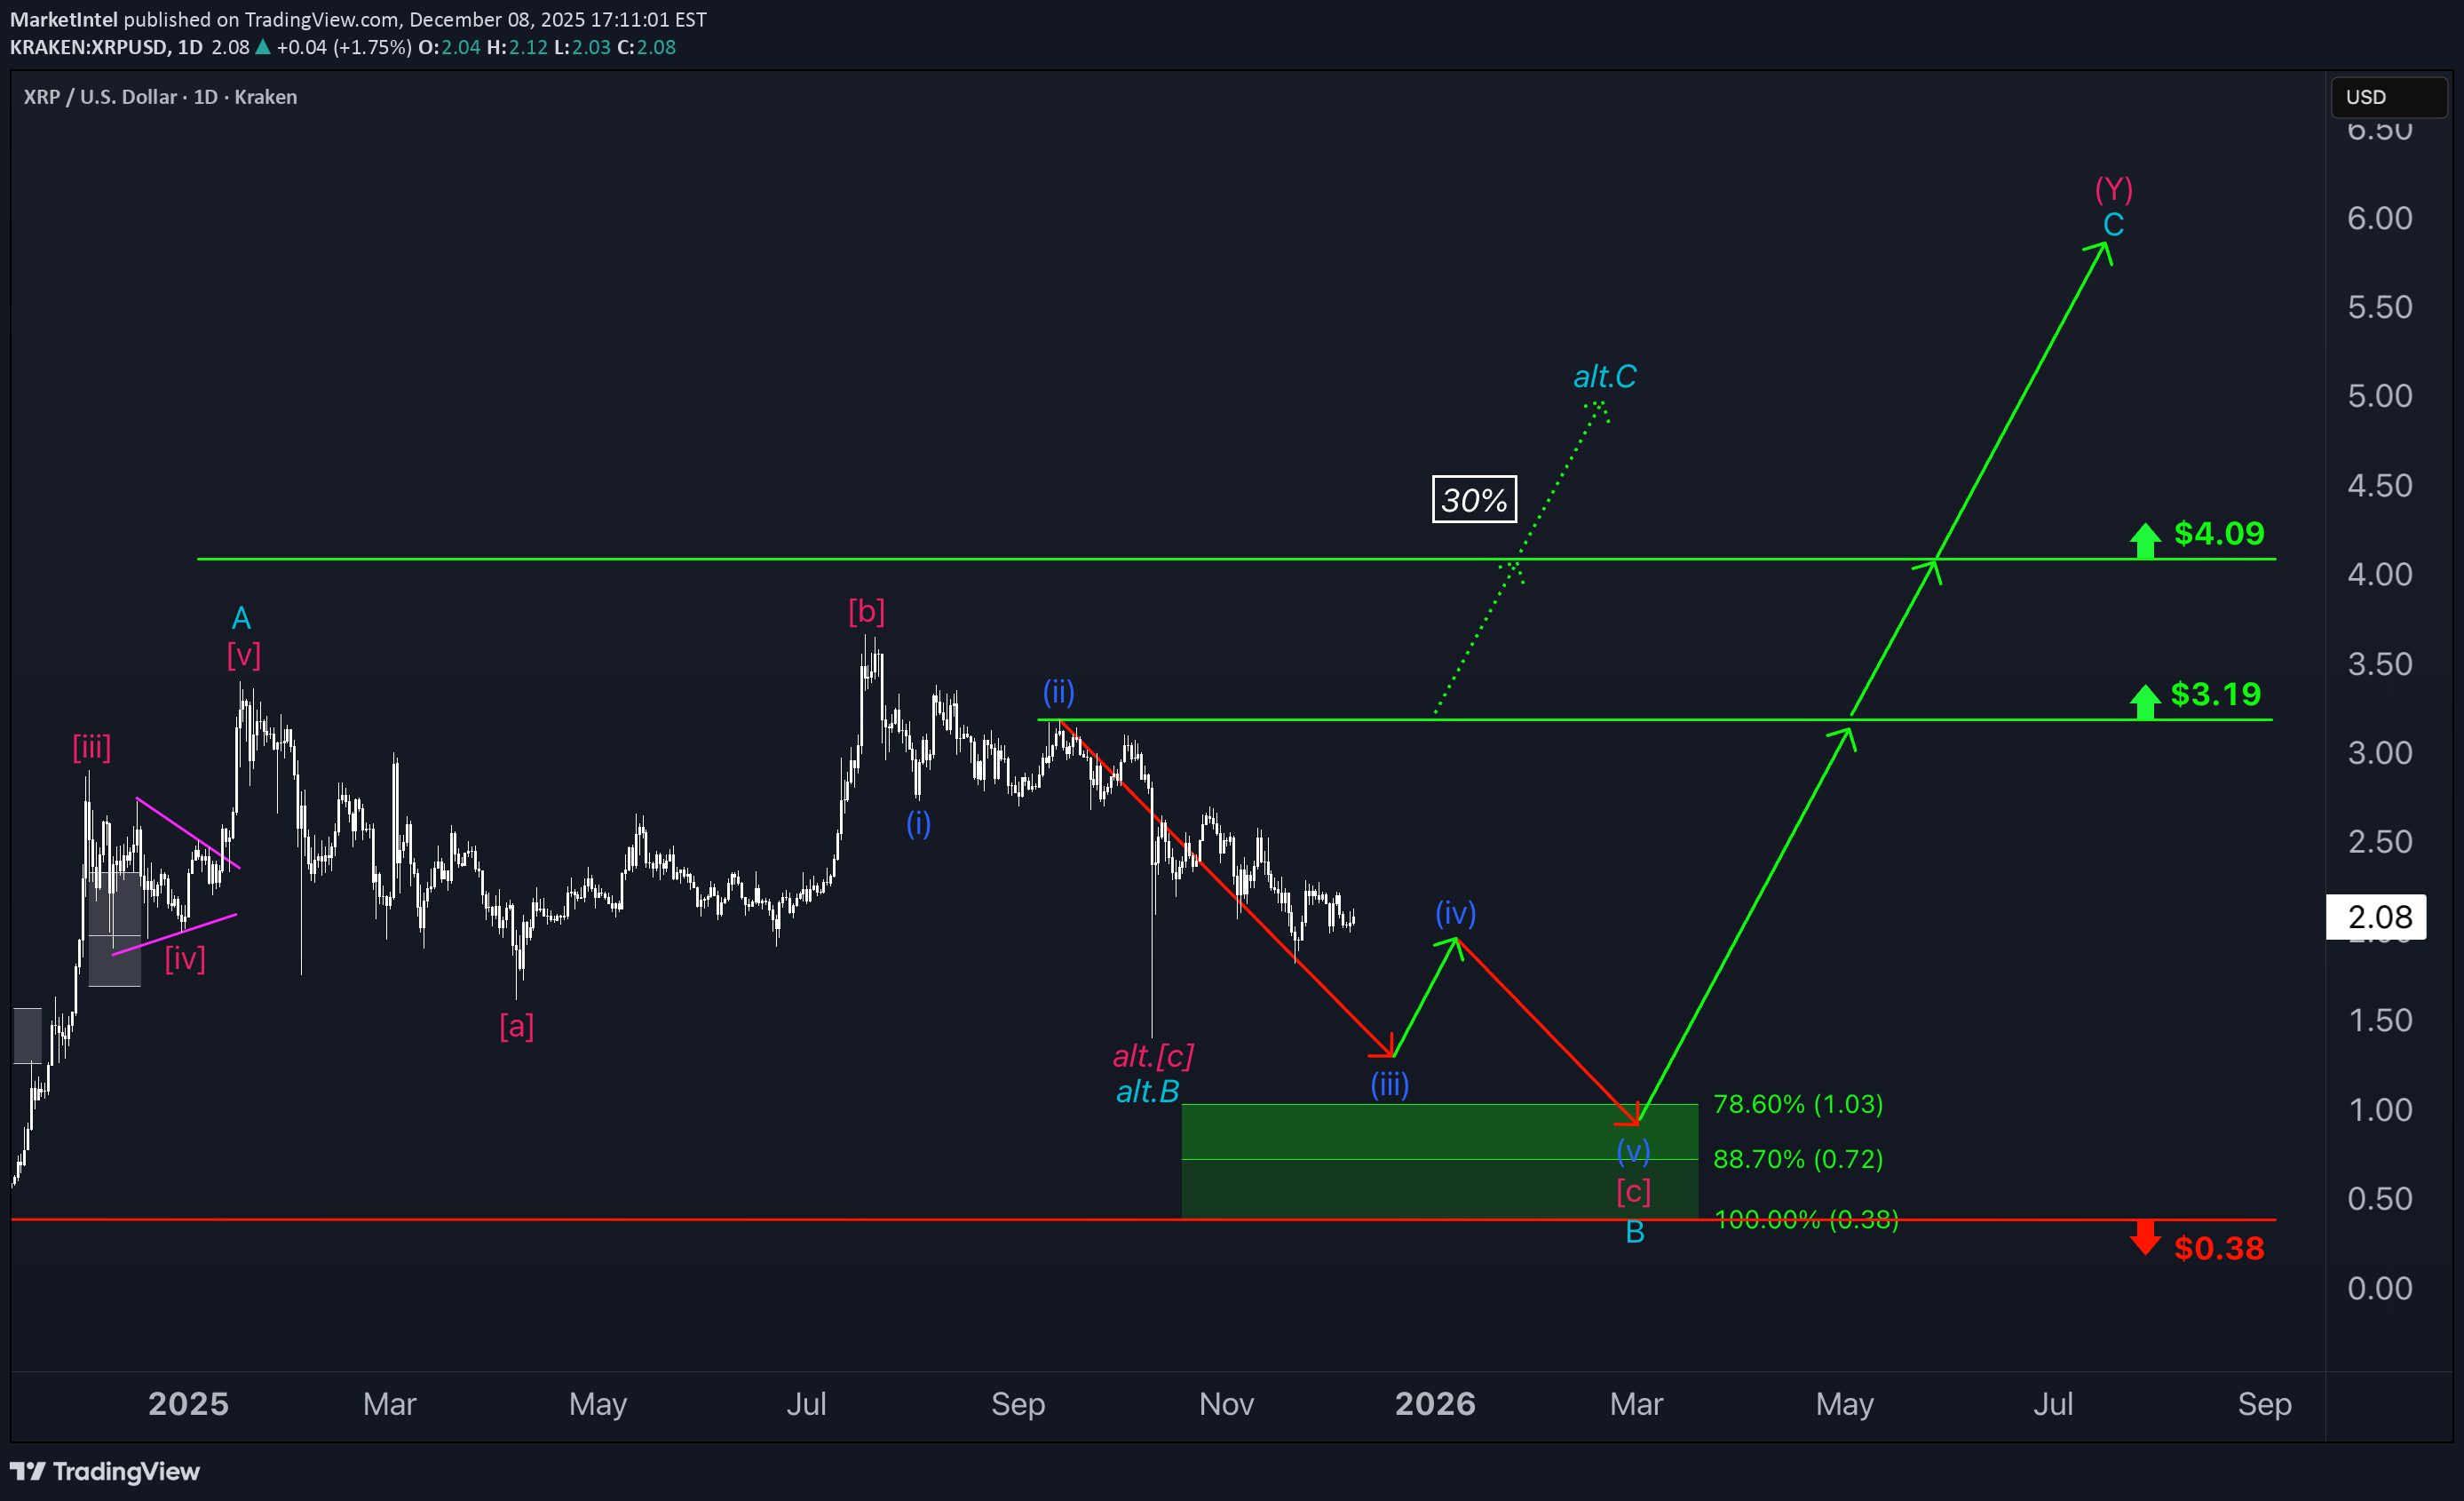
Ripple’s XRP is expected to retrace further into the green Target Zone ranging from $1.03 to $0.38 as part of a blue downward impulse, which would complete the higher-level turquoise wave B. Afterward, wave C should drive price sharply higher, ultimately setting a new high for the larger wave (Y) above the resistance at $4.09. However, if bulls manage to push the altcoin above the $3.19 resistance and the $4.09 level in the near term—a scenario we estimate has a 30% probability—it would suggest that the turquoise alt.B wave has already been completed, and our Target Zone would no longer be reached.
MarketIntel
سولانا در کف قیمت است یا منتظر سقوط بیشتر؟ پیشبینی دقیق آینده قیمت SOL

SOL has already climbed more than 15% from last Friday’s low at its peak, potentially signaling the completion of wave ii in orange. For now, however, we’re still keeping open the possibility that this move could dip to a new low—within our green Target Zone ($155.80–$113.20). In any case, once this interim correction wraps up, wave iii in orange should kick off an impulsive rally, only losing steam above resistance at $295.31.
MarketIntel
کف سولانا کجاست؟ آیا صعود آغاز میشود یا منتظر سقوط بیشتر باشیم؟
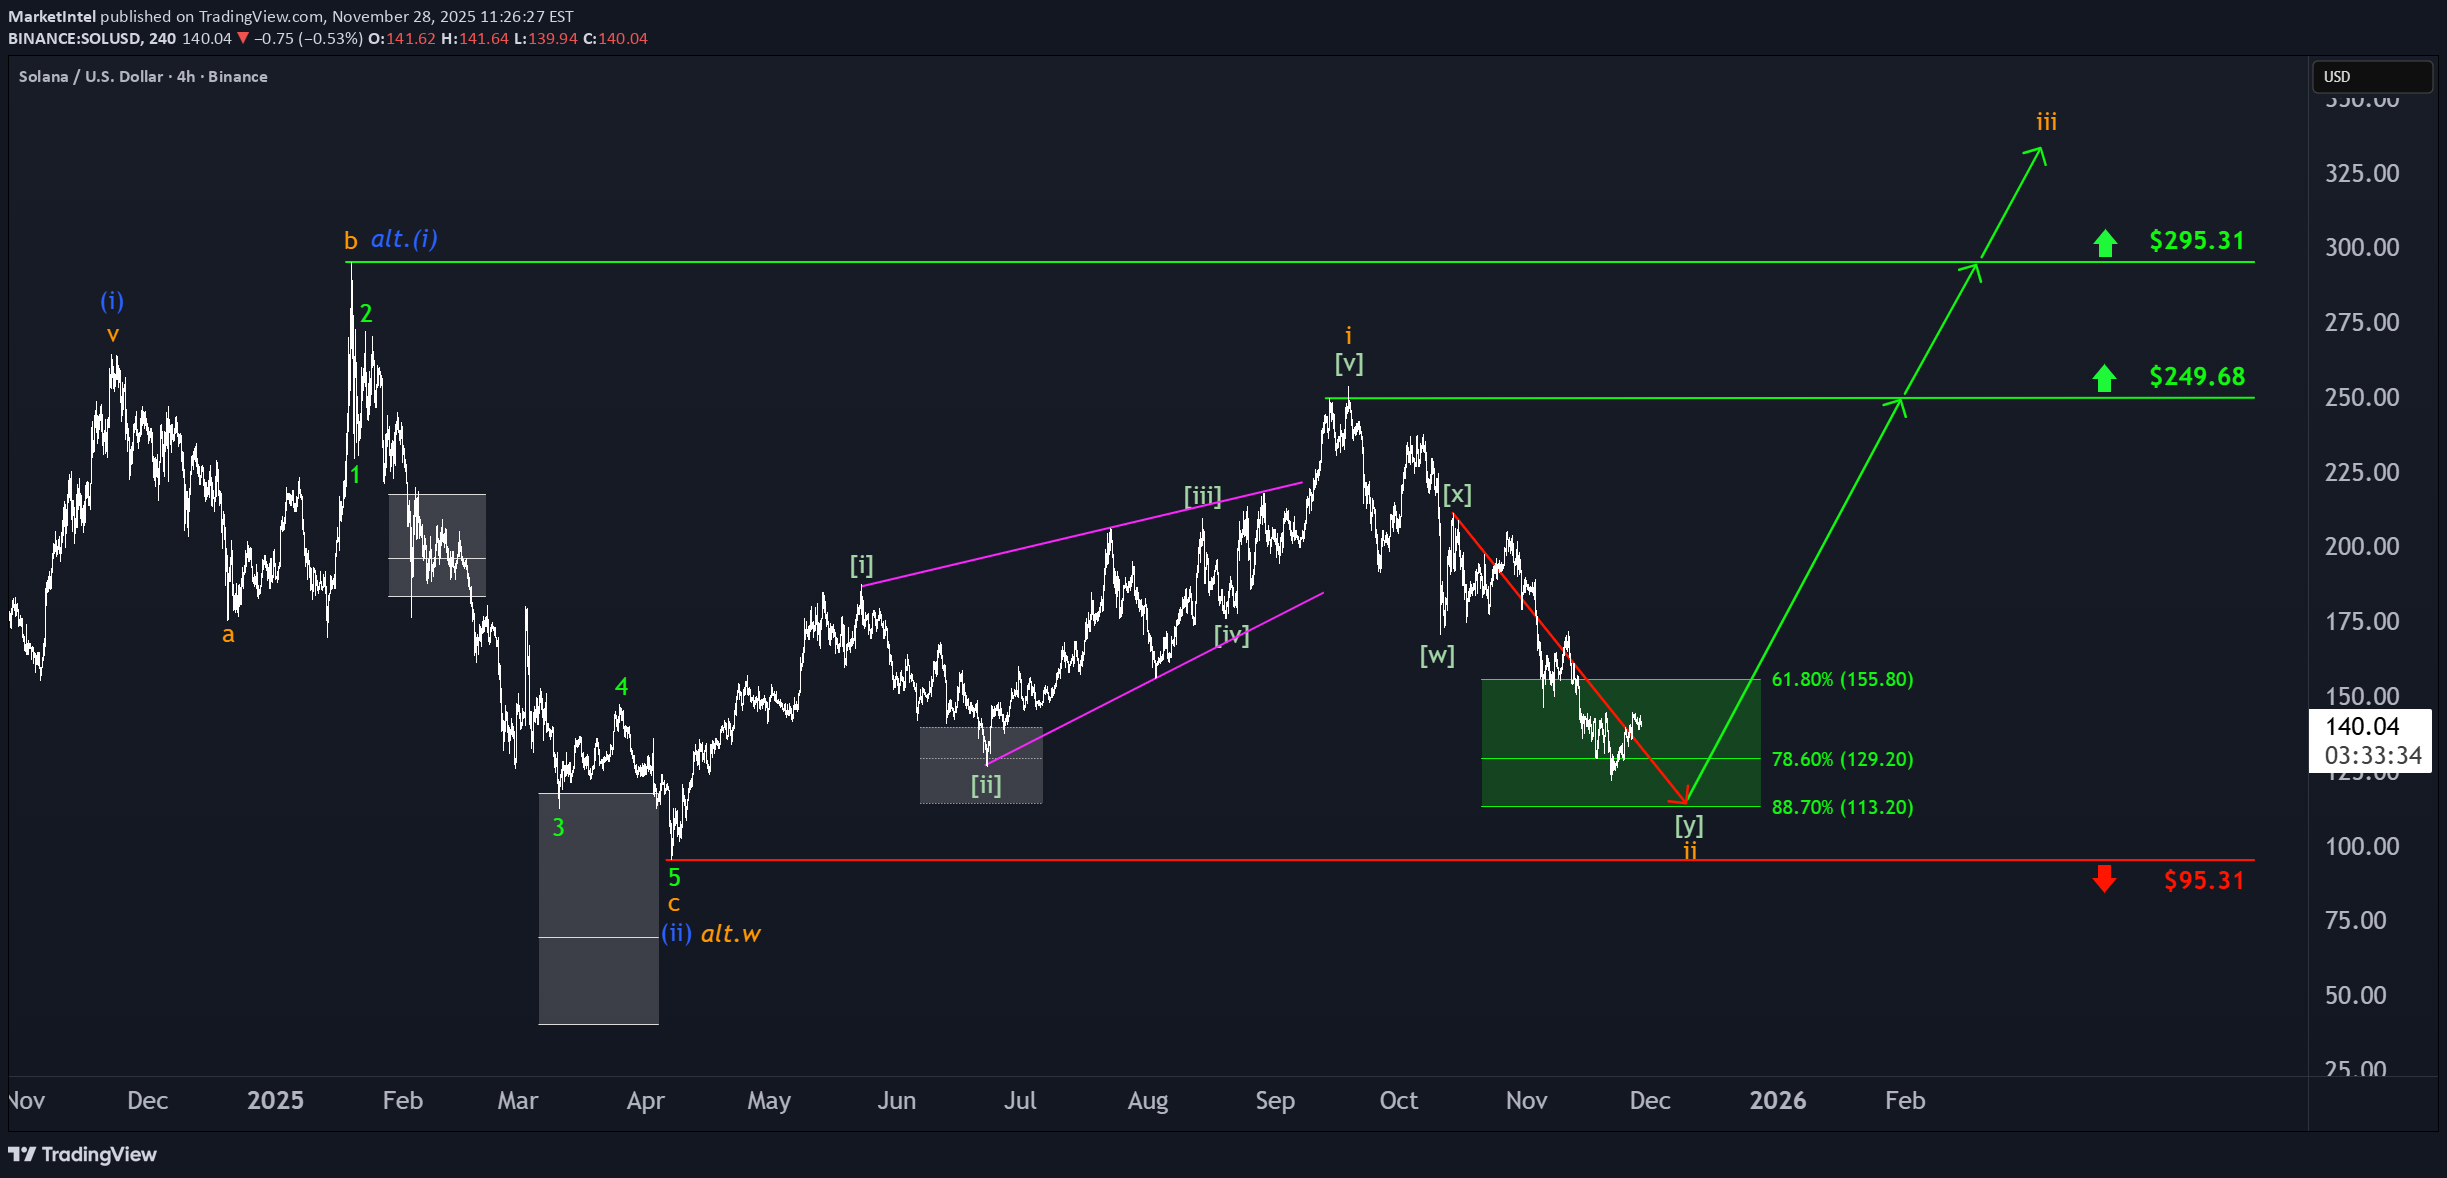
SOL has already climbed more than 15% from last Friday’s low at its peak, potentially signaling the completion of wave ii in orange. For now, however, we’re still keeping open the possibility that this move could dip to a new low—within our green Target Zone ($155.80–$113.20). In any case, once this interim correction wraps up, wave iii in orange should kick off an impulsive rally, only losing steam above resistance at $295.31.
MarketIntel
حرکت معکوس بیت کوین: آیا سقوط بزرگ در راه است؟ (محدوده هدف $62,395 تا $51,323)
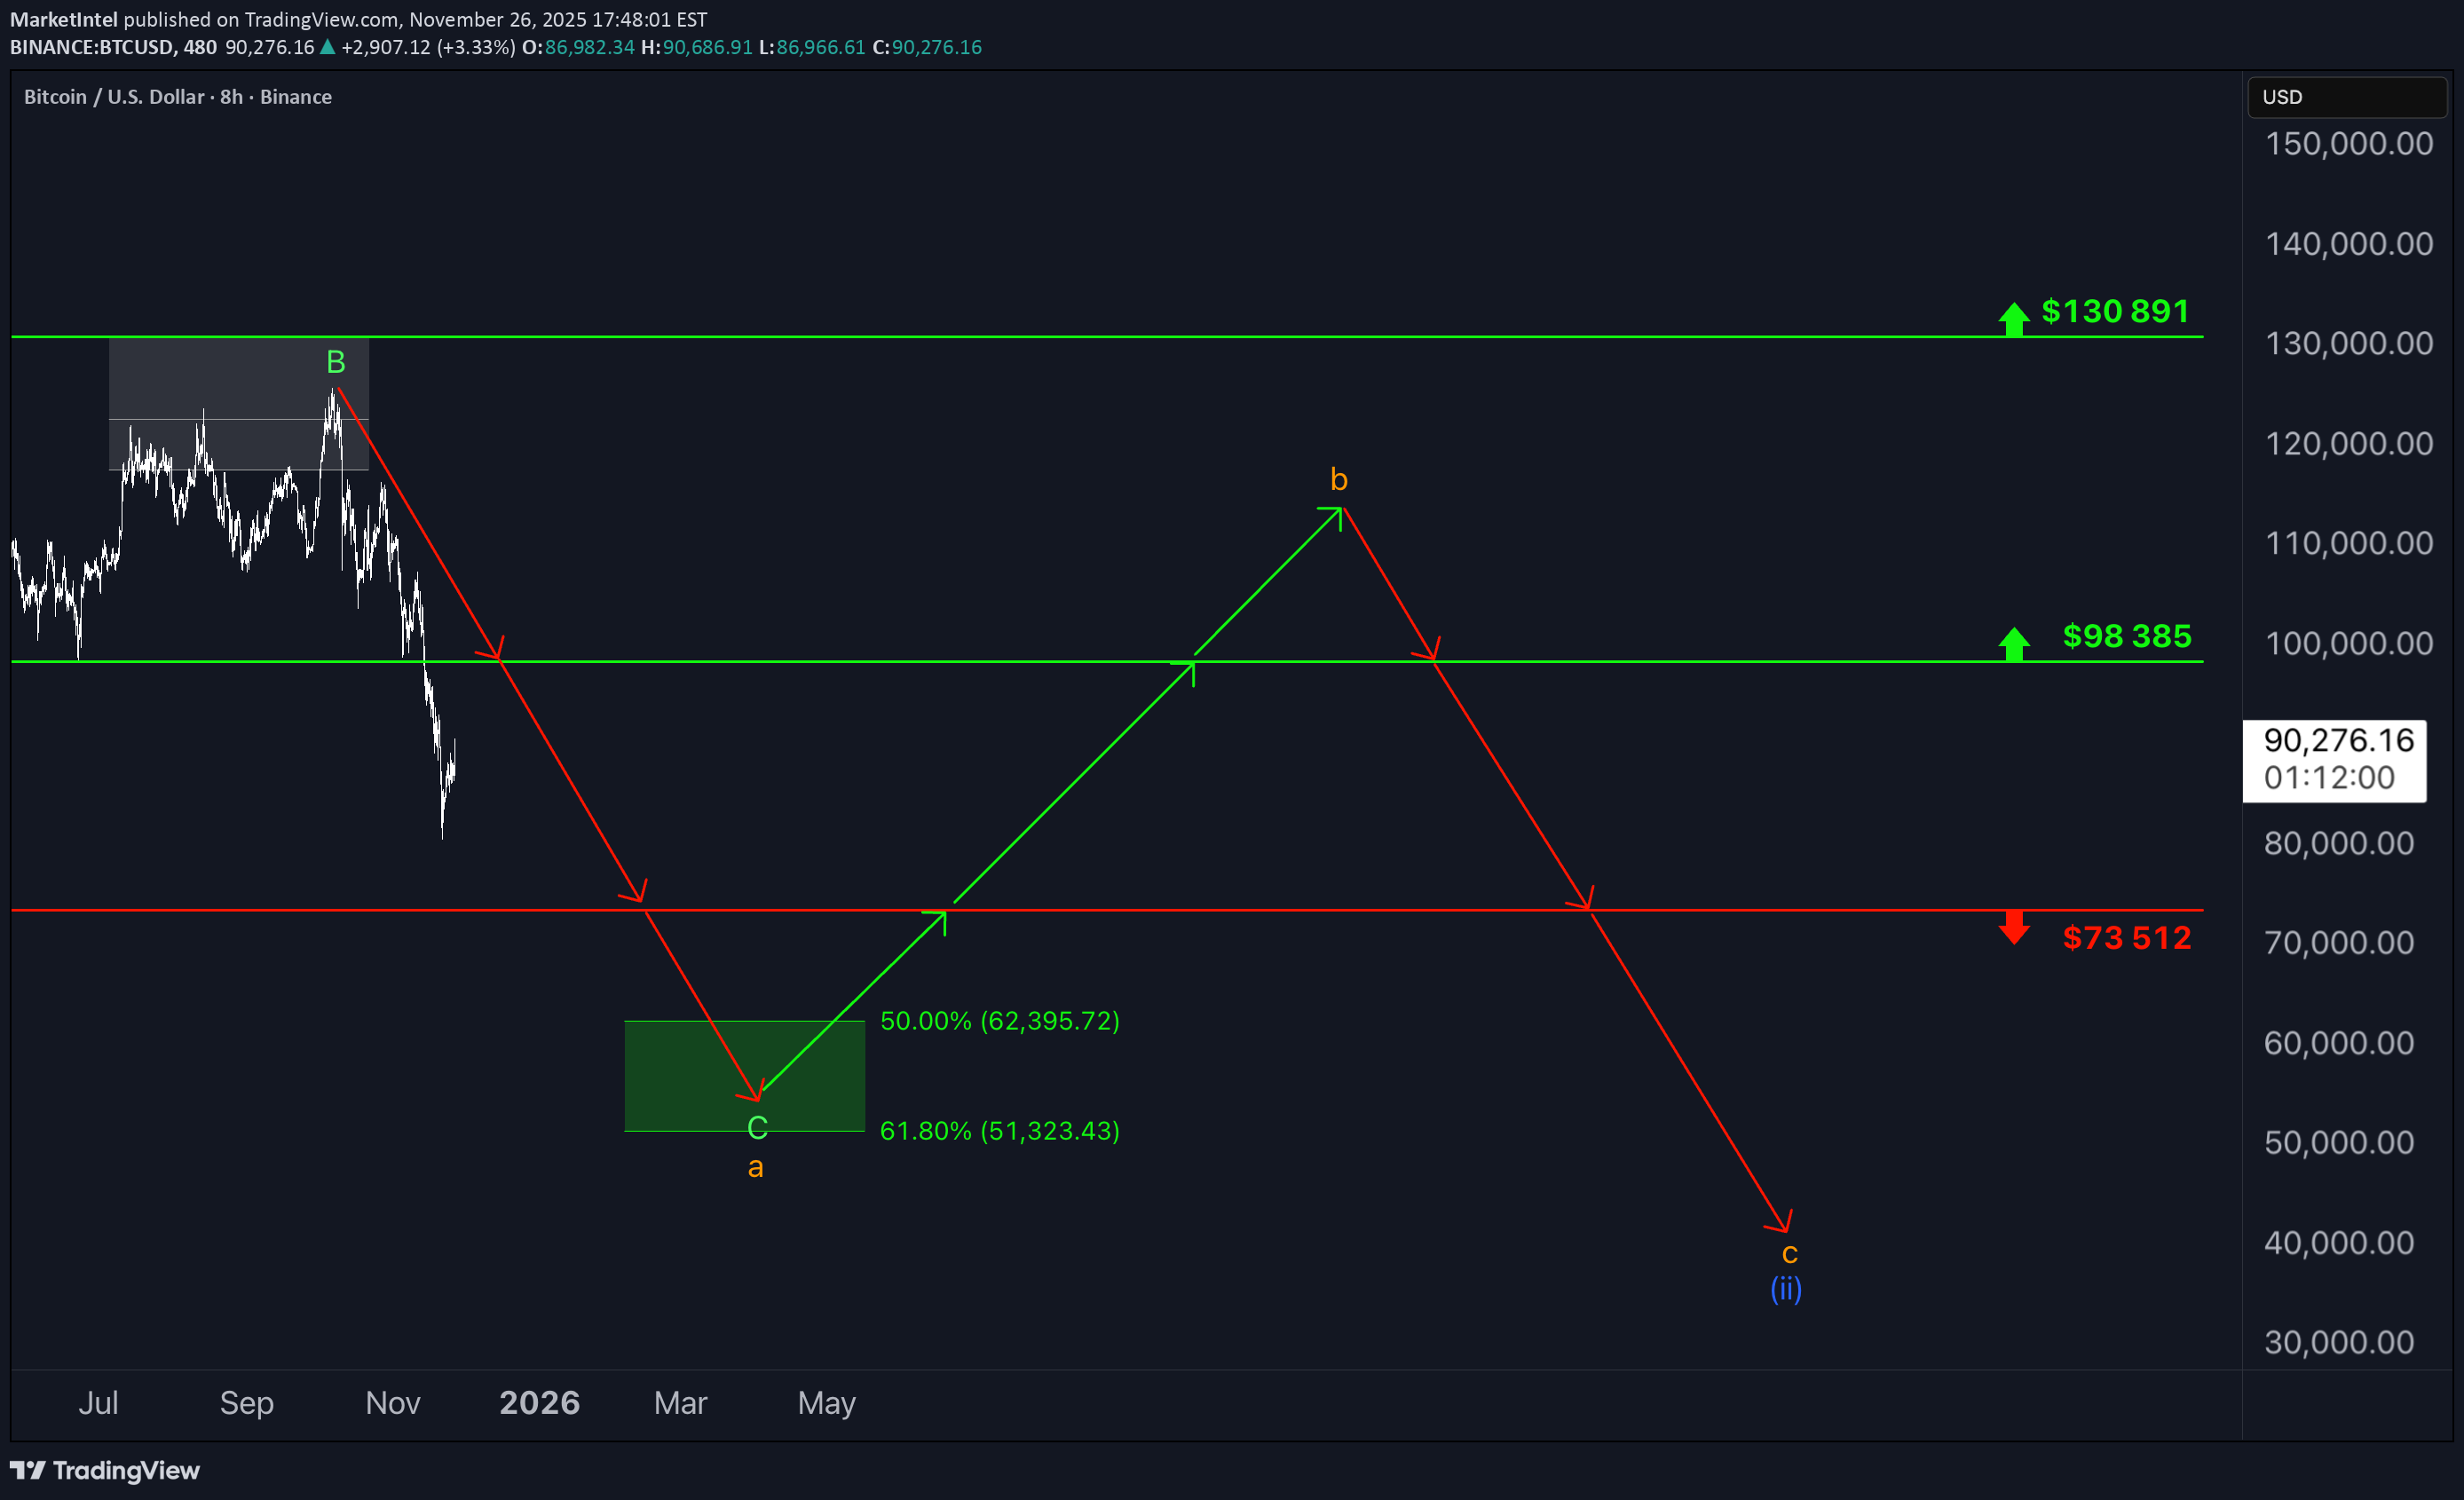
Bitcoin currently appears to be forming an internal countermove within the ongoing orange wave a. Nevertheless, our primary outlook remains that this a-wave will ultimately extend into our green Target Zone, which ranges from $62,395 to $51,323. From this low, we expect another corrective move to the upside before the final downward leg of the wave (ii) correction—an overall pattern that has been developing since January—reaches completion.
MarketIntel
لایتکوین در آستانه سقوط؛ ناحیه هدف ۷۸ دلاری در تیررس!
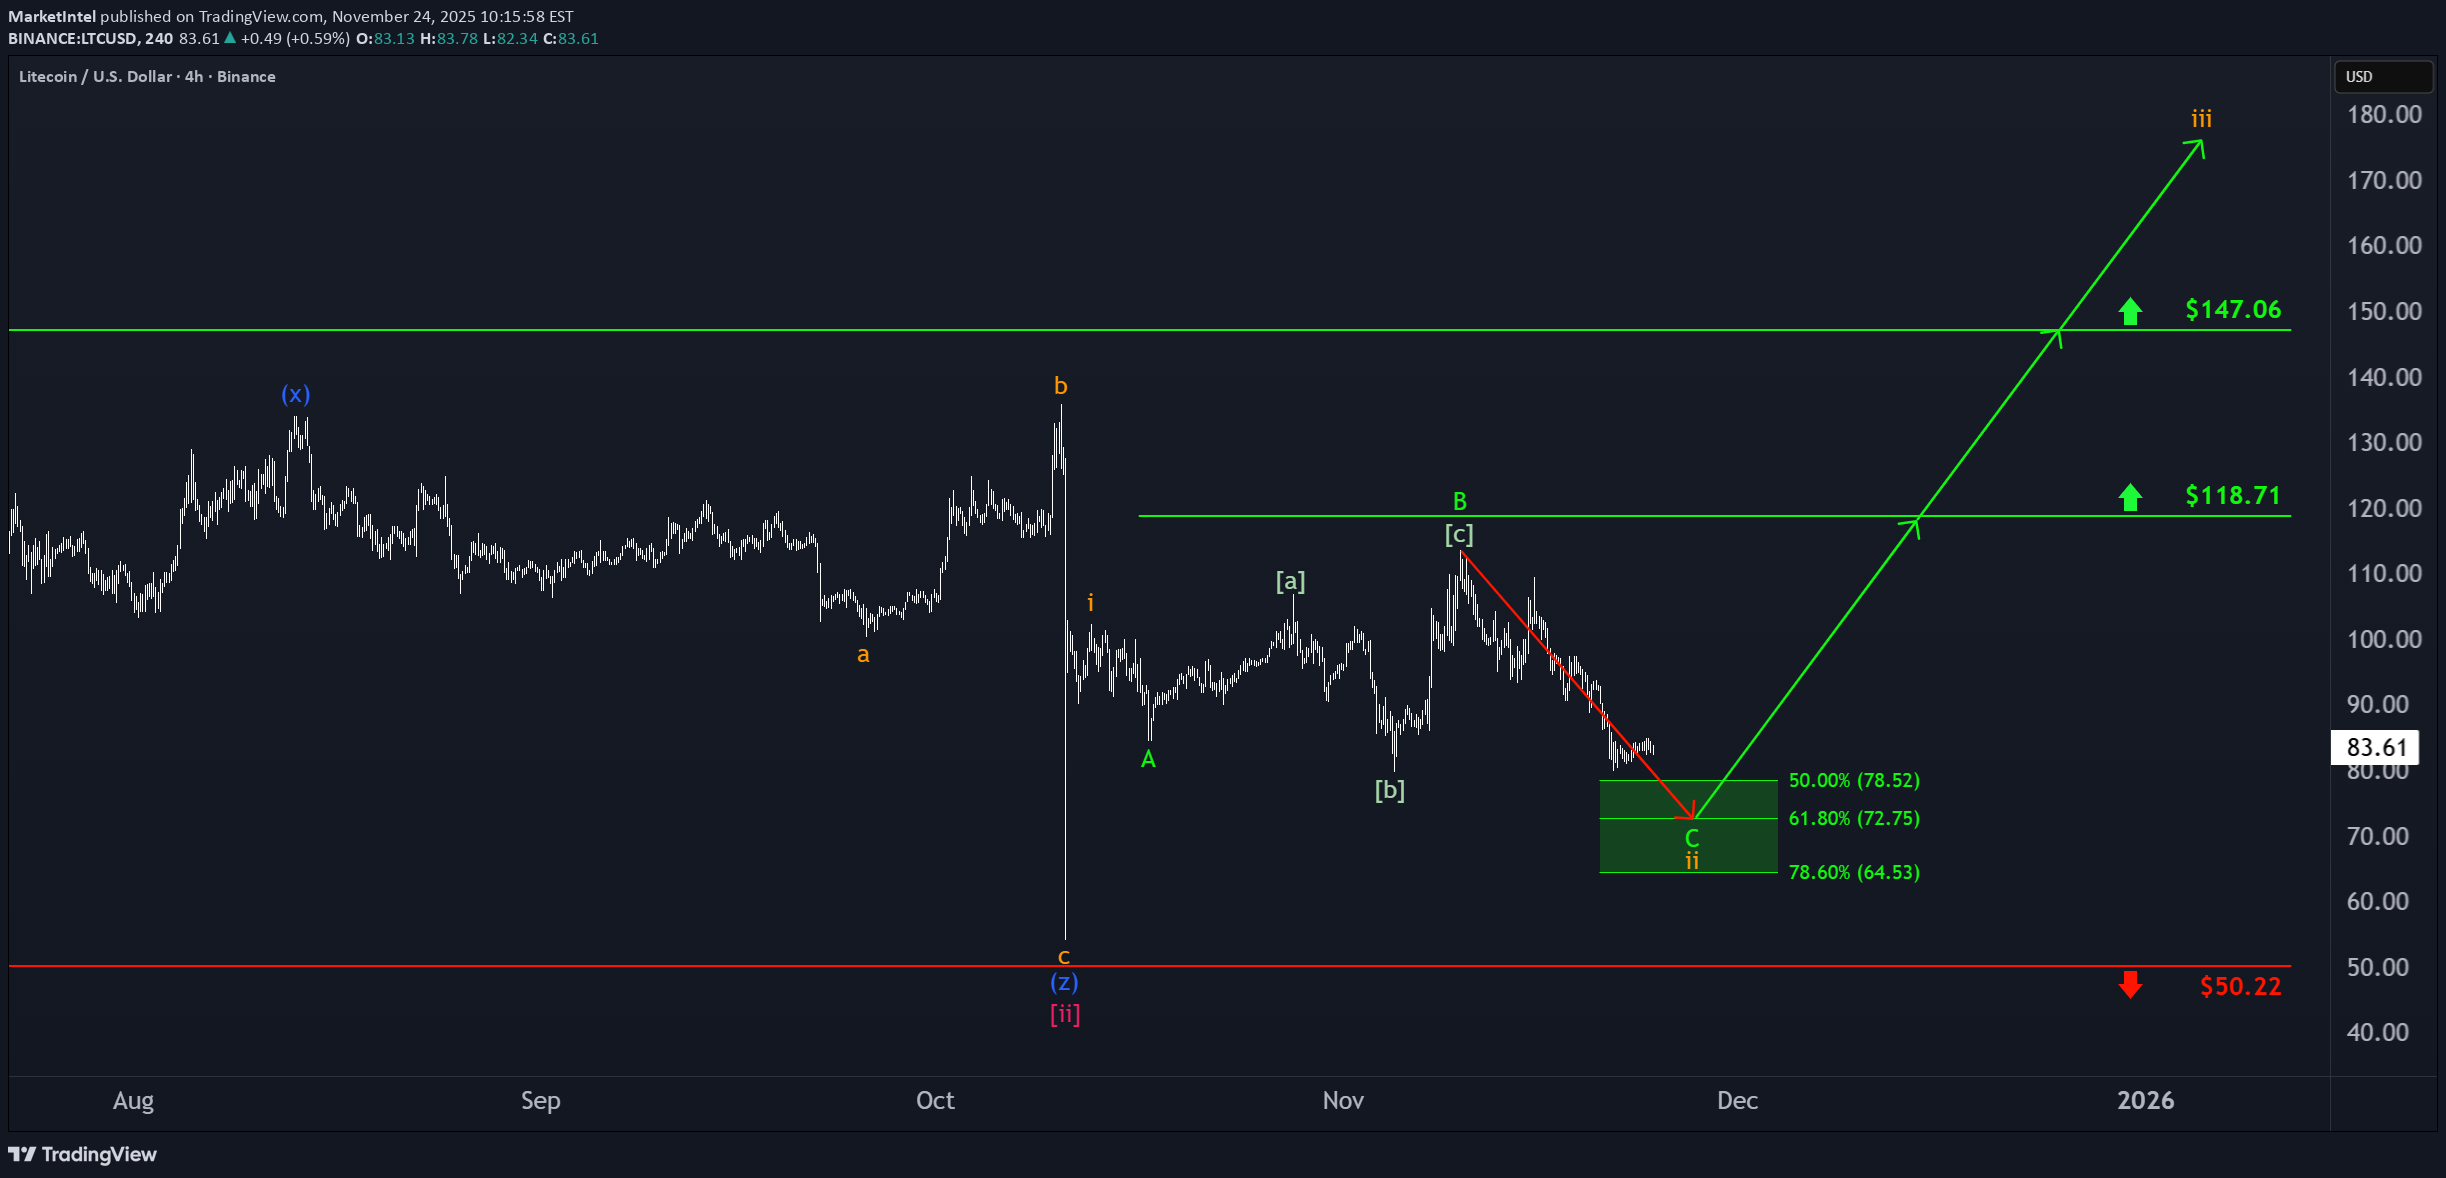
LTC has recently continued its decline, leading us to believe that the high for green wave B is likely already in place. Price is now just a short distance from our green Target Zone, which ranges from $78.52 to $64.53. Within this zone, we expect to see the low of orange wave ii. Afterward, orange wave iii should drive price above the resistance levels at $118.71 and $147.06.
MarketIntel
سولانا در آستانه انفجار صعودی: هدف بعدی کجاست؟
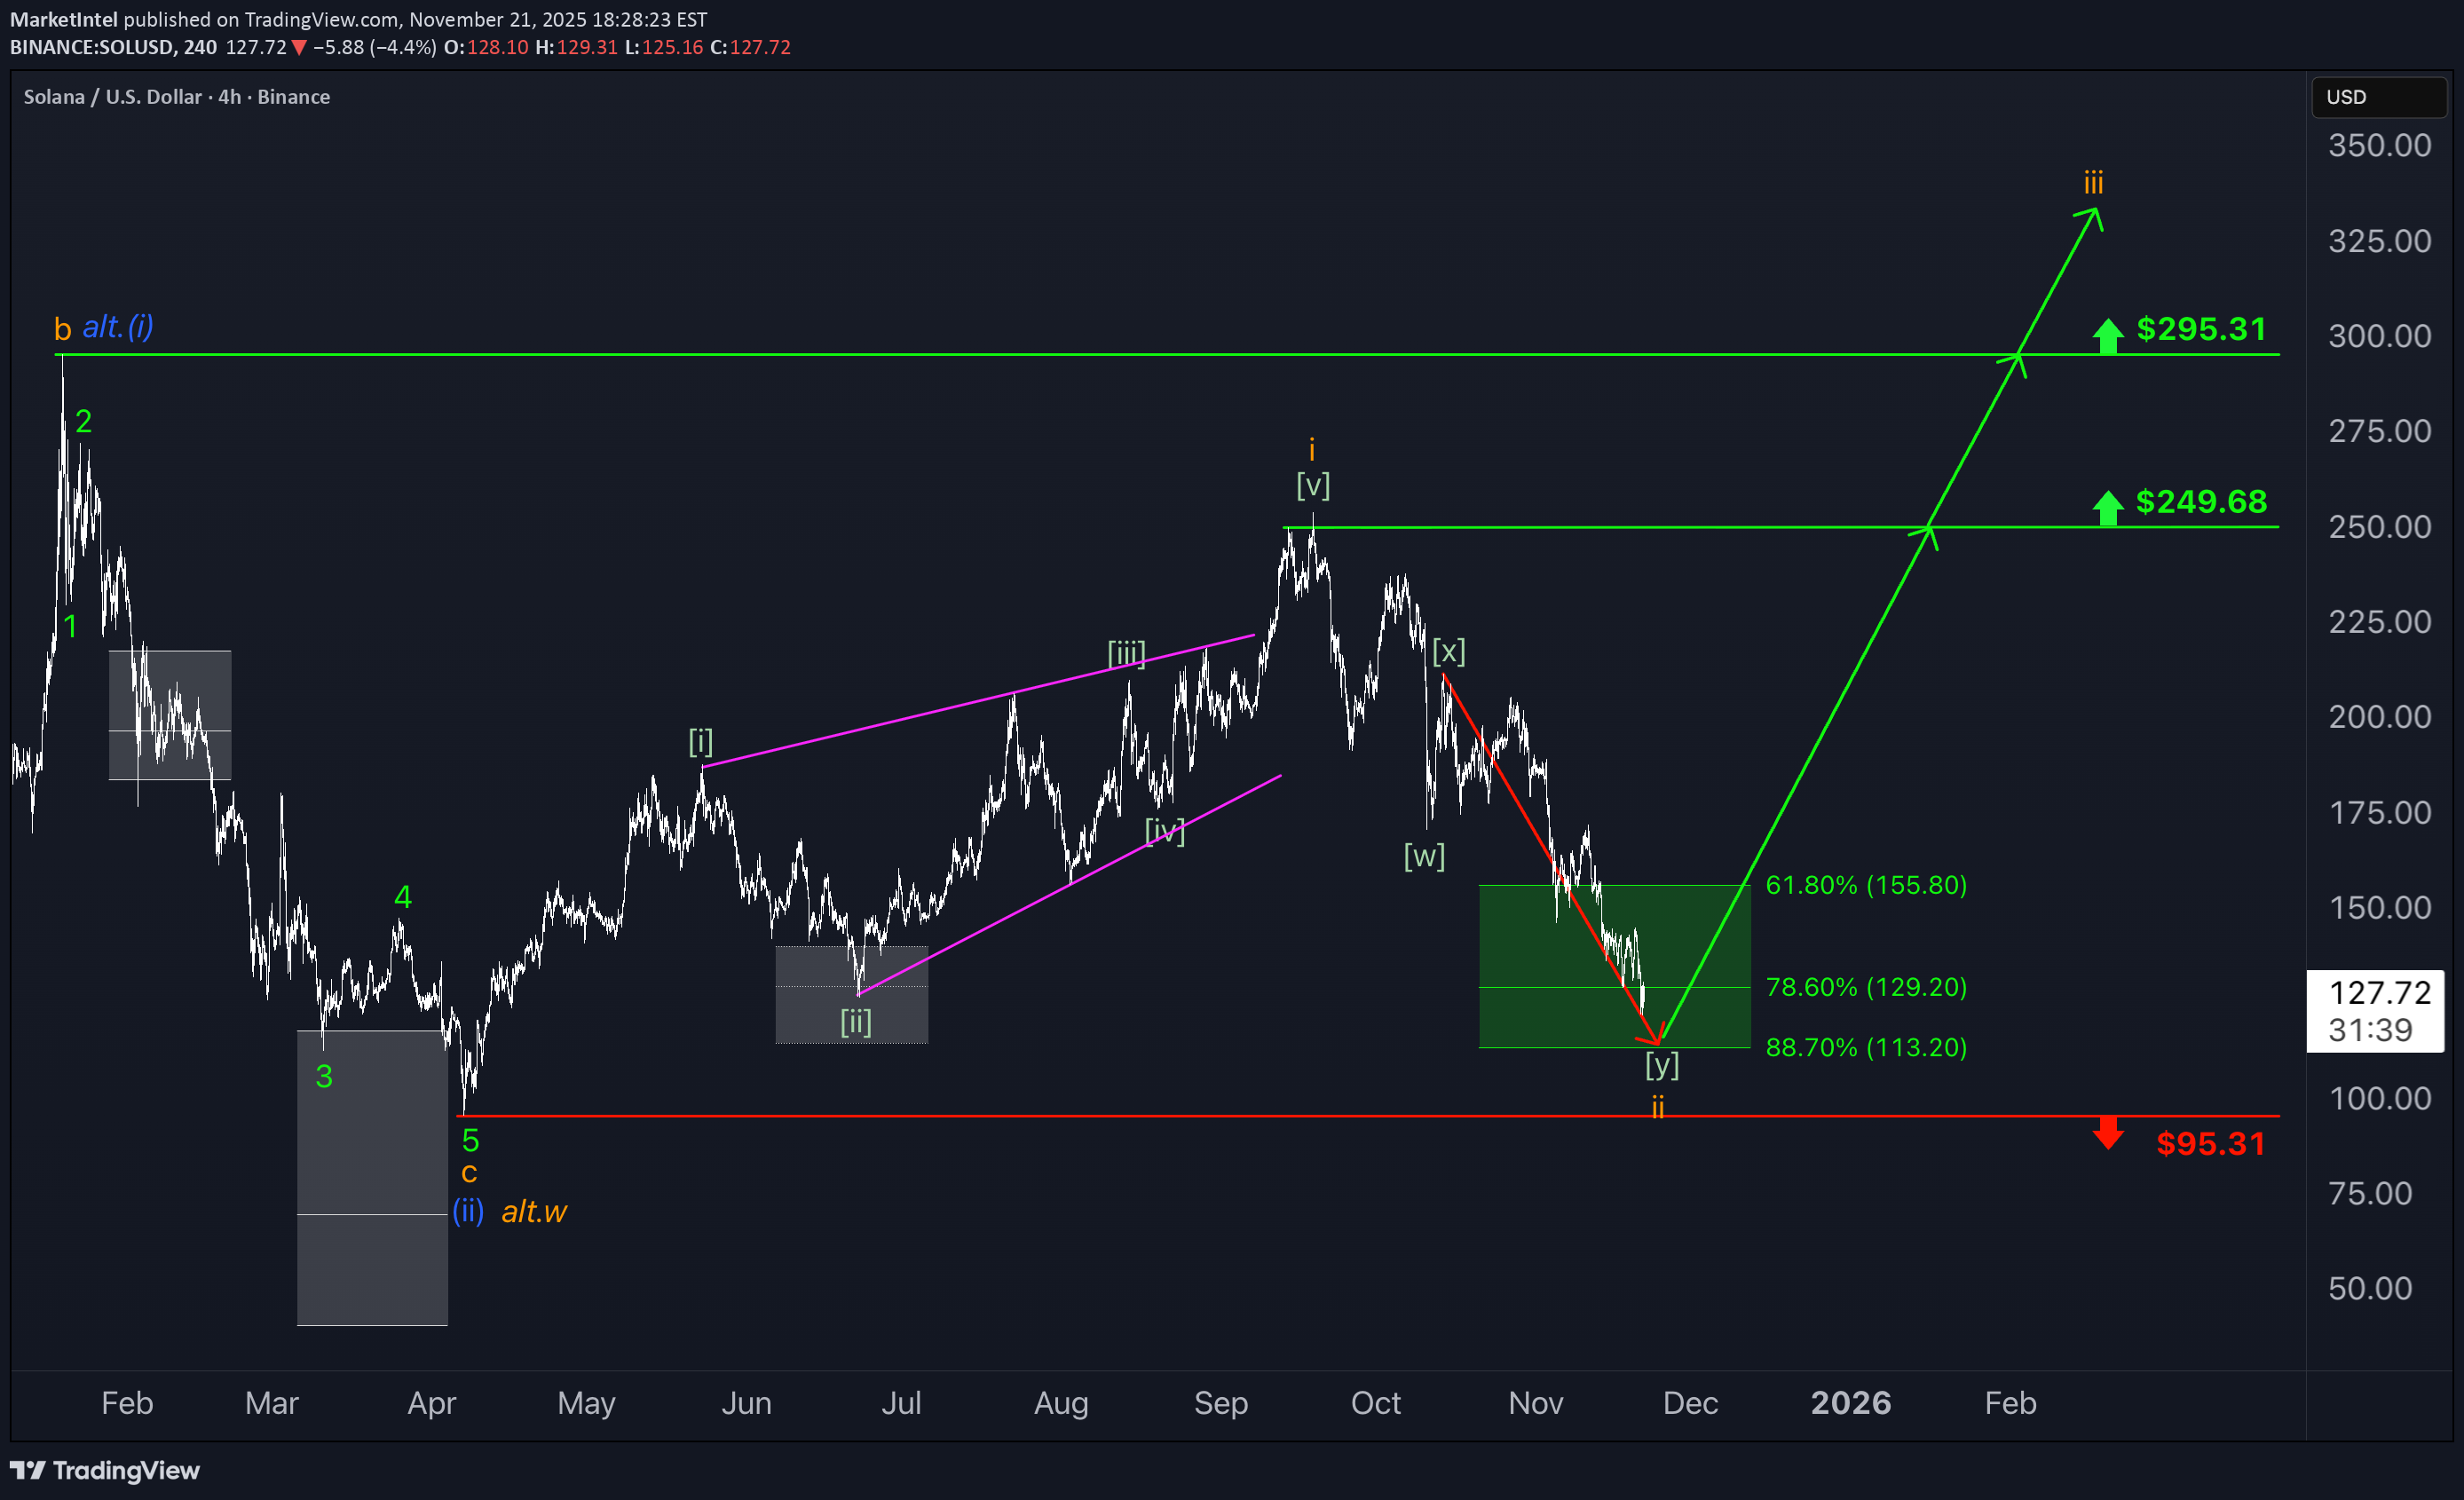
SOL recently dipped further into the now green Target Zone between $155.80 and $113.20. Within this area, we expect the low of wave ii in orange to be established imminently. Afterward, we anticipate a strong wave iii rally, which should peak above resistance at $295.31.
MarketIntel

MarketIntel
فشار نزولی بازار شدیدتر شد: کجا کف قیمت تشکیل میشود؟

Strategy has continued to develop downward pressure as anticipated since our last update, bringing it closer to the targeted low of the turquoise wave 2. Our alternative—and now grayed-out—Target Zone has been breached to the downside, allowing us to remove the alternative scenario of a premature breakout to the upside. Investors who speculated on this alternative and entered within the alternative Target Zone with a stop 1% below the lower edge have likely been stopped out by now. For now, we are still allowing some room for turquoise wave 2 to move lower; however, it should find its bottom above the support at $102.40 to set the stage for wave 3 to advance further above the resistance at $674.18.
MarketIntel
رالی صعودی آوالانچ (AVAX): آیا سقف ۳۶ دلار شکسته میشود یا سقوط زیر ۸ دلار در راه است؟

Avalanche (AVAX) has recently posted significant gains, leaving our outlook unchanged. We continue to believe price is currently in a five-wave magenta upward move, which should soon push it above the resistance level at $36.19. Our alternative scenario also remains valid, in which AVAX could target new absolute lows below support at $8.64 (probability: 33%).
MarketIntel
تحلیل تکنیکال XRP: ناحیه هدف هیجانانگیز کجاست؟

Ripple’s XRP has seen a modest rebound recently, but this hasn’t altered our outlook. We continue to expect further declines as part of a blue five-wave move down into the turquoise Target Zone ($1.03–$0.38), which is suitable for long-side entries. Within this zone, we anticipate that the low of the larger wave B in turquoise will be established. From there, we expect wave C to rally above resistance at $4.09 and complete the larger wave (Y) in magenta. We still assign a 30% probability to the scenario in which the low of wave alt.B in turquoise has already been reached.
Disclaimer
Any content and materials included in Sahmeto's website and official communication channels are a compilation of personal opinions and analyses and are not binding. They do not constitute any recommendation for buying, selling, entering or exiting the stock market and cryptocurrency market. Also, all news and analyses included in the website and channels are merely republished information from official and unofficial domestic and foreign sources, and it is obvious that users of the said content are responsible for following up and ensuring the authenticity and accuracy of the materials. Therefore, while disclaiming responsibility, it is declared that the responsibility for any decision-making, action, and potential profit and loss in the capital market and cryptocurrency market lies with the trader.