
MangoMan4
@t_MangoMan4

What symbols does the trader recommend buying?
Purchase History
پیام های تریدر
Filter
LQTY – Accumulation Completed | Preparing for Trend Reversal
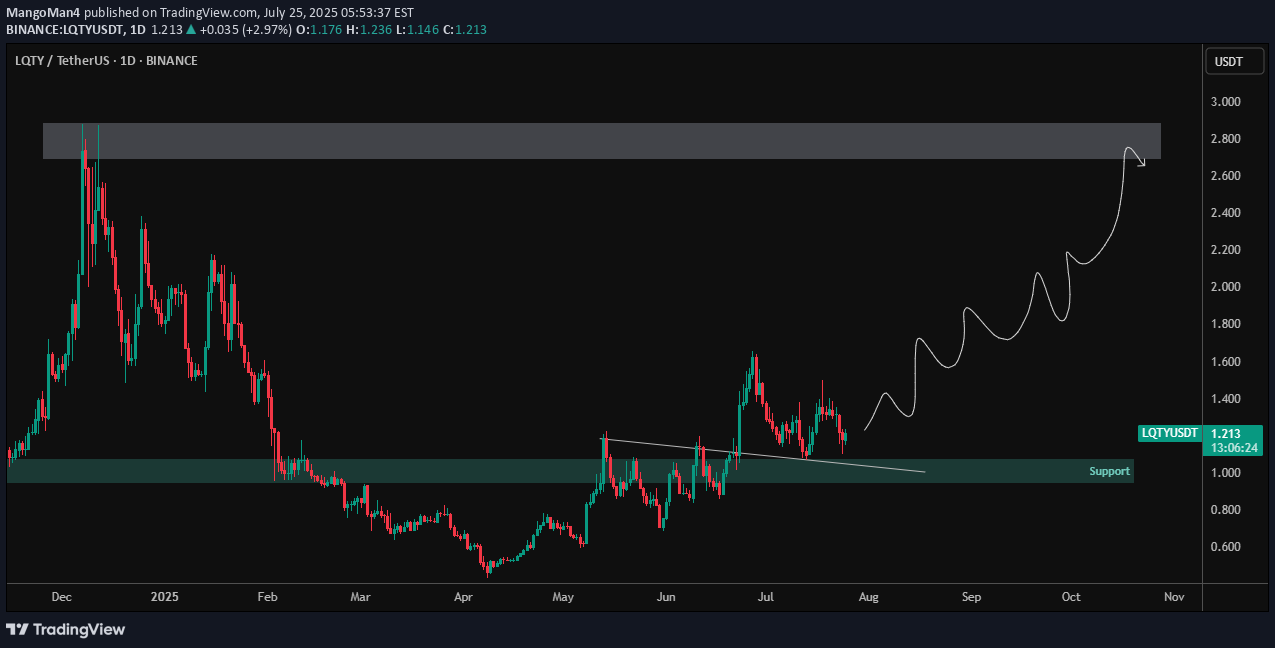
LQTY has broken out from a descending structure and reclaimed the key support zone around $1.00–$1.10, showing early signs of accumulation and bullish strength. Currently forming a higher low structure, suggesting a potential long-term uptrend is brewing. 🔹 Technical Highlights: ✅ Clean breakout from descending trendline ✅ Retest of breakout zone holding as support (~$1.10) 🔼 Price printing bullish higher lows on the daily timeframe 🎯 Target zone: $2.70–$2.90 (major resistance from previous highs) 📌 Technical View: Strong structural base forming Pullbacks into support area could offer high R/R entries Break above $1.50 may ignite bullish continuation toward the upper target zone LQTY appears to be transitioning from accumulation to markup phase. Monitor price action and volume for confirmation of the next leg.
#SEIUSDT – Testing Resistance with Eyes on Breakout
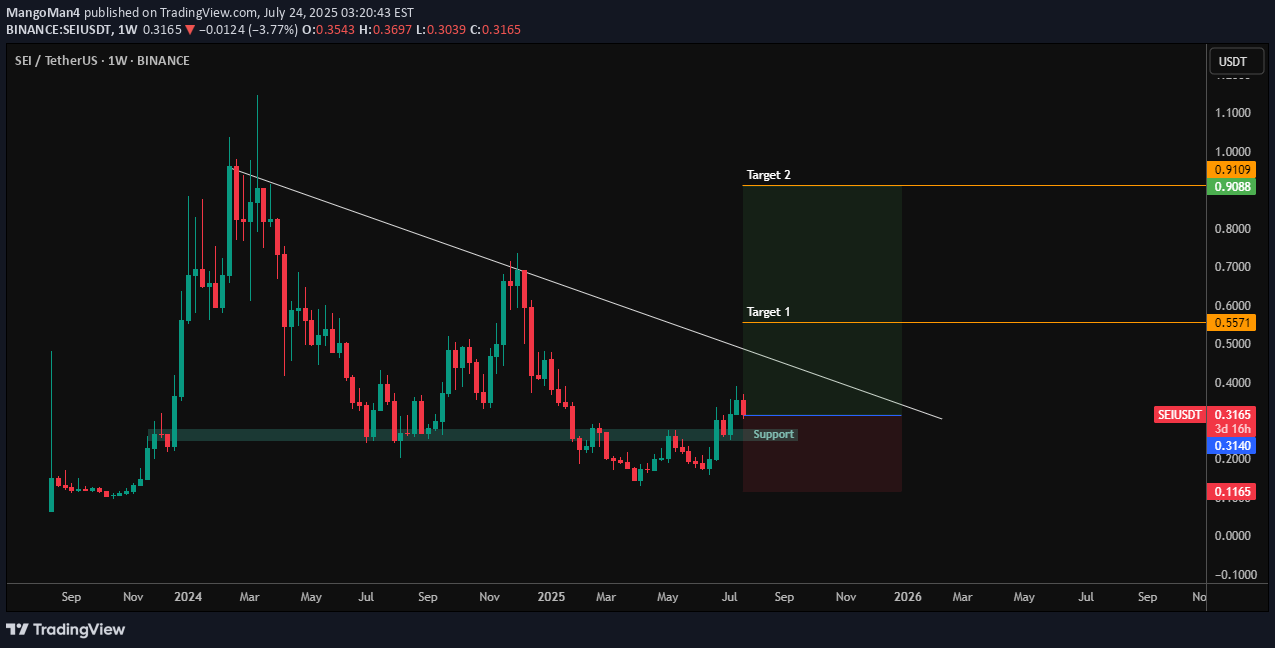
SEI is currently approaching a major descending trendline resistance after reclaiming the key weekly support zone around $0.20–$0.31. Price action is showing strength with a potential reversal setup building. 🔹 Key Technical Levels: 🔽 Support: $0.20–$0.31 (reclaimed zone) 📉 Resistance: Descending trendline from previous highs 🎯 Target 1: $0.5571 🎯 Target 2: $0.9109 🛑 Invalidation: Break below $0.1165 (risk zone) 📌 Technical Outlook: Bullish structure forming above a long-held support A breakout from the trendline could initiate a strong leg upward Risk-to-reward remains favorable for mid-term swing setups Watch for volume confirmation if SEI closes above the trendline. Momentum may accelerate toward the targets with bullish follow-through.
#XRPUSDT – Massive Breakout from Bullish Pennant | Eyeing $4.80+
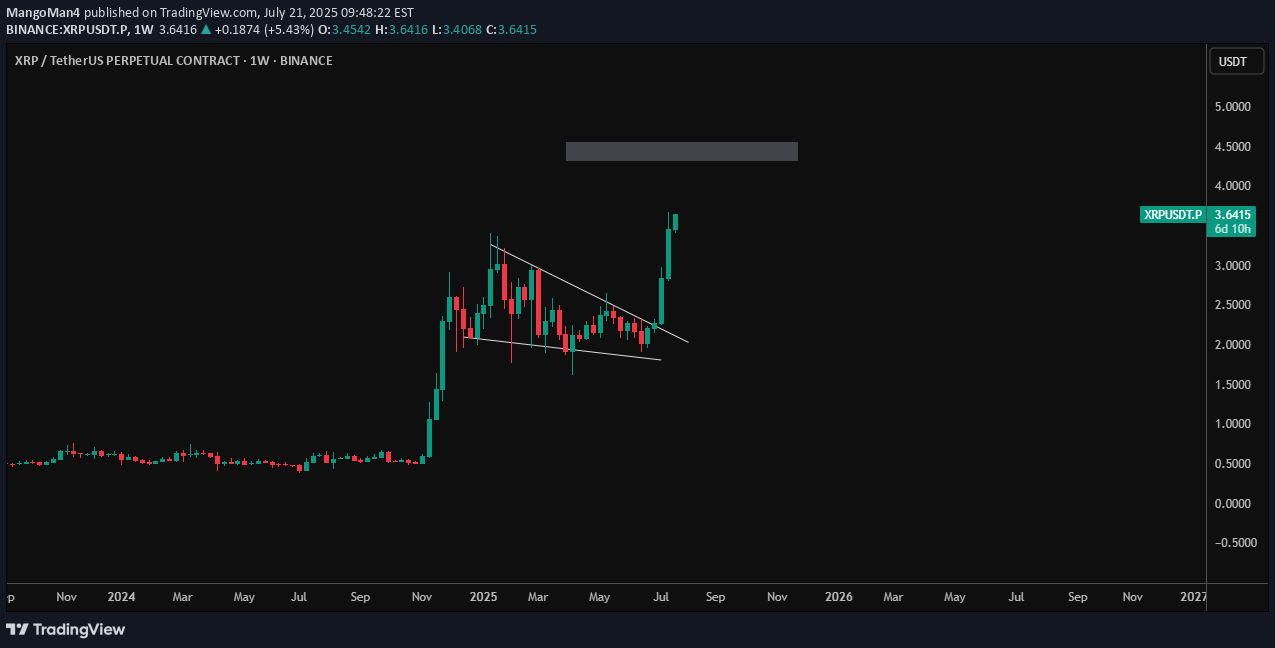
XRP has exploded out of a multi-month bullish pennant formation on the weekly timeframe, confirming a strong continuation pattern after a period of consolidation. 🔹 Key Technical Insights: ✅ Bullish pennant structure formed after a parabolic run ✅ Strong breakout candle with volume confirmation 🔼 Price now testing $3.60+ area 🎯 Target zone next: $4.80–$5.00, aligned with previous price inefficiencies and psychological resistance 📌 Why This Matters: XRP is showing one of the cleanest technical breakouts among large-cap altcoins Weekly breakout from consolidation = high probability continuation Ideal for swing traders looking for momentum plays As long as the breakout structure holds, XRP could continue its rally toward the upper target range.
#DOGEUSDT – Major Breakout Signals Strong Long-Term Momentum
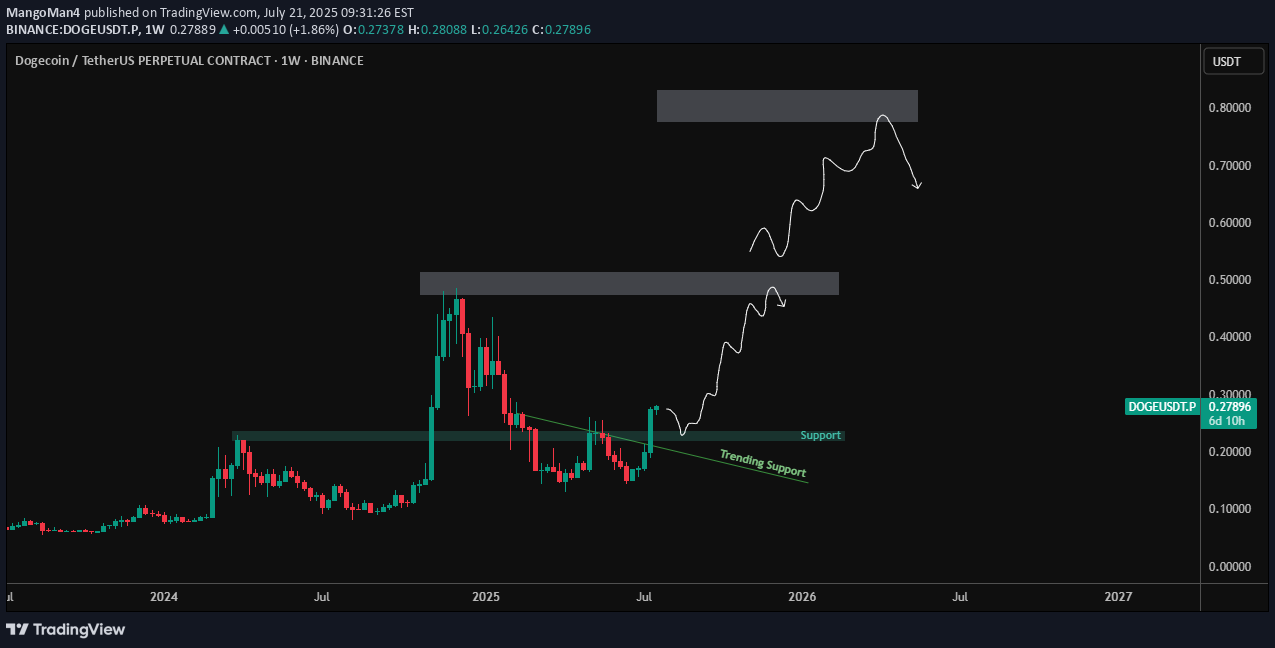
Dogecoin is showing significant bullish structure on the weekly timeframe, having broken out of a long-term descending trendline and reclaimed key horizontal support around $0.20–$0.22. 🔹 Key Technical Developments: ✅ Breakout above multi-month trendline resistance ✅ Retest and reclaim of major horizontal support zone 🔼 Price now forming higher highs and higher lows 📈 Path to next resistance zone: $0.48–$0.52 🎯 Long-term target zone: $0.75–$0.85 📌 Key Levels to Watch: Support: $0.20 (horizontal) & uptrend line Mid-Term Resistance: $0.48–$0.52 Long-Term Target: $0.75–$0.85 With weekly structure shifting bullish and trendline broken, DOGE could see a strong continuation if BTC remains stable. Ideal for swing/position traders.
SOL/USDT – Weekly Chart Analysis (July 18, 2025)
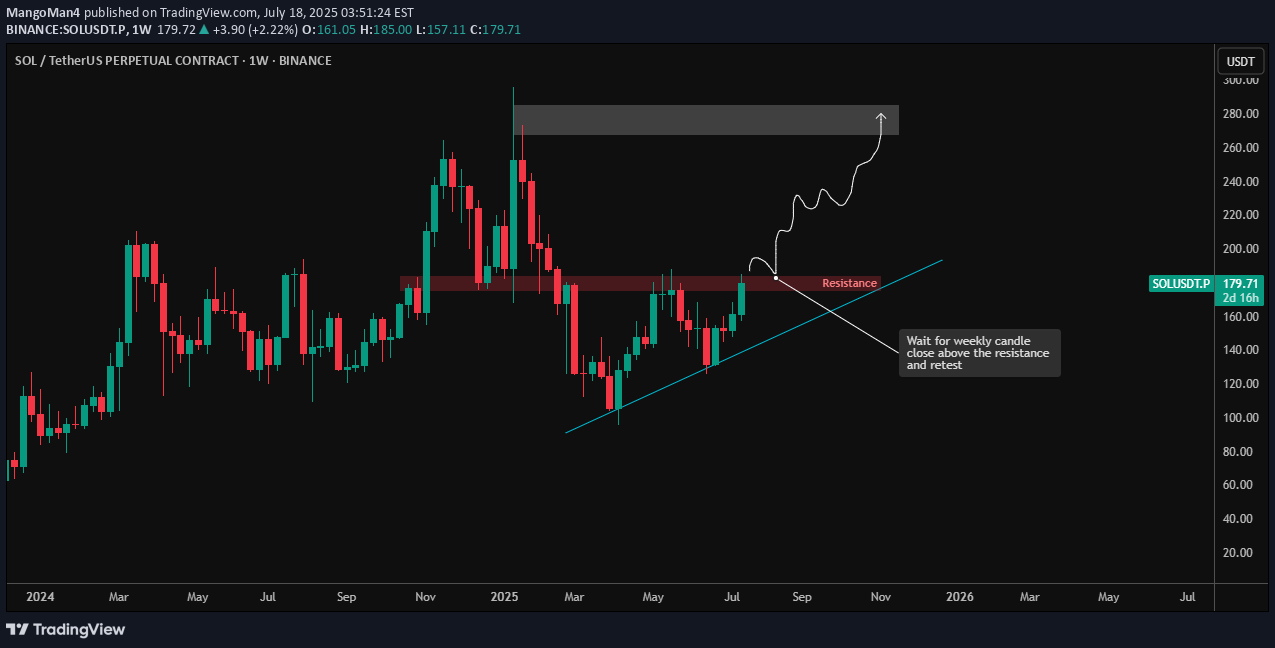
Solana is at a critical breakout point as price pushes against a long-standing horizontal resistance zone between $175–$180. This zone has been tested multiple times since late 2024, making it a significant level to watch. 🔹 Current Price: ~$179.66 🔹 Resistance Zone: $175–$180 🔹 Next Major Supply Zone: $260–$290 🔹 Trendline Support: Still intact and respected since the Q2 lows 📌 Key Setup: SOL is attempting a breakout above the horizontal resistance. Price structure shows a series of higher lows, indicating growing bullish momentum. A weekly candle close above $180 followed by a successful retest would confirm the breakout and could open up upside toward the $260–$290 zone. 📈 Trade Plan: Breakout Entry: After a confirmed weekly close + bullish retest of $175–$180 Invalidation: Break below trendline and failure to hold above $160 Target: $260–$290 zone, where previous supply stepped in 🧠 Patience is key: Wait for confirmation and don’t chase breakout candles. This level has historically acted as a trap — confirmation is critical for safer entries. #Solana #SOLUSDT #CryptoTrading #TechnicalAnalysis #Altcoins #Binance
DOGE/USDT – 4H Chart Analysis (July 17, 2025)
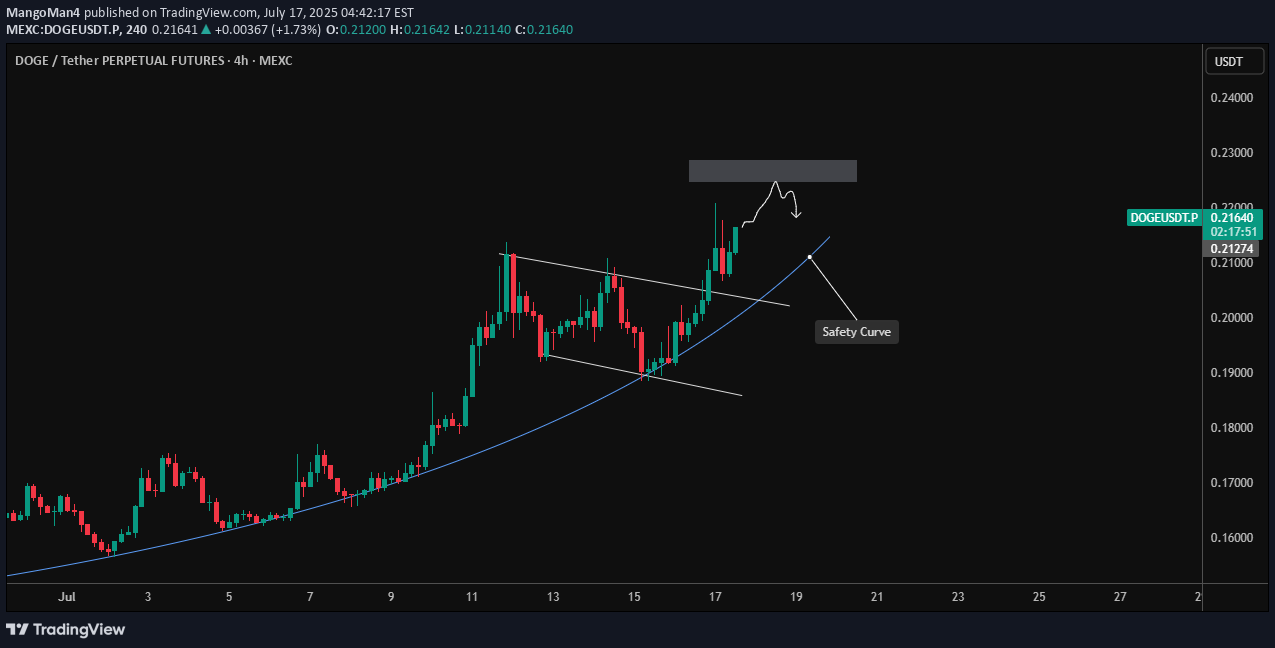
Dogecoin has been riding a strong uptrend, maintaining its momentum along a parabolic safety curve, which has been respected multiple times. 📈 Recently, DOGE broke out of a descending channel and is now approaching a resistance zone around $0.225–$0.230. This area previously acted as a supply zone, and price action suggests a short-term rejection could be forming. 🟦 Key Observations: Parabolic trendline acting as a "safety curve" support. Price approaching a supply zone with signs of slowing momentum. Potential short-term double top or lower high forming. 📌 Scenarios to Watch: Pullback from resistance → Retest of the safety curve (~$0.21) = potential long setup. Break and hold above $0.230 = bullish continuation, targeting new local highs. ⚠️ Risk Management: Enter on confirmation; don't chase green candles near supply. A breakdown of the safety curve may lead to deeper correction. #Dogecoin #DOGEUSDT #Crypto #TechnicalAnalysis #Altcoins #MEXCworked as planned
ETH/USDT – Weekly Chart Analysis (July 17, 2025)
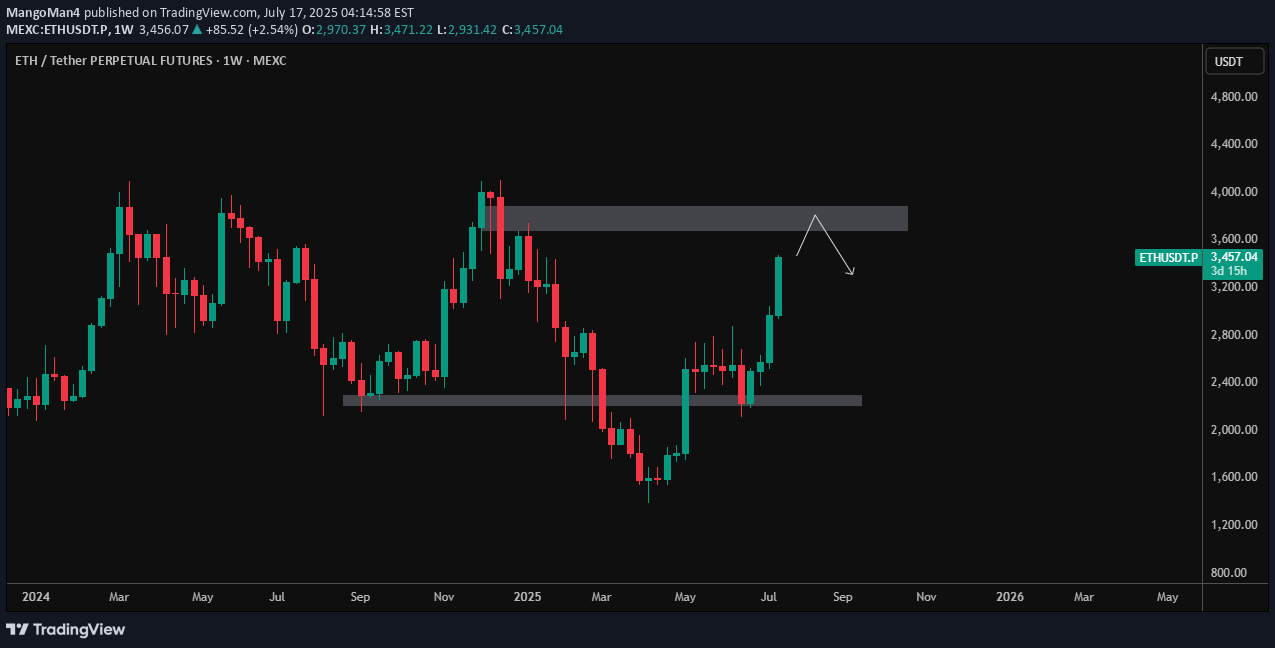
Ethereum has shown a strong bullish push, breaking above the prior consolidation zone between $2,400–$2,600. Price is now approaching a significant weekly supply zone between $3,800–$4,100 — a region that previously acted as a major reversal point. 🔹 Current Price: ~$3,460 🔹 Resistance Zone: $3,800–$4,100 🔹 Support Zone: $2,400–$2,600 📌 Possible Scenarios: Rejection from resistance: ETH may test the upper supply zone and face selling pressure, triggering a pullback toward the mid-range or support. Breakout & Close Above $4,100: Would signal strong bullish continuation with potential targets toward new highs. 📉 Watch for: Bearish price action near resistance or a potential lower high forming. 📈 Bullish Bias Confirmed if: Weekly close above $4,100 with volume support. 🧠 Patience is key at major levels. Let price action guide the next move.
BTCUSDT 1 Day – Breakout and Retest Completed | Next Target
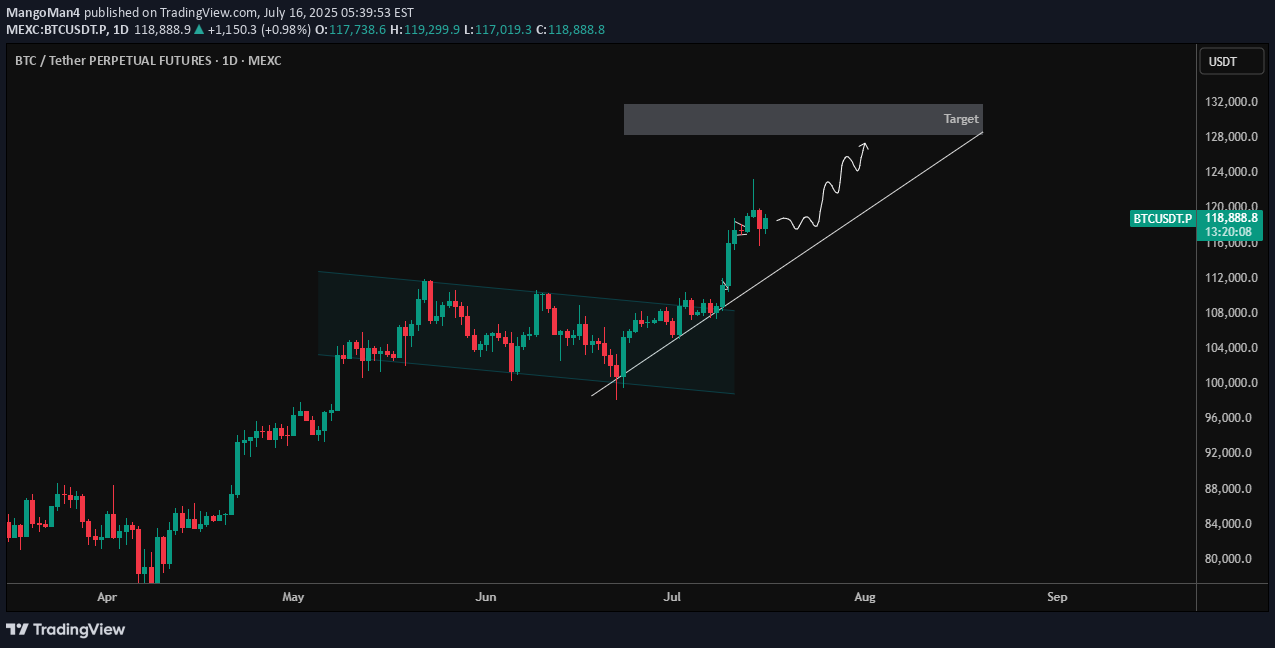
BTC has officially broken out of the descending parallel channel that dominated price action from mid-May to early July. After a successful breakout, price pulled back for a clean retest of the channel resistance, which has now flipped to support — a classic bullish continuation signal. 🔹 Key Technical Highlights: ✅ Breakout from descending channel structure ✅ Retest of breakout zone confirmed with strong bullish candles 🔼 Current Price: ~$118,971 (as of chart time) 📈 Short-Term Structure: Following a clean higher-low formation with ascending trendline support 🎯 Target Zone: $128,000–$130,000 (next key resistance area) As long as BTC maintains this ascending support line, the momentum remains with the bulls. Any dips toward the trendline may offer good long opportunities with proper risk management. 📌 Watch for: Rejection near the target zone Bullish continuation patterns like flag/pennant on lower timeframes Volume confirmation during breakout attempts Let the trend be your friend. Trade safe! ⚡
SOLUSDT.P – Watch for Reversal from Key Demand Area (4H Outlook)

SOL on the 4-hour timeframe is forming a potentially bullish setup, but patience is key as price nears a critical reversal zone.🧠 Market Context:After a strong move up in late June, SOL faced heavy rejection near $155–$157, which aligns with both a supply zone and a long-term descending trendline (visible across higher timeframes).Since then, we’re seeing a series of lower highs, signaling ongoing seller control in the short term.🔄 Short-Term Price Action:The recent candles form a rounded consolidation, with volatility compressing.Price is expected to retest the $143–$144 area, highlighted as the "Reversal Area" on the chart.This area previously acted as a pivot and may serve again as a demand zone.🛠️ Trade Plan:Wait for a reaction at $143–$144: either a bullish engulfing, hammer, or strong volume candle to confirm buyer presence.If reversal occurs, potential move is toward $150–$152, where price meets the long-term descending trendline again.This setup aligns with a classic "higher low" formation before continuation.❌ Invalidation:Clean break below $142 with strong volume would invalidate the short-term bullish thesis and may open up downside to $138.✅ Summary:Bias: Bullish on confirmationReversal Zone: $143–$144Target: $150–$152Invalidation: Below $142This setup provides a low-risk, high-reward opportunity — but only with a confirmed reversal. Let the market show its hand.
SOLUSDT.P – Waiting for Bullish Confirmation at Key Zone

The daily chart of SOLUSDT Perpetual Futures (MEXC) is currently showing signs of a potential reversal setup, but confirmation is key before taking a long position.🔍 Chart Overview:Price action is in a clear downtrend, with lower highs forming consistently, capped by a descending trendline.We’ve recently seen a pullback after a failed breakout near the $152–$154 region.📌 Key Zone to Watch:A demand zone around $137–$140 is marked, which previously acted as a springboard for bullish movement.There's a confluence of this demand zone with the wedge breakout retest area.📈 Trade Setup & Plan:The chart notes: "Need Bullish Engulfing here to go long".This implies a waiting strategy: look for a strong bullish engulfing candle at the $137–$140 zone before entering a long position.If confirmed, price could rally back toward the descending trendline near $150–$154, which aligns with the prior resistance level.⚠️ Invalidation:A daily close below $135 would invalidate the bullish setup and likely trigger continuation toward $128–$130 support area.📊 Summary:Bias: Cautiously Bullish (Waiting for confirmation)Entry Trigger: Bullish engulfing candle at $137–$140Target: $152–$154Invalidation Level: Below $135Patience is key here. Let the price come to you and confirm intent before jumping in.
Disclaimer
Any content and materials included in Sahmeto's website and official communication channels are a compilation of personal opinions and analyses and are not binding. They do not constitute any recommendation for buying, selling, entering or exiting the stock market and cryptocurrency market. Also, all news and analyses included in the website and channels are merely republished information from official and unofficial domestic and foreign sources, and it is obvious that users of the said content are responsible for following up and ensuring the authenticity and accuracy of the materials. Therefore, while disclaiming responsibility, it is declared that the responsibility for any decision-making, action, and potential profit and loss in the capital market and cryptocurrency market lies with the trader.