
LQTY
لیکوییتی
| تریدر | نوع سیگنال | حد سود/ضرر | زمان انتشار | مشاهده پیام |
|---|---|---|---|---|
نتیجه ای یافت نشد. | ||||
نمودار قیمت لیکوییتی
سود ۳ ماهه :
سیگنالهای لیکوییتی
فیلتر
مرتب سازی پیام براساس
نوع پیام
نوع تریدر
فیلتر زمان
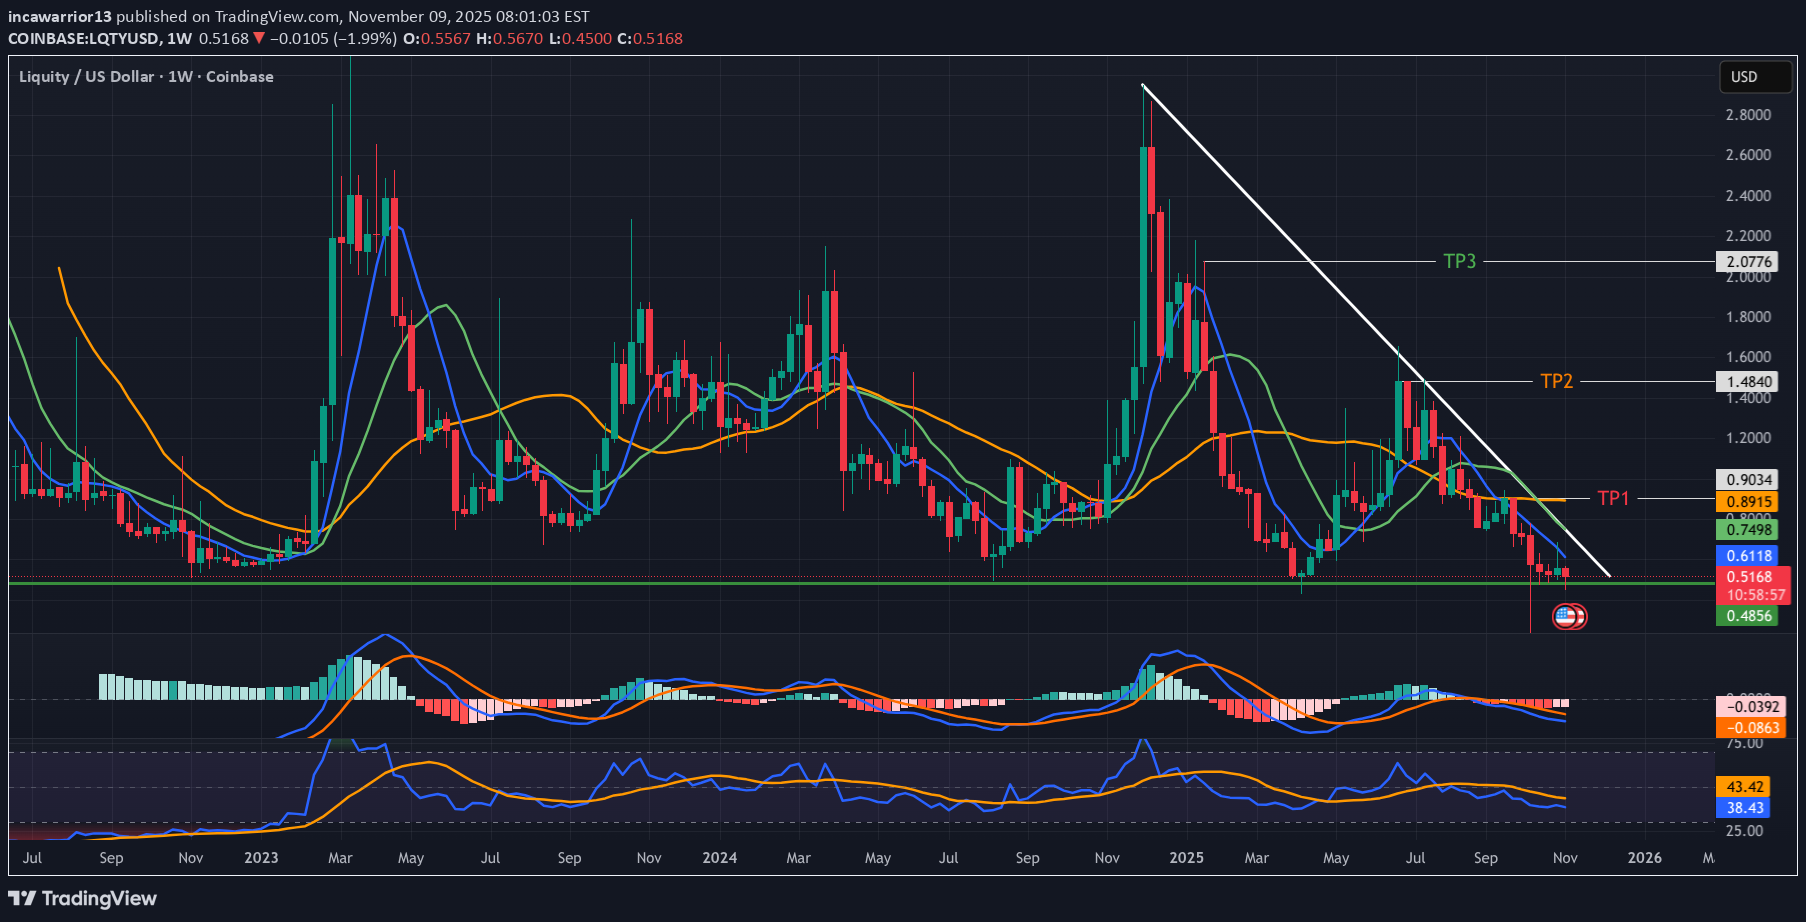
شکست مثلث نزولی LQTY/USDT: آماده سقوط به سطوح پایینتر شوید!

نمودار هفتگی به وضوح نشان می دهد مثلث نزولی شکلگیری، که با یک سری از ارتفاعات پایینتر که به سمت یک ناحیه حمایت افقی صاف فشار میآورند مشخص میشود. این نوع ساختار معمولاً یک الگوی ادامه نزولی در نظر گرفته می شود که منعکس کننده فشار فروش ثابت است. اخیرا قیمت دارد زیر تکیه گاه افقی شکسته شده است ، تایید شکست مثلث و سیگنال دادن به ادامه بالقوه به سمت نزولی. بازار نتوانست ناحیه حمایتی را که اکنون به عنوان مقاومت عمل می کند، پس بگیرد. نکات فنی کلیدی: به خوبی تعریف شده است مثلث نزولی با ارتفاع کمتر و پایه افقی. پشتیبانی شکسته شده است، نشان دهنده تسلط فروشنده است. آزمون مجدد/رد از ناحیه حمایت قبلی چشم انداز نزولی را تقویت می کند. اهداف منفی: 0.31-0.27 دلار 0.20-0.17 دلار تا زمانی که قیمت زیر محدوده حمایت شکسته باقی بماند، سناریوی ادامه نزولی انتظار غالب باقی می ماند. دستیابی به هدف. انجام شد.

VIPCryptoVault
شکست روند نزولی 4 ماهه LQTY در بازار نزولی: آیا زمان صعود فرا رسیده است؟
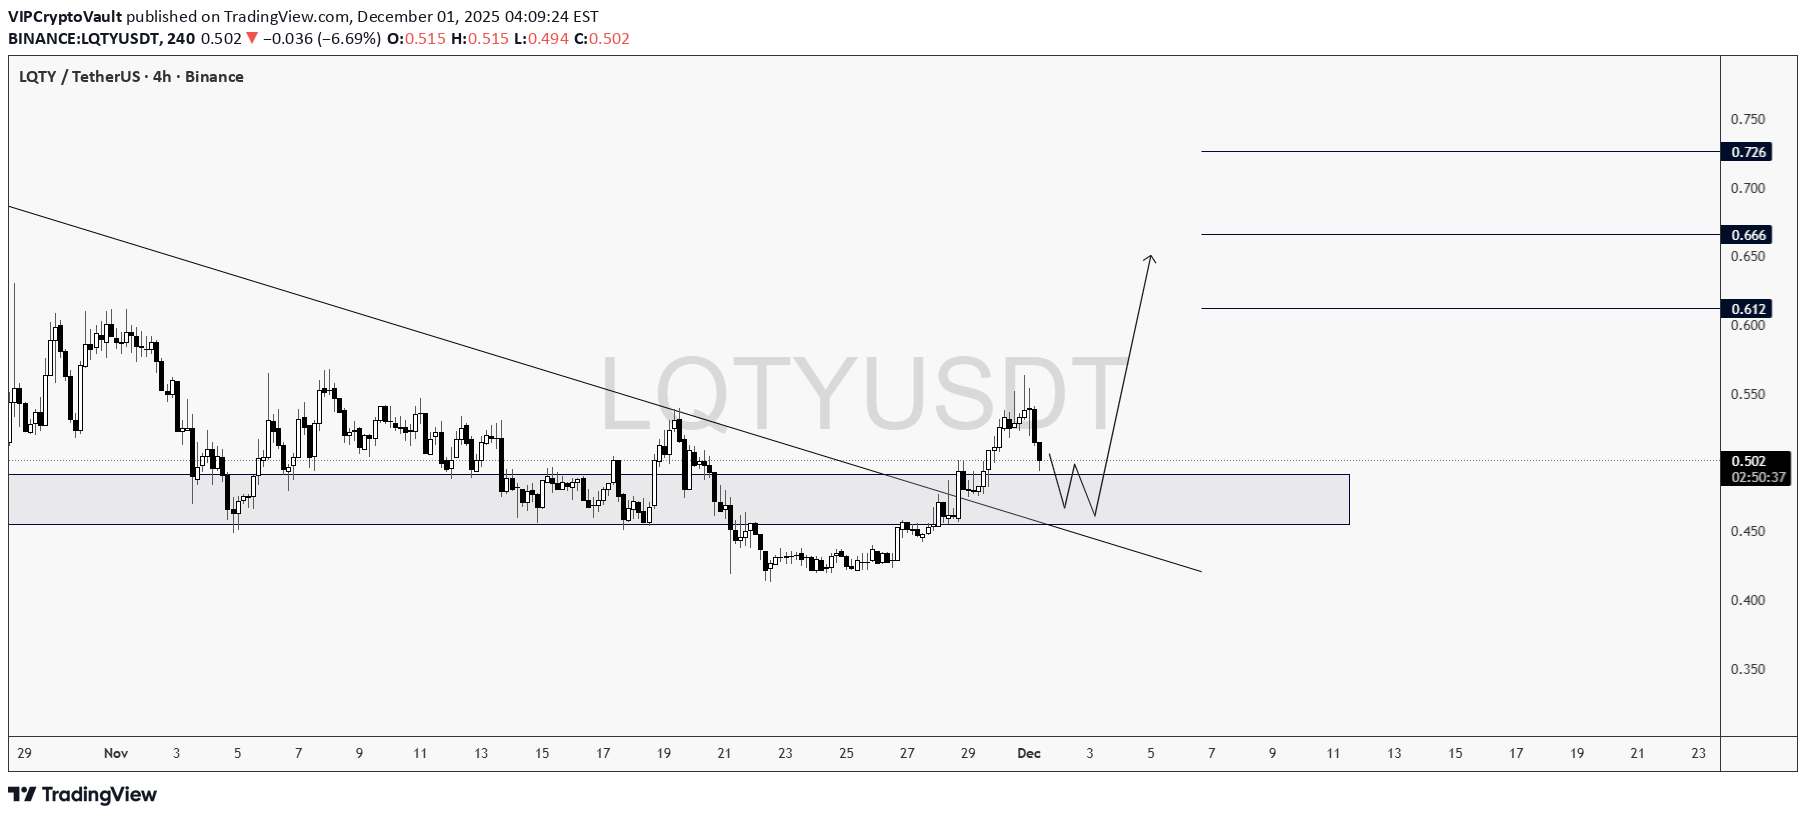
بنابراین، `LQTY` توانست روند نزولی چهار ماهه خود را در یک بازار خرسی بشکند، در حالی که تقریباً تمام جفتهای USDT دیگر در حال ریزش هستند. این نشاندهنده وجود مومنتوم (شتاب) بسیار خوبی است که میتواند قیمت را تا اهداف مشخص شده بالاتر ببرد. موفق باشید!

Bithereum_io
تحلیل روزانه LQTY: نشانههای صعود قوی و اهداف جذاب قیمت (آیا زمان خرید است؟)
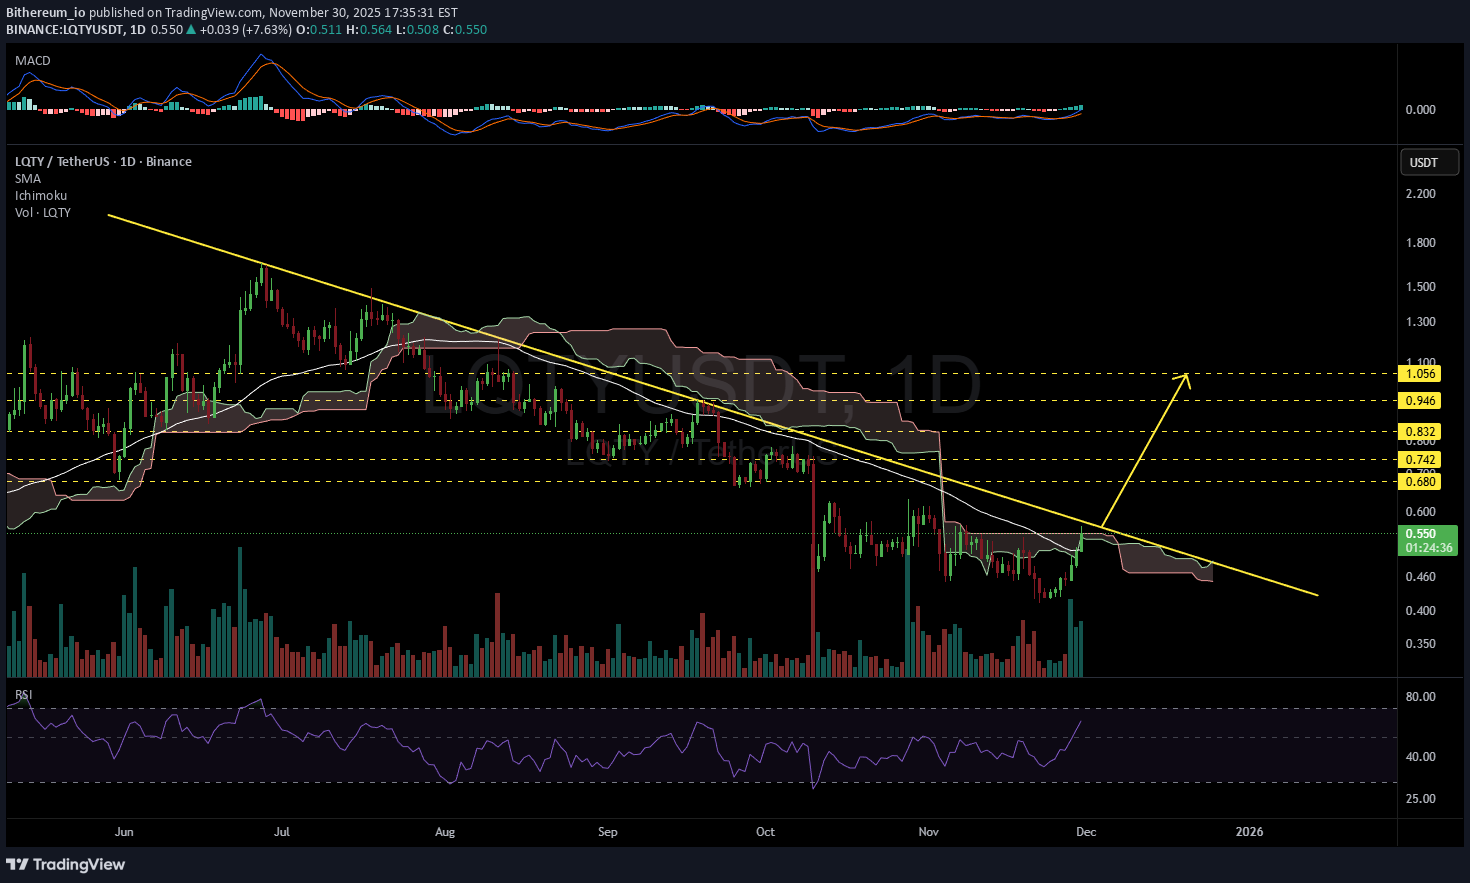
نمودار روزانه امیدوارکننده به نظر میرسد. RSI و MACD پتانسیل حرکت صعودی (مومنتوم گاوی) را نشان میدهند. قیمت موفق شده است از بالای SMA50 روزانه و ابر ایچیموکو عبور کند، اما کندل روزانه هنوز بسته نشده است. حجم معاملات افزایش یافته و قیمت به مقاومت نزولی رسیده است. ساختار کلی صعودی است. در صورت شکست موفقیتآمیز بالای مقاومت نزولی، اهداف احتمالی عبارتند از: 🎯 ۰.۶۸۰ دلار 🎯 ۰.۷۴۲ دلار 🎯 ۰.۸۳۲ دلار 🎯 ۰.۹۴۶ دلار 🎯 ۱.۰۵۶ دلار ⚠️ همیشه به یاد داشته باشید که با استفاده از حد ضرر (استاپلاس) مناسب و مدیریت ریسک منضبط، از سرمایه خود محافظت کنید.
TraderNoki
برنامه بلندمدت خرید $LQTY: ورود در ۰.۵۰ و حد ضرر ۰.۴۴۳
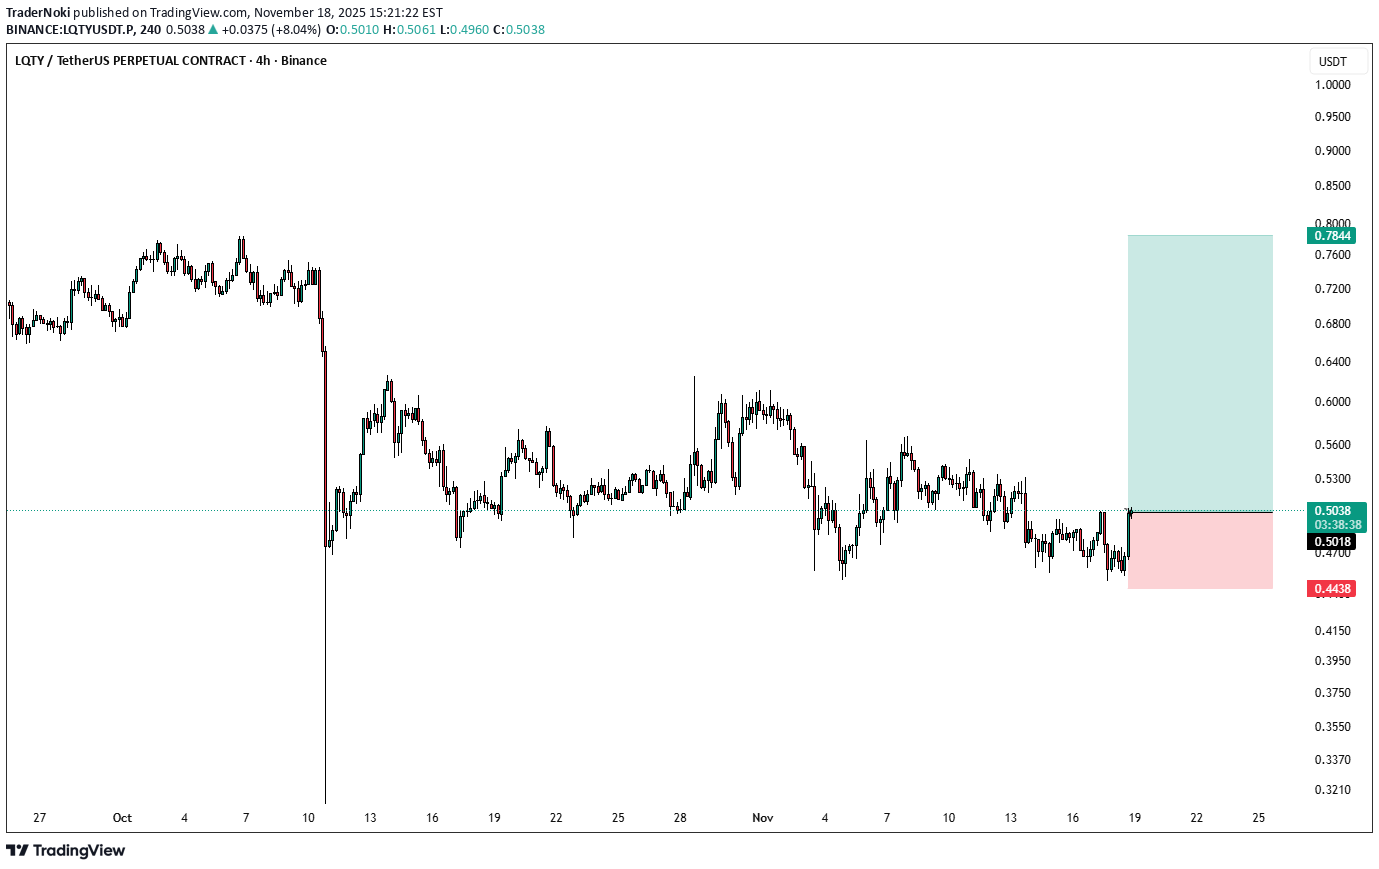
$LTQY طولانی رفتن ورودی 0.50 دلار و SL 0.443. مانند بسته شدن 4 ساعت در این سکه. 4.4٪. با وضعیت فعلی بازار، من توصیه می کنم که به شدت سود ببرید. من 40% tp گرفتم و SL breakevenClosed را بعد از 7% move تغییر دادم

incawarrior13
پیشبینی انفجار قیمت LQTY: زمان خرید (لانگ) فرا رسید!
آر اس آی (RSI) نزدیک کف قرار دارد. منتظر کندل بسته شدن هفتگی باشید. منتظر کراس (تقاطع) مکدی (MACD) بمانید. این رشد سریع بود، اما قطعاً اتفاق افتاد. همگرایی (تأیید) دیگر، شکست خط روند است. میانگینهای متحرک ۵۰، ۱۰۰ و ۲۰۰ (MA) را مد نظر داشته باشید. این شرایط برای کسب سودهای خوب مهیا است. همانطور که من میبینم، زیان زیادی متوجه شما نیست زیرا قیمت بیشتر از این پایین رفت.
Bithereum_io
تحلیل روزانه LQTY: آیا شکست مقاومت، قیمت را به مرز ۱.۳۱ دلار میرساند؟
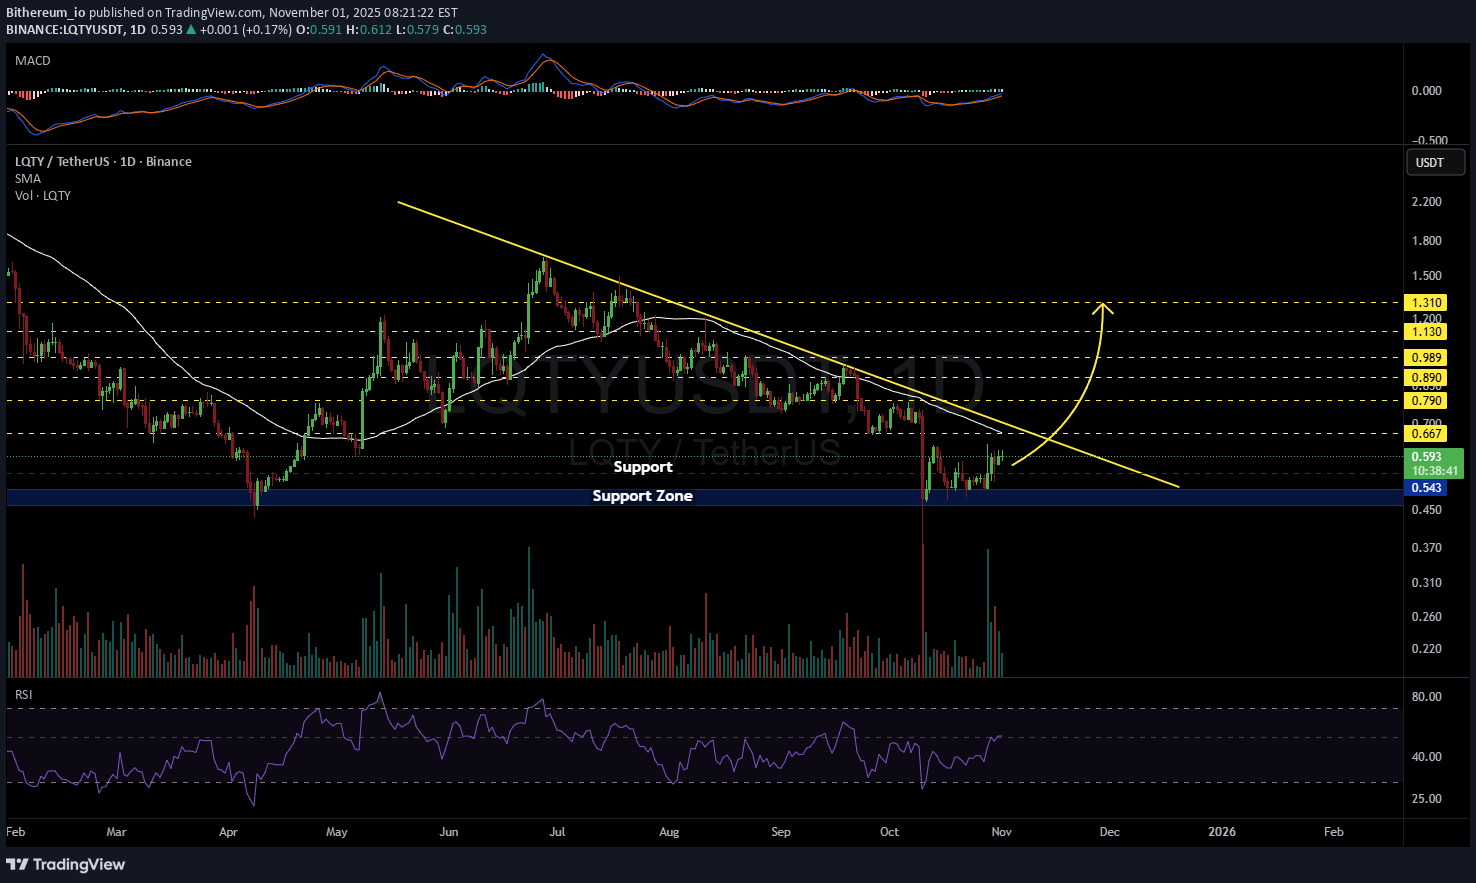
#LQTY در نمودار روزانه در حال حرکت به سمت مقاومت نزولی است، که با افزایش قابل توجهی در حجم معاملات همراه شده است. در صورت شکست (بریکاوت) از بالای SMA50 روزانه و مقاومت نزولی، اهداف صعودی بالقوه عبارتند از: 🎯 $0.667 🎯 $0.790 🎯 $0.890 🎯 $0.989 🎯 $1.130 🎯 $1.310 ⚠️ همیشه به یاد داشته باشید که از حد ضرر (استاپلاس) فشرده استفاده کنید و مدیریت ریسک مناسب را حفظ نمایید.

CryptoWithJames
تحلیل شگفتانگیز LQTY: احتمال جهش ۱۰۰ درصدی تا ۱.۱۱ دلار!
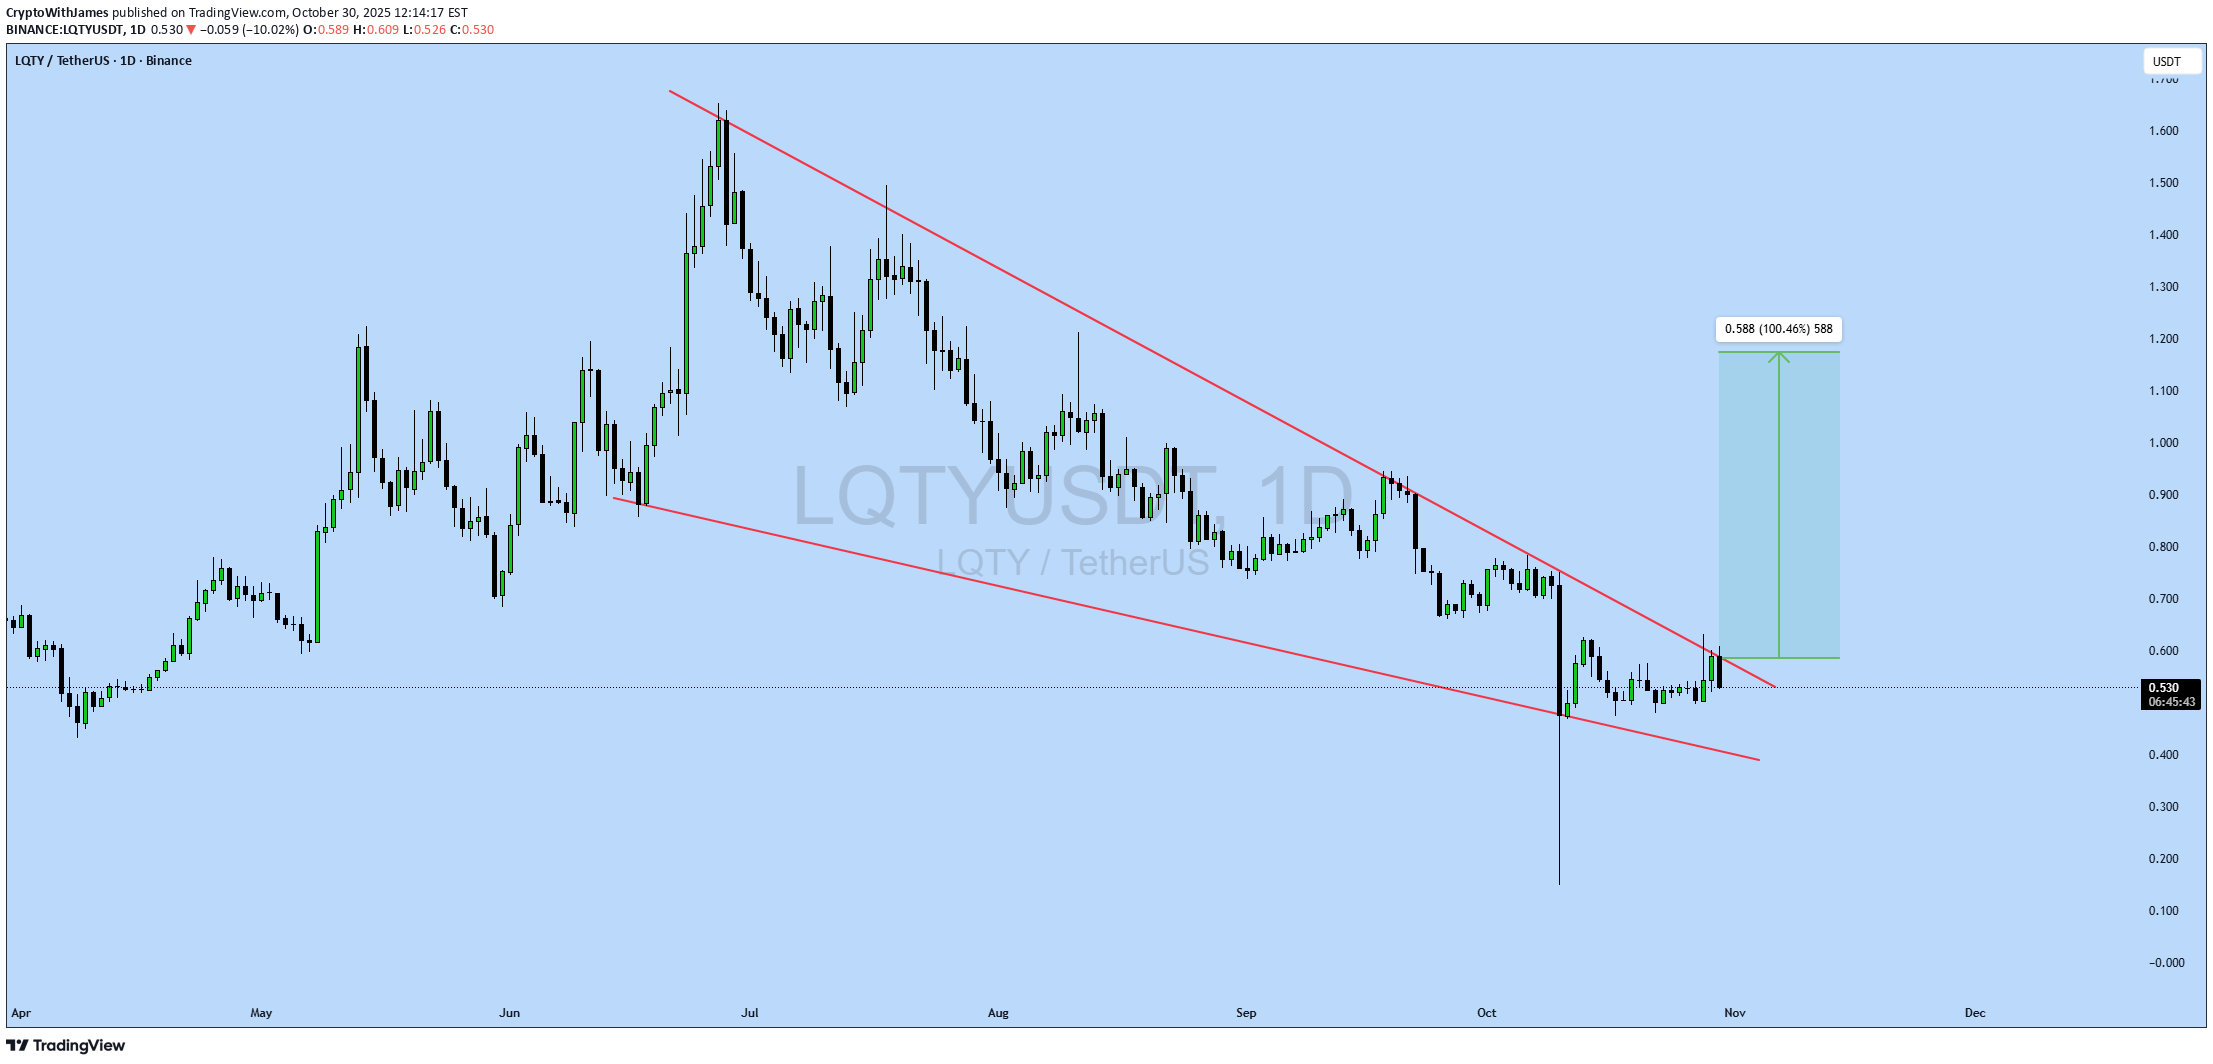
بهروزرسانی ۱. تنظیمات فنی الگو: الگوی گوه نزولی گاوی (صعودی) قیمت فعلی: ۰.۵۳۰ دلار قیمت هدف: ۱.۱۱۸ دلار درصد سود هدف: ۱۰۰.۴۶٪ نماد $LQTY در حال شکستن الگوی گوه نزولی گاوی در بازه زمانی ۱ روزه (1D) است. قیمت فعلی ۰.۵۳۰ دلار است و هدف پیشبینیشده نزدیک به ۱.۱۱۸ دلار میباشد که حدود ۱۰۰٪ پتانسیل رشد صعودی را ارائه میدهد. این شکست نشاندهنده افزایش شتاب صعودی (مومنتوم گاوی) و پتانسیل برای ادامه حرکت است. بازه زمانی: ۱ روزه (1D) نکته مدیریت ریسک: همیشه از مدیریت ریسک مناسب و اصولی استفاده کنید.

BandForBands
پیشبینی انفجاری LQTY: آیا فرصت سود 400 درصدی در راه است؟
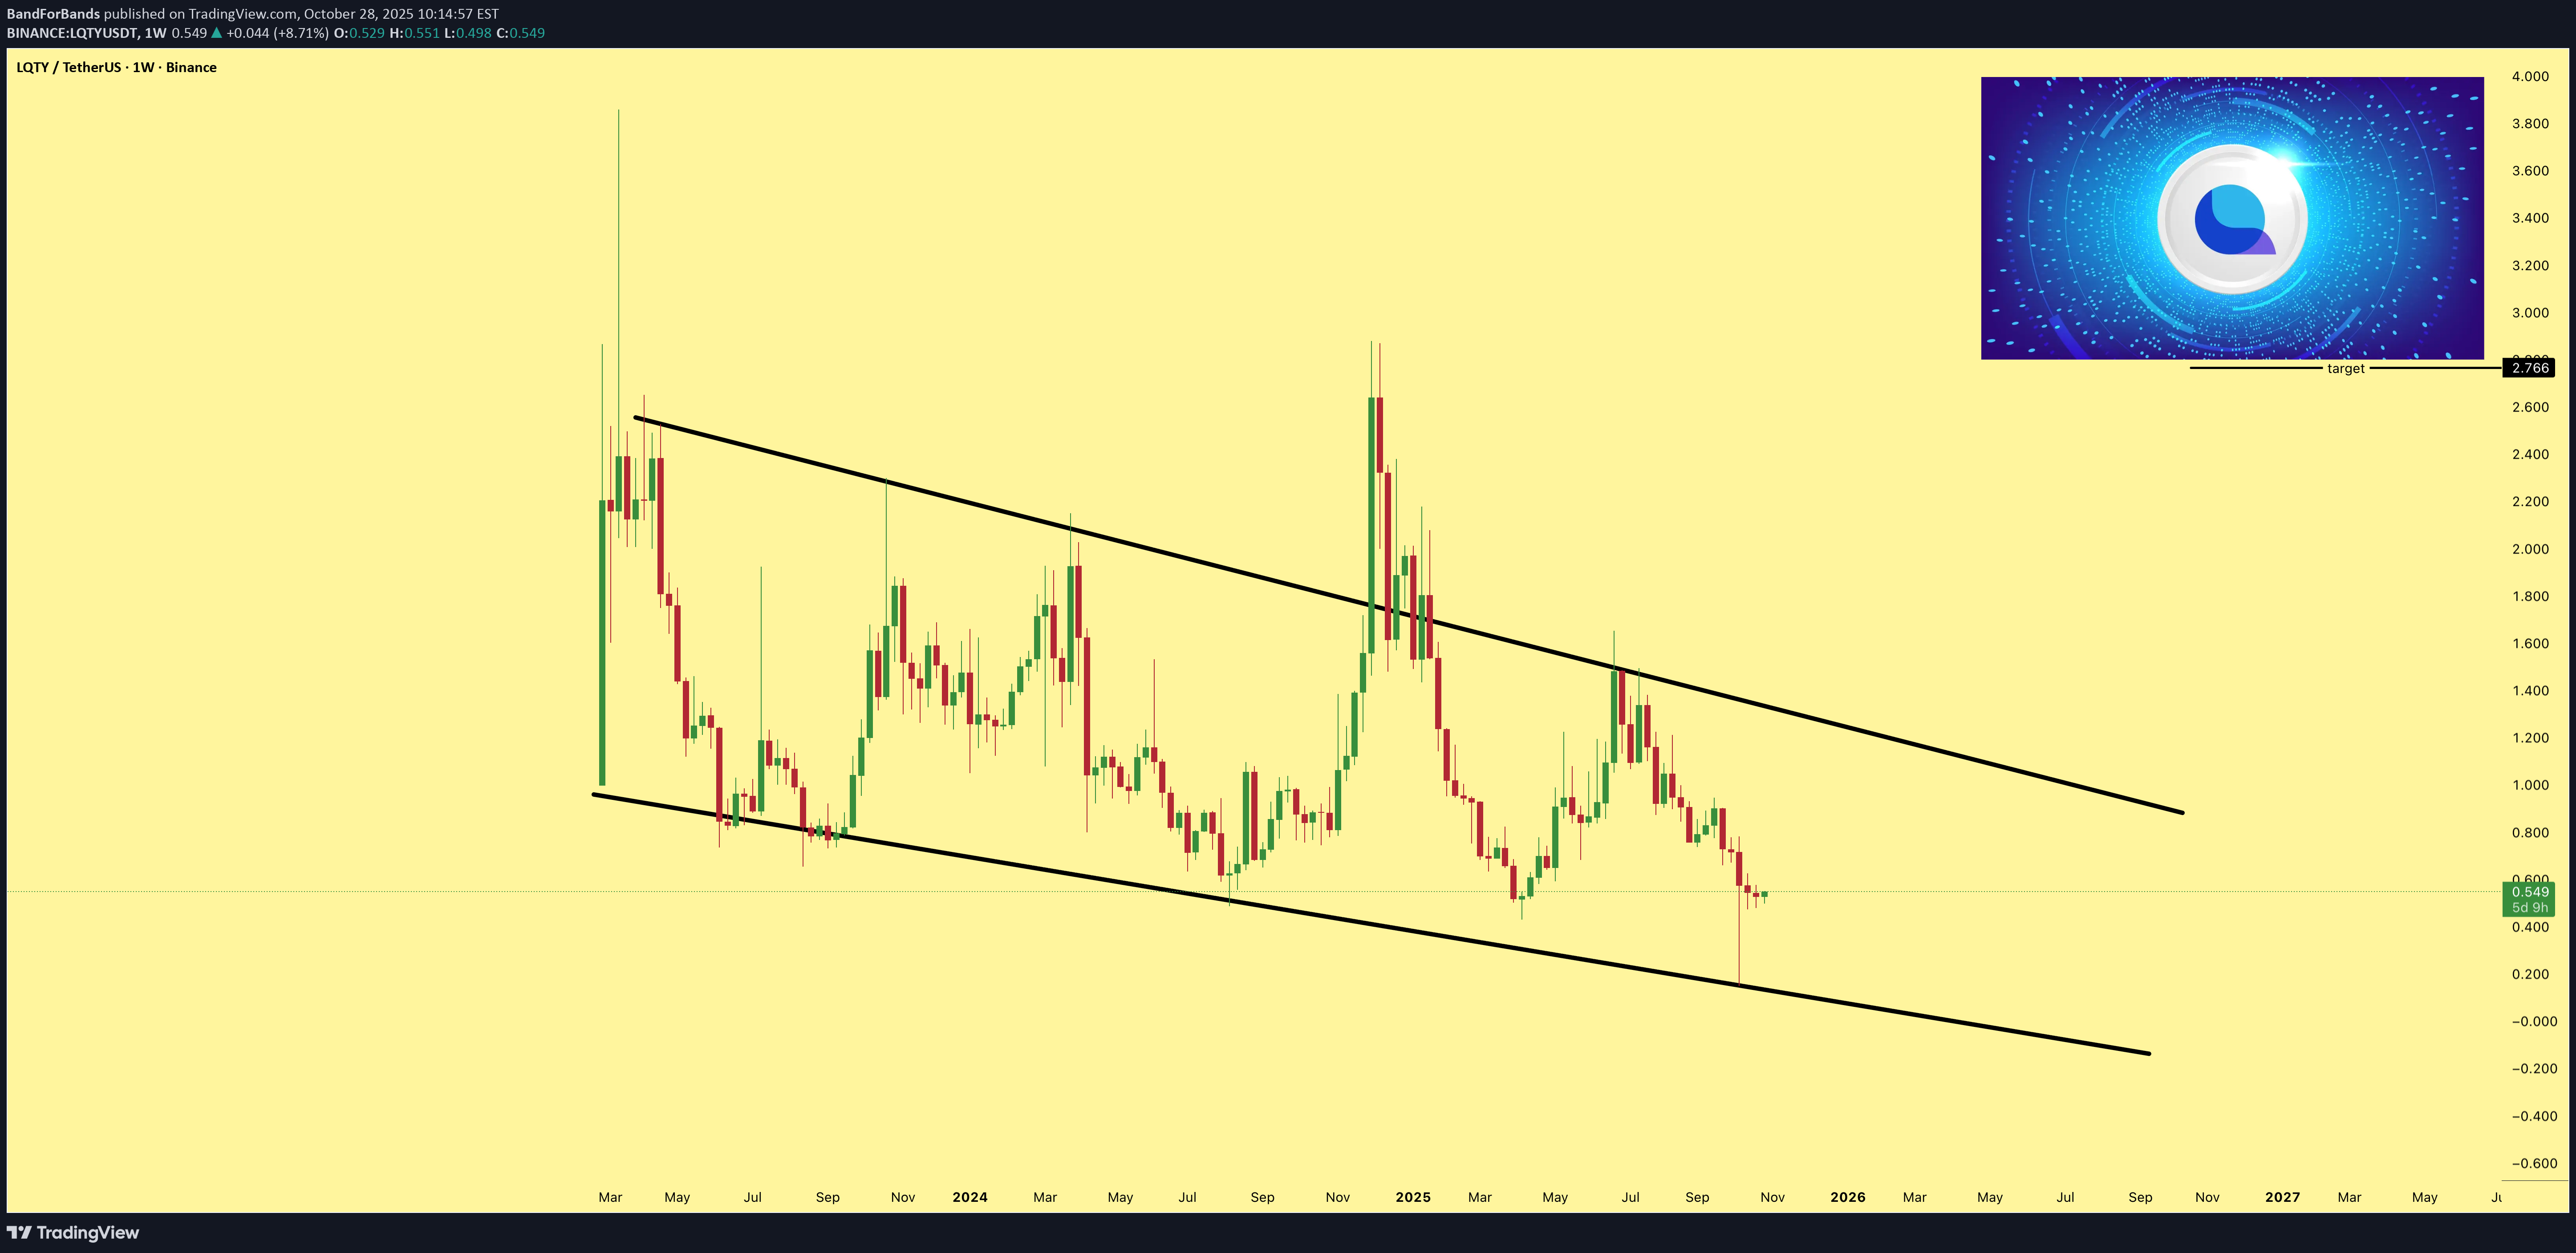
$LQTY در حال معامله شدن در یک الگوی کانال نزولی است و پتانسیل قوی برای تغییر روند صعودی (برگشت گاوی) از خود نشان میدهد. یک شکست تایید شده از خط روند بالایی میتواند منجر به رشدی تخمینی تا ۴۰۰ درصد نسبت به قیمت فعلی شود، که این امر توسط بهبود در اندیکاتورهای مومنتوم (تکانه) حمایت میشود.

Cryptojobs
$LQTY - price keep consolidating above main support & trend test
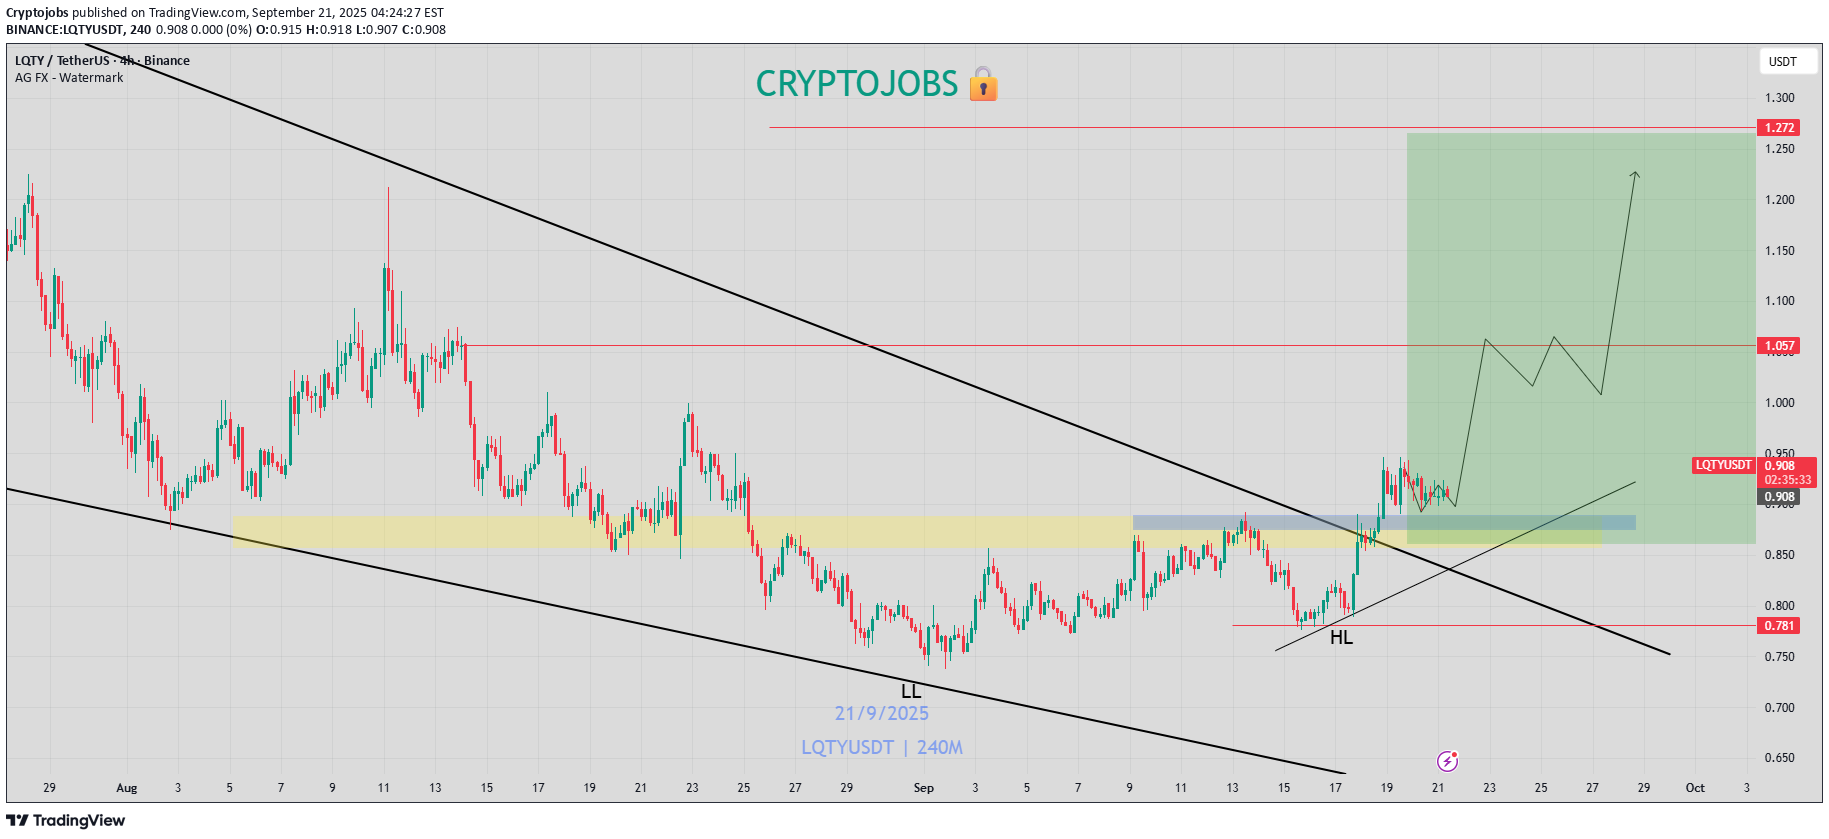
$LQTY - قیمت بالای حمایت اصلی در حال تثبیت شدنه و روند، تایم فریمهای بزرگ رو تست میکنه 📈 به نظر خوب میاد!📈
Cryptojobs
$LQTY - 90-Day Falling Wedge Breakout!
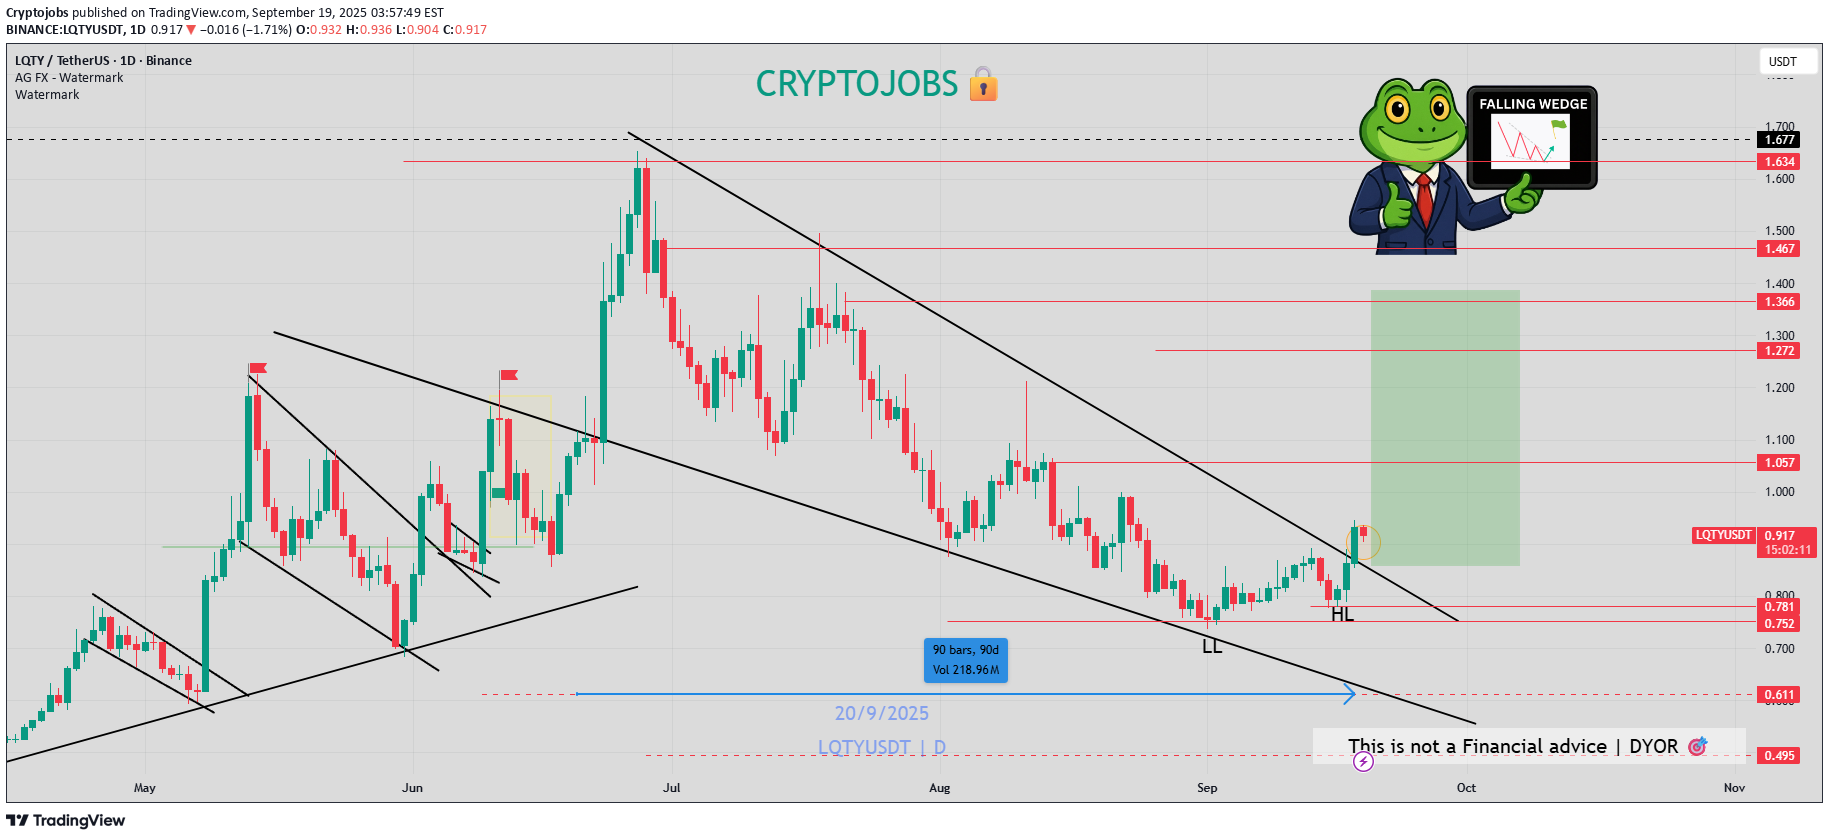
$LQTY - خروج از الگوی کنج نزولی ۹۰ روزه! ✅ پس از ۹۰ روز گیر افتادن در یک کنج نزولی، بالاخره شاهد خروج از الگو بودیم! 💥 آیا هفته آینده شاهد افزایش قیمت بود؟ 📈 برای اطلاعات بیشتر، ما را دنبال کنید. 🐸
سلب مسئولیت
هر محتوا و مطالب مندرج در سایت و کانالهای رسمی ارتباطی سهمتو، جمعبندی نظرات و تحلیلهای شخصی و غیر تعهد آور بوده و هیچگونه توصیهای مبنی بر خرید، فروش، ورود و یا خروج از بازارهای مالی نمی باشد. همچنین کلیه اخبار و تحلیلهای مندرج در سایت و کانالها، صرفا بازنشر اطلاعات از منابع رسمی و غیر رسمی داخلی و خارجی است و بدیهی است استفاده کنندگان محتوای مذکور، مسئول پیگیری و حصول اطمینان از اصالت و درستی مطالب هستند. از این رو ضمن سلب مسئولیت اعلام میدارد مسئولیت هرنوع تصمیم گیری و اقدام و سود و زیان احتمالی در بازار سرمایه و ارز دیجیتال، با شخص معامله گر است.