
Magic_xD
@t_Magic_xD

What symbols does the trader recommend buying?
Purchase History
پیام های تریدر
Filter
Magic_xD
Gold Price Hits the 1.618 Fibonacci Extension – What’s Next?
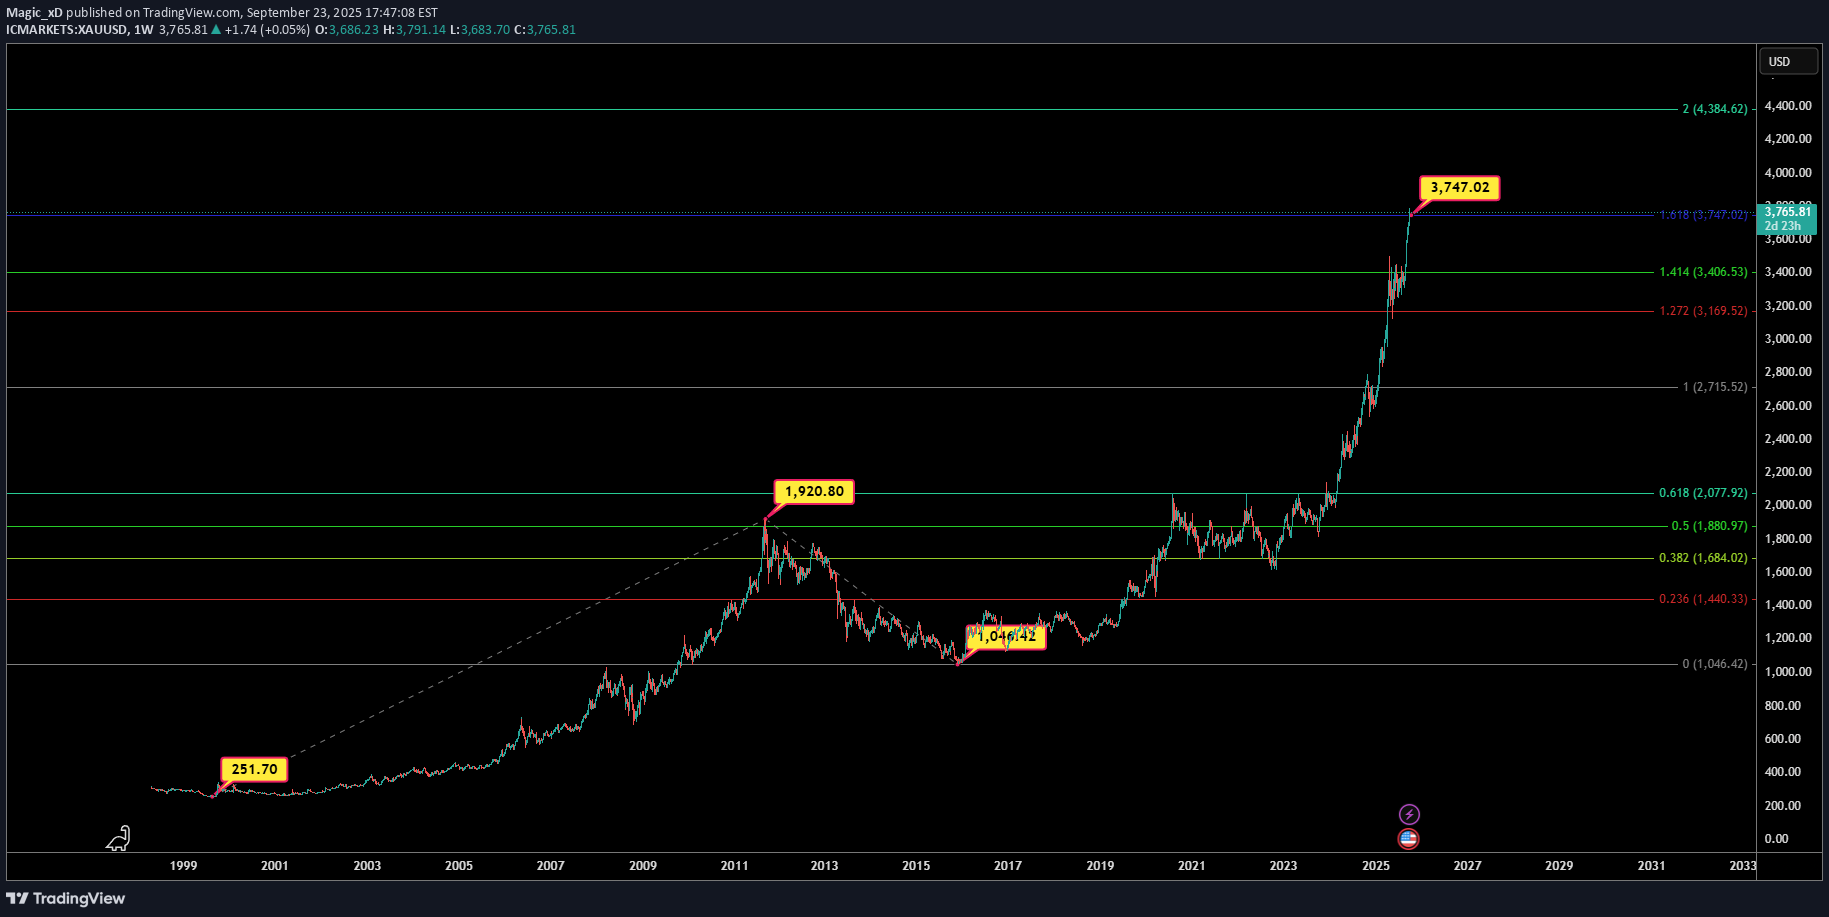
Long-Term Fibonacci Extension Analysis This chart represents a multi-decade view of price action using Fibonacci retracements and extensions to identify long-term support and resistance zones. Key Points in History: The base started around 251.70 (late 90s). The first major rally peaked near 1,920.80 (2011). This was followed by a significant correction down to 1,046.42 (2015–2016). Current Structure: Using this range (251.70 → 1,920.80 → 1,046.42), Fibonacci projections give us long-term targets. The market has now completed an extraordinary rally and touched the 1.618 Fibonacci extension at 3,747.02. This level is often considered a major take-profit or reversal zone, so caution is warranted. Support Zones: If the price starts to retrace, important Fibonacci levels to watch are: 2,715.52 (1.0 extension) – first strong support. 2,077.92 (0.618 retracement) – historically strong golden ratio. 1,880.97 (0.5 retracement) – psychological round number support. 1,684.02 (0.382 retracement). 1,440.33 (0.236 retracement) – deep correction level. Upside Potential: If the market maintains its bullish momentum and closes above the 1.618 level (3,747) with strength, the next Fibonacci extension points to the 2.0 level at 4,384.62 as the next long-term target. Conclusion The market is currently sitting at a critical juncture – the 1.618 Fibonacci extension. Traders should monitor price action carefully here: a rejection could trigger a multi-month correction, while a breakout may unlock further upside potential toward 4,384.
Magic_xD
ADA/USDT Break Through?
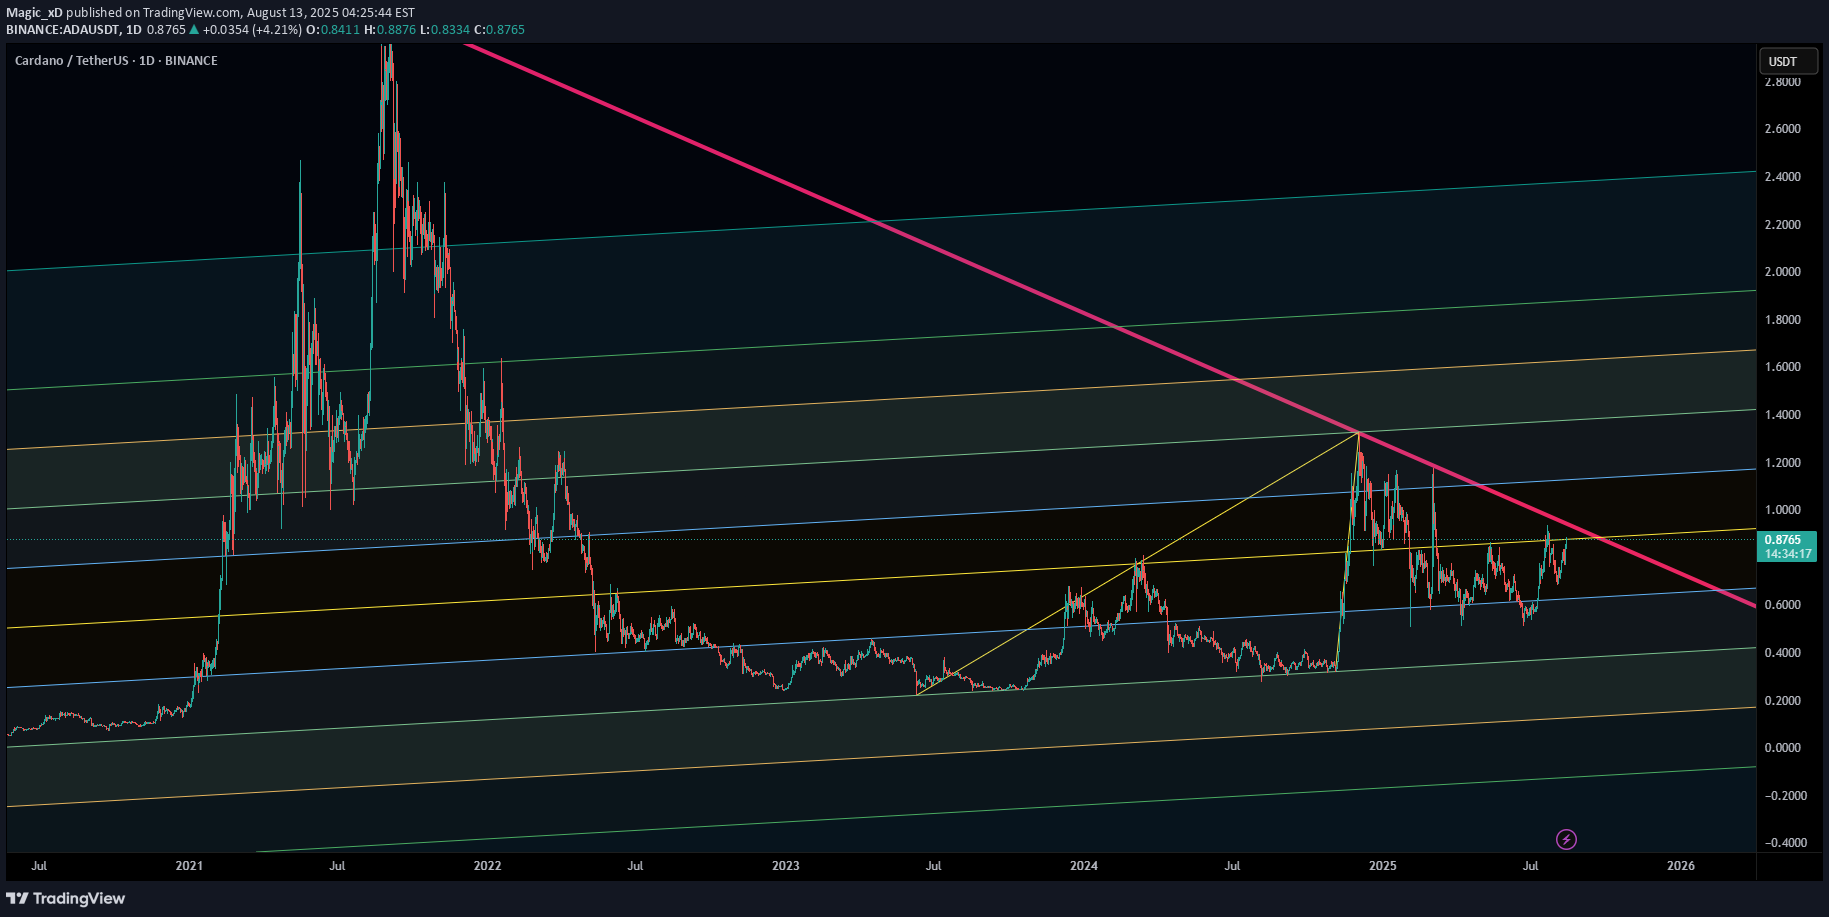
The ADA/USDT chart shows the price currently around 0.878, testing a long-term downtrend line (pink) extending from the 2021 all-time high. The price is moving within colored Fibonacci channels and is now near the upper boundary of its current channel. A breakout above the downtrend could open targets toward 1.00 and 1.40, while a rejection could send the price back to test support levels around 0.66 – 0.60.
Magic_xD
Gold XAUUSD – Gann Analysis & Market Outlook
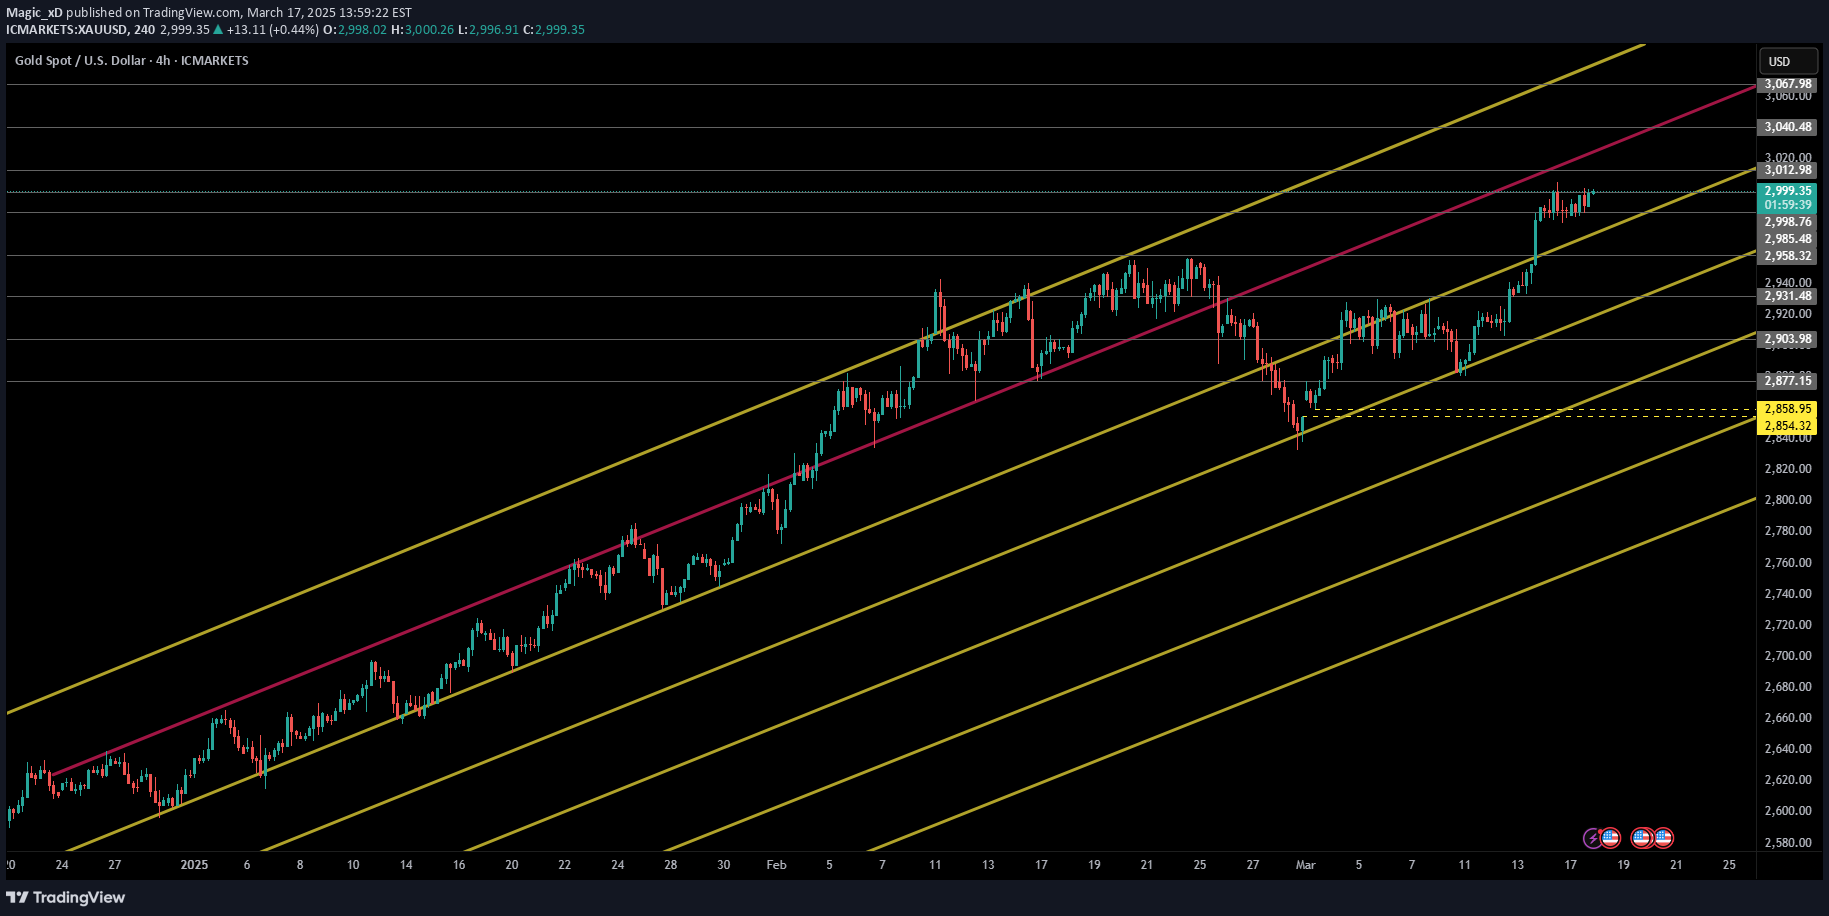
# **📊 Gold (XAU/USD) – Gann Analysis & Market Outlook** ## **🔎 Market Overview:** Gold is currently trading around **$2,999.84**, testing the **765° Gann level ($2,985.4)** as resistance. The price has shown strong bullish momentum, breaking past multiple resistance levels and now approaching **the psychological level of $3,000**. The **810° Gann level ($3,012.8)** is the next key resistance, and a breakout above it could signal further gains. However, if gold faces rejection, a retest of the lower Gann levels is possible. --- ## **📈 Key Gann Levels & Their Implications:** 🔹 **Immediate Resistance:** - **810° – $3,012.8**: Key resistance level; a break above it may confirm further upside momentum. - **855° – $3,040.3**: If bullish momentum continues, this level could act as a short-term target. - **900° – $3,067.9**: A strong resistance zone where profit-taking may occur. 🔹 **Immediate Support:** - **765° – $2,985.4**: Price is currently testing this level; if it holds, buyers may push the price higher. - **720° – $2,958.1**: A potential pullback zone where buyers may step in again. - **675° – $2,931.0**: If price drops further, this level could act as a strong support area. 🔹 **Major Support Levels:** - **630° – $2,904.0**: A breakdown below this could shift momentum bearish. - **585° – $2,877.1**: Critical support, where a failure to hold may lead to deeper corrections. - **540° – $2,850.4**: Strong demand zone; if price reaches here, it could provide a buying opportunity. --- ## **🚀 Potential Market Scenarios:** ### **🟢 Bullish Case (Breakout Scenario):** ✔ If price **breaks and holds above $3,012.8 (810° level)**, it could confirm further upside momentum. ✔ Next targets would be **$3,040 (855° level)** and possibly **$3,067 (900° level)** if gold remains strong. ✔ This scenario would require **higher trading volume** and a weaker USD or inflation concerns boosting gold demand. ### **🔴 Bearish Case (Pullback Scenario):** ❌ If gold fails to break **$3,012** and faces rejection, a pullback toward **$2,958 (720° level)** is possible. ❌ A deeper correction could bring price to **$2,904 (630° level)** or even **$2,850 (540° level)** if bearish momentum accelerates. ❌ This scenario could be triggered by **stronger USD, bond yields rising, or profit-taking at these levels**. --- ## **⚠️ Key Takeaways:** 📍 Gold is testing **critical resistance ($3,000 - $3,012)** and needs a breakout to confirm a further rally. 📍 Bulls must **clear $3,012** to target **$3,040+**; failure to do so may lead to a pullback. 📍 Supports to watch: **$2,985, $2,958, and $2,904** in case of rejection. 💬 **What’s your bias—bullish or bearish? Let me know your thoughts! 🚀📉** #Gold #XAUUSD #GannAnalysis #Trading #TechnicalAnalysis 💰Gold Almost Touched the 3040 ;) GG Expecting Deep correction from 3038 - 3082 rangeNote the Trend touch and the Level 2998.76 That touch Turned the price as you can see. RePlay this chart todayThat Channel again! Amazing Resistance of upper Boundary and Support and the Lower .. Hope u like the chart.
Magic_xD
Most Important EthUSDT Chart you need to see.

Hello Dear, The Gann chart, attributed to the legendary trader W.D. Gann, is a powerful tool for predicting price levels and time cycles. While it may seem complex initially, mastering its principles can give traders a significant edge. This article will break down the basics of the Gann chart and provide you with actionable tricks to incorporate it into your trading strategy. What is a Gann Chart? A Gann chart combines price and time to identify key levels of support, resistance, and potential trend changes. Gann's theory is based on the concept that price and time move harmoniously. By plotting geometric angles and price levels on the chart, traders can identify critical points where the market is likely to react. The chart shown here overlays key angles and levels, such as: 0° (Base Level): Starting point for calculations. 90°, 180°, 270°, and 360°: Significant price levels derived from Gann’s geometric principles. These levels serve as both support and resistance zones, depending on the market trend. 📊 Interpreting the Chart 1️⃣ Key Levels to Watch 🔹 Support Zones: $2,596 – First strong support level. $2,346 – If the price drops further, expect buyers here. $2,117 – A major demand zone. If ETH reaches this level, expect a strong reaction. 🔹 Resistance Zones: $2,858 – Current price level; breaking above could push ETH higher. $3,128 – Next key resistance level; breaking this confirms a bullish trend. $3,415 - $3,713 – Strong resistance area; ETH needs momentum to break through. $4,024 - $4,345 – If the rally continues, these are the next upside targets. ⏳ Time Cycles & Trend Shifts The chart also shows Gann time cycles (vertical lines), which help predict possible trend shifts. Based on the setup: 🔸 ETH has recently bounced from a key support level, suggesting a possible trend reversal. 🔸 If ETH maintains momentum, we could see a push toward $3,128 soon. 🔸 However, if it fails to hold above $2,596, it might revisit lower support zones. 📈 How to Trade This Setup? ✅ Bullish Scenario: If ETH breaks above $2,858, look for a move toward $3,128 - $3,415. A breakout above $3,713 could trigger a strong rally toward $4,024+. ❌ Bearish Scenario: If ETH fails to hold $2,596, expect a drop toward $2,346 or even $2,117. Losing $2,117 could open the door for deeper correction. 🔎 Final Thoughts Ethereum is at a crucial decision point. If bulls can break above $2,858, we might see an exciting rally. But if ETH struggles, lower support levels could come into play. What do you think? Bullish or Bearish? Let’s discuss! 🔥👇
Magic_xD
Bitcoin (BTC/USDT) Gann Analysis

Hello dear traders, Bitcoin where to? 📌 Current Market Status: BTC is trading at $96,480, up +9.43% from the previous move. The price is currently near the 180° Gann level at $95,316, acting as an important pivot zone. Key Support & Resistance Levels (Based on Gann Grid): 🟢 Support Levels: 1️⃣ $95,316 (180° Gann Level) → If held, BTC may consolidate before another move up. 2️⃣ $92,266 (90° Gann Level) → Strong demand area; loss of this level may trigger a deeper correction. 3️⃣ $89,285 (0° Gann Level) → The lowest major support, likely to provide a strong bounce if reached. 🔴 Resistance Levels: 1️⃣ $98,434 (270° Gann Level) → Immediate resistance; breaking above it could fuel bullish momentum. 2️⃣ $101,621 (360° Gann Level) → Major resistance; BTC needs to flip this level to confirm an uptrend continuation. 3️⃣ $108,097 (540° Gann Level) → If BTC pushes through, it could target new highs around $114,745. Market Outlook & Potential Scenarios: ✅ Bullish Scenario: Holding above $95,316 could lead to a push towards $98,434 and $101,621. A breakout above $101,621 might confirm a move towards $108,097. ❌ Bearish Scenario: If BTC loses $95,316, we may see a drop toward $92,266. Losing $92,266 could trigger a retest of the $89,285 support. 🚀 Final Thoughts: BTC is currently at a crucial decision point! A breakout above $98,434 could lead to a strong bullish continuation, while a breakdown below $95,316 may bring more downside pressure. What do you think? Will BTC push higher or correct down? 🤔
Magic_xD
Major (USDT) – Gann Levels Analysis & Possible Scenarios

Hello dear traders, you deserve an update to the previous chart here Update: The pair is currently trading around $0.1931, consolidating within a range-bound structure after a sharp downtrend. The price is hovering near the 540° Gann level ($0.1972) and 570° Gann level ($0.1532), forming a potential accumulation zone. This setup suggests that the market is in a decision phase, awaiting a catalyst to either break out or continue the downward momentum. Let’s analyze the key Gann levels and what they indicate. 📈 Key Gann Levels & Their Implications: 🔹 Immediate Resistance: 540° – $0.1972: A critical level that price is currently testing. A breakout above it may confirm bullish momentum. 510° – $0.2468: If price reclaims this level, we could see a trend reversal toward higher targets. 🔹 Major Resistance Levels: 480° – $0.3020: A strong historical resistance zone, breaking above this may trigger a larger rally. 450° – $0.3624: Psychological resistance; clearing this level could confirm a medium-term uptrend. 🔹 Immediate Support: 570° – $0.1532: A crucial demand zone where buyers previously stepped in. Holding above it could prevent further decline. 600° – $0.1147: A break below $0.1532 may bring this level into focus. 🔹 Final Support Zone: 630° – $0.0818: This would be a major breakdown level if bearish momentum accelerates. 🚀 Potential Market Scenarios: 🟢 Bullish Case: If price breaks and holds above $0.1972 (540° Gann level), it could trigger a move toward $0.2471 (510° level). A confirmed breakout above $0.3020 (480° level) may accelerate a bullish trend towards $0.3624 and beyond. This scenario would likely require increased buying volume and a broader market recovery. 🔴 Bearish Case: Failure to hold $0.1972 could push price back to $0.1532 (570° Gann level), where buyers may attempt to stabilize. A break below $0.1532 could lead to further downside towards $0.1147 (600° level). If selling pressure persists, $0.0818 (630° level) would be a worst-case scenario, marking a deep decline. ⚠️ Key Takeaways: 📍 Price is stuck in consolidation, testing a critical decision level ($0.1972). 📍 Bulls need to reclaim $0.2468+ to confirm an uptrend. 📍 Bears will dominate if price loses $0.1532, risking further decline. 💬 What’s your outlook? Do you expect a breakout or another leg down? Drop your thoughts below! 🔥 #Crypto #USDT #GannAnalysis #Trading #TechnicalAnalysis 🚀
Magic_xD
The Doge Chart They Don’t Want You to See!

Hello Dear Traders, Previously Doge chart was published but for some Reasons they Hidden it.. violated House Rules ;( Here it is again . This chart uses Gann Fan levels to analyze price movements for Dogecoin (DOGE/USDT) on Binance. The yellow lines represent key Gann levels that can act as support and resistance zones. Key Observations: 1️⃣ Support Level at $0.20823 This level acted as a strong support where the price recently bounced. If the price drops again, this could be a critical level to watch for a potential reversal. 2️⃣ Resistance at $0.26366 (Current Zone) The price is currently testing this Gann level. A breakout above could push the price toward the next key resistance. 3️⃣ Next Major Resistance at $0.32506 If DOGE maintains momentum above $0.26366, the next significant resistance is $0.32506. A breakout above this level could trigger further upside movement. Possible Scenarios: 🔹 Bullish Case: If the price holds above $0.26366, we could see a rally toward $0.32506. A break above this would confirm strong bullish momentum. 🔹 Bearish Case: If the price gets rejected at this level, it may revisit $0.20823 for another test. 💡 Conclusion: DOGE is currently at a decision point. A breakout could lead to higher levels, while rejection might bring a retest of lower Gann levels. Final Note! Watch before this happens like previous: 🚀 What’s your take on this? Are you bullish or waiting for confirmation?
Magic_xD
TRUMP/USDT - Gann Analysis & Key Levels

TRUMP/USDT (Binance) - Gann Analysis & Key Levels 📊 Market Overview: TRUMP was able to break out from a descending trendline. The price recently touched a key support zone around $14.46 and is now showing some signs of recovery. 🔍 Technical Breakdown: Resistance Levels: $17.68 - First level of resistance $19.38 - Psychological resistance $23.07 - $27.08 - Strong resistance zone in case of a breakout Support Levels: $16.02 - Holding above this could confirm bullish momentum $14.46 - Key support; losing this level could trigger further downside 🚀 Potential Scenarios: 🟢 Bullish Case: If TRUMP maintains above $16.02, it could challenge $17.68, with a potential rally toward $19.38+. A confirmed breakout could push the price toward $23-$27 range. 🔴 Bearish Case: Failure to hold above $16.02 may lead to a retest of $14.46. If this level breaks, a deeper correction toward $12 could be expected. ⚠️ Key Takeaway: The trend is at a critical turning point. If bulls sustain momentum, a trend reversal could push TRUMP toward $20+ in the coming days. However, losing $16 support would weaken the bullish case. 💬 What’s your take? Will TRUMP break out or continue the downtrend? 🚀
Magic_xD
Gold Gann Analysis – Will the Bulls Keep Running?

Gold is on fire! 🔥 Currently trading around $2,919, the yellow metal is testing key Gann levels after an impressive bullish rally. The price recently broke above $2,901 (630° Gann level), showing strong momentum—so what’s next? Let’s break it down! 📊 Technical Breakdown: 🔹 Resistance Ahead: The next major hurdle is at $2,955 (720° Gann level). If we clear this zone, gold could aim for $3,000+ in the coming sessions. 🚀but that could be the top too! 🔹 Trend Strength: Price is respecting the ascending yellow channel, reinforcing the bullish trend. 📈 🔹 Key Support: Watch out for $2,847 (540° Gann level) and $2,794 (450° Gann level)—potential bounce zones if a pullback happens. 🏹 Potential Scenarios: 🟢 Bullish Case: Holding above $2,901 keeps the uptrend intact, with eyes on $2,955 and beyond. A clean breakout could send gold soaring past $3,000. 🚀 🔴 Bearish Case: Rejection from $2,955 and a break below $2,901 may lead to a dip toward $2,847 - $2,794. Losing these levels could push gold further down to $2,742 (360° Gann level). Above is Showing important Fib 1.618 Level on the chart "2946.53" Hard Resistance and Target! ⚠️ Key Takeaway: Gold remains strongly bullish, but we’re at a critical resistance zone. A breakout or rejection from $2,955 will determine the next big move! 📉📈 💬 What’s your take? Will gold smash through $2,955 and set new highs, or are we due for a pullback? Drop your thoughts below! ⬇️🔥 #Gold #XAUUSD #Trading #GannAnalysis #Forex 🚀Important to watch current 2865. could be good entry for long.Congrats2865 was That Channel too. Accuracy ;)Annnnnd the Channel Again ;) its Based on Gann not your classic channel that WHY! Nice?Hope you enjoyed that Chart. Reversed from Pre Decided level Exactly currently trying to find support at 2901 Sharp . if Closed below it, there is 2888 but wait chart purpose isn't over ;) check it again later.Updated here:lovely chart.Gold Still Respecting this Channel alright. Watch for price action around its borders .Watch for Support and reversal from 3066 - 3057 and watch to close 3093 - 3105 good luckCongrats ;D
Magic_xD
WIF - Waking up from the dead?

Hey traders! 🚀 Looks like WIF is testing a major support near 0.627 USDT, a critical Gann level. 🔹 Holding above could trigger a reversal towards 0.869 - 1.191 USDT 📈 🔹 A breakdown might lead to further weakness – watch for confirmations! -Seems like the chance to buy the hat at such cheap prices ^^ -Imho ^^, the worse is likely in and even if we get a pullback, we'll chop around near the lows. Price at a Strong Support Zone: The price is testing the 0.627 USDT level, which appears to be a key support in the Gann structure. This level could act as a potential reversal zone if buyers step in. 2️⃣ Bullish Scenario (Bounce from Support) If the price respects this support and starts forming bullish candles, we could see an upward move toward: 0.869 USDT (First resistance level) 1.191 USDT (A stronger resistance level and possible target) 3️⃣ Bearish Scenario (Breaking Support) If 0.627 USDT is broken to the downside, the price might continue dropping toward lower levels such as: 0.400 USDT or lower, based on the Gann structure's projections. 4️⃣ How to Confirm the Direction? Watch price action at this support level—if bullish reversal candles appear (like a hammer or bullish engulfing), it could signal a potential buy entry. If the price closes below the support with strong bearish momentum, it could confirm further downside movement. Watch for price action around the Gann grid lines works as your regular trend lines it gets better when u recheck the chart after a few weeks too! 💡 Conclusion: The price is at a critical level, so we need to monitor how it reacts here before deciding on the next move! 👀📉📈 🎯 What do you think? Are we going to see a bounce or more downside? 🤔💬
Disclaimer
Any content and materials included in Sahmeto's website and official communication channels are a compilation of personal opinions and analyses and are not binding. They do not constitute any recommendation for buying, selling, entering or exiting the stock market and cryptocurrency market. Also, all news and analyses included in the website and channels are merely republished information from official and unofficial domestic and foreign sources, and it is obvious that users of the said content are responsible for following up and ensuring the authenticity and accuracy of the materials. Therefore, while disclaiming responsibility, it is declared that the responsibility for any decision-making, action, and potential profit and loss in the capital market and cryptocurrency market lies with the trader.