Technical analysis by Magic_xD about Symbol PAXG on 9/23/2025

Magic_xD
Gold Price Hits the 1.618 Fibonacci Extension – What’s Next?
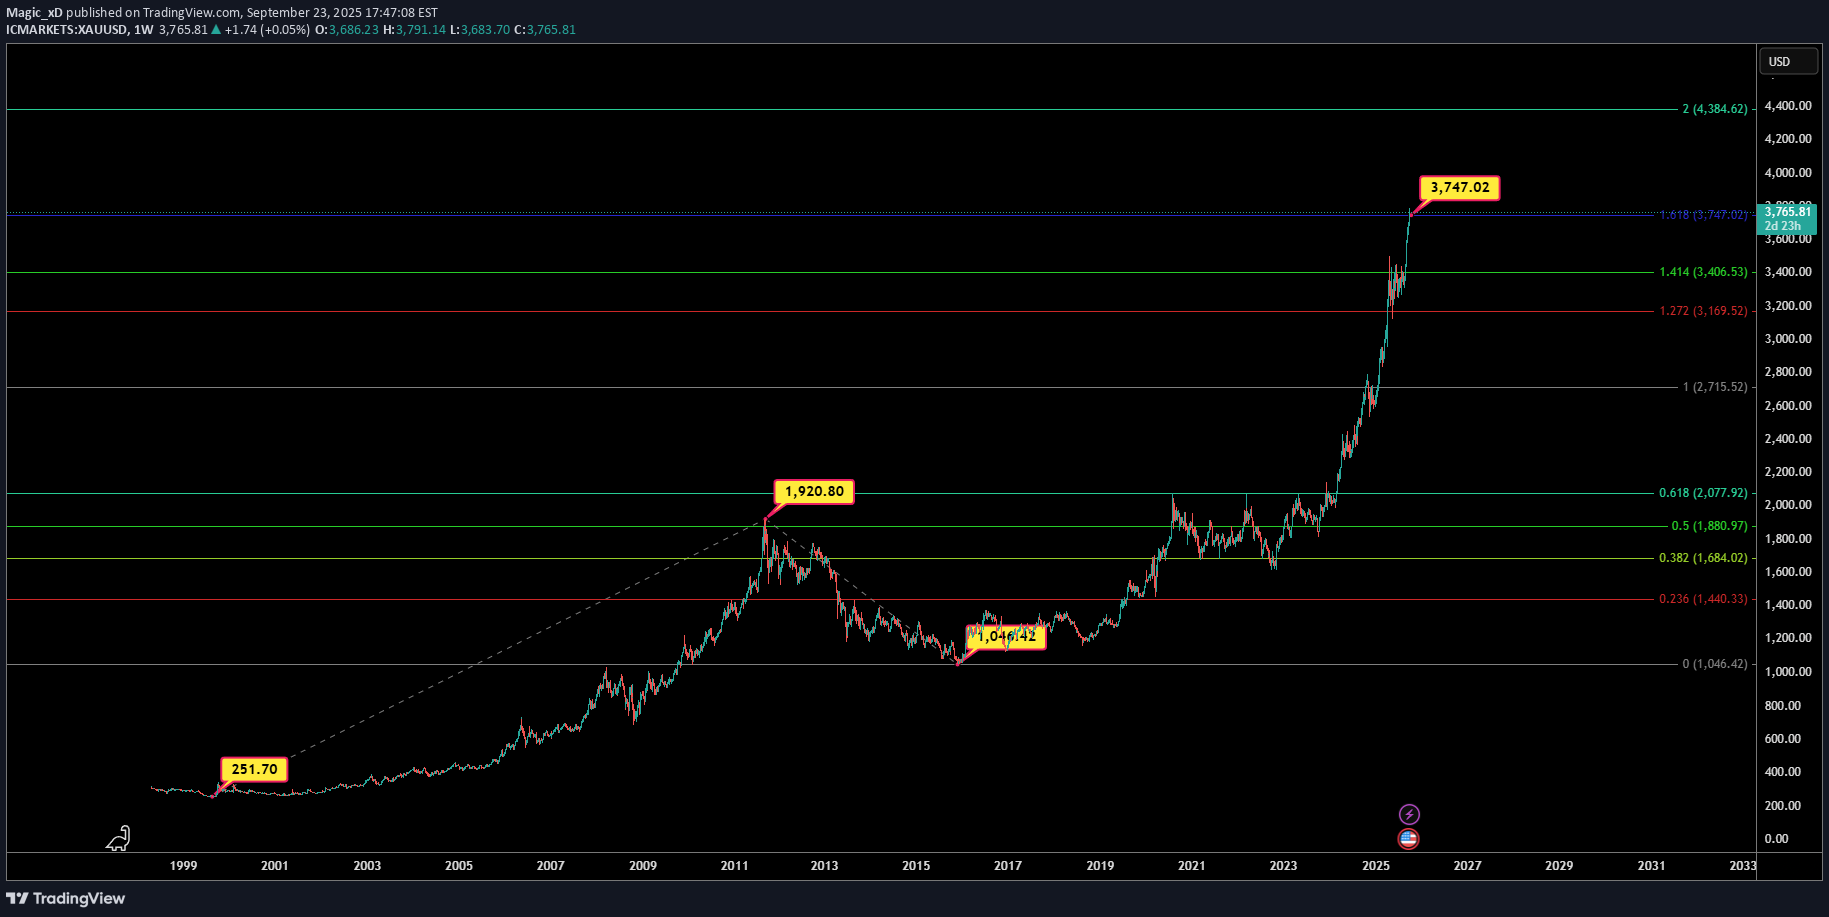
Long-Term Fibonacci Extension Analysis This chart represents a multi-decade view of price action using Fibonacci retracements and extensions to identify long-term support and resistance zones. Key Points in History: The base started around 251.70 (late 90s). The first major rally peaked near 1,920.80 (2011). This was followed by a significant correction down to 1,046.42 (2015–2016). Current Structure: Using this range (251.70 → 1,920.80 → 1,046.42), Fibonacci projections give us long-term targets. The market has now completed an extraordinary rally and touched the 1.618 Fibonacci extension at 3,747.02. This level is often considered a major take-profit or reversal zone, so caution is warranted. Support Zones: If the price starts to retrace, important Fibonacci levels to watch are: 2,715.52 (1.0 extension) – first strong support. 2,077.92 (0.618 retracement) – historically strong golden ratio. 1,880.97 (0.5 retracement) – psychological round number support. 1,684.02 (0.382 retracement). 1,440.33 (0.236 retracement) – deep correction level. Upside Potential: If the market maintains its bullish momentum and closes above the 1.618 level (3,747) with strength, the next Fibonacci extension points to the 2.0 level at 4,384.62 as the next long-term target. Conclusion The market is currently sitting at a critical juncture – the 1.618 Fibonacci extension. Traders should monitor price action carefully here: a rejection could trigger a multi-month correction, while a breakout may unlock further upside potential toward 4,384.