
Madoir
@t_Madoir

What symbols does the trader recommend buying?
Purchase History
پیام های تریدر
Filter
Madoir
پامپ عجیب ICP: راز 40 درصدی و فرصت فروش در مقاومت کلیدی!
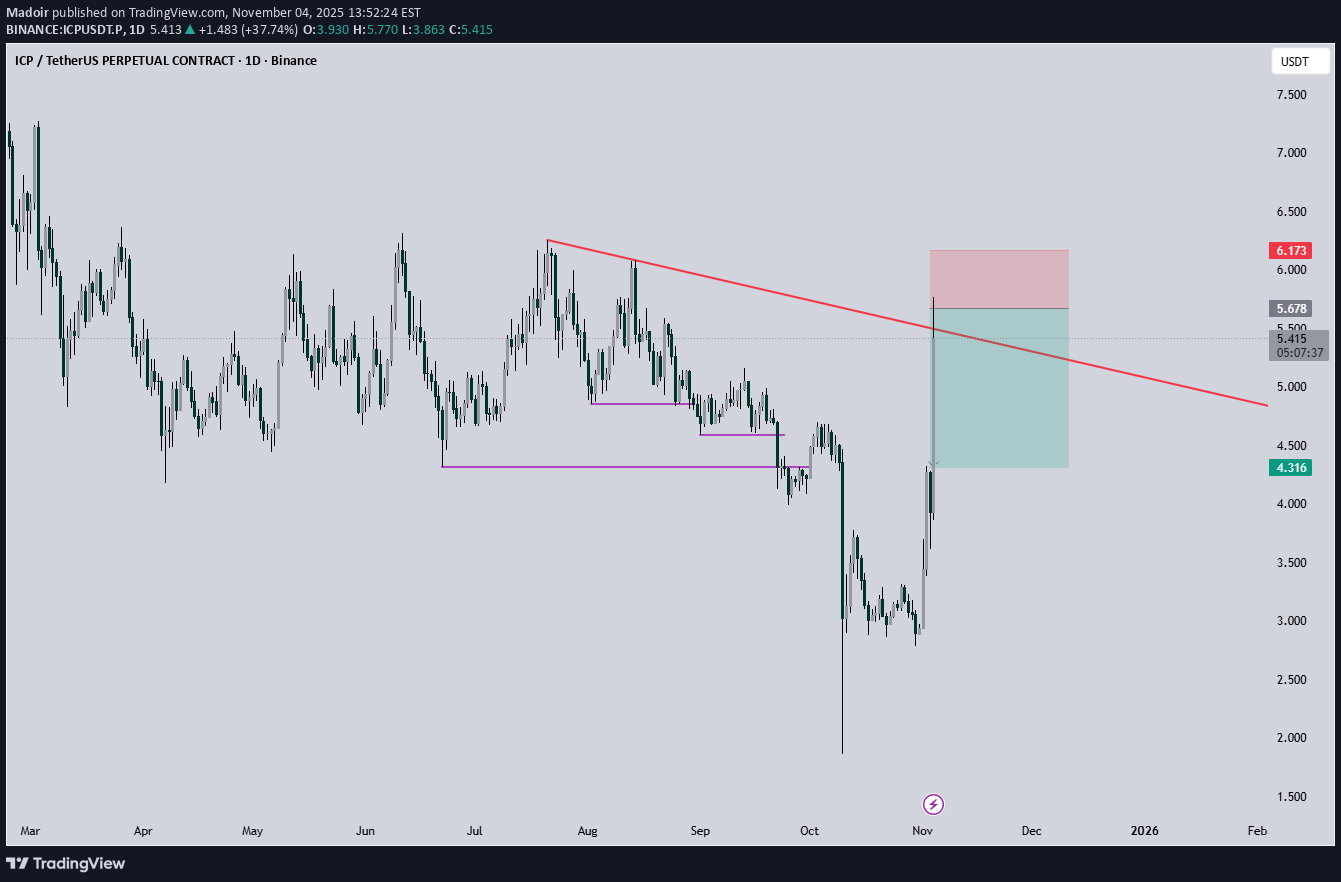
overall market is bearish nut ICPUSDT.P pumped 40% for no reason! we have a major resistance in this area and we can sell from this point at least now
Madoir
نوسان مرگبار بیت کوین کش (BCH): آیا سقوط به ۵۰۰ دلار قطعی است؟

Current BCHUSDT Market Status The current BCH market status is as follows: We previously had a strong bullish trendline that drove the price from $250 to $650. However, this structure has been broken, and it appears we have entered a ranging phase between $650 and $500, with the price oscillating between these two points multiple times. What's interesting is the old Fair Value Gap (FVG) at $500 to $525. It acted as a resistance multiple times, and after being broken, it has turned into a strong support. This strength can likely be attributed to the high number of attempts and retests it took to break through that initial resistance. Regarding a Short Position There are several reasons to consider a short position, at least down to the $500 level. These include the price ranging box, the market's inability to decisively break the $640 resistance, and other factors that are clearly visible on the chart. Please Note: This is not financial advice. Do your own research and only invest what you can afford to lose.
Madoir
Bitcoin Price Analysis and Prediction

In my opinion, $124k was the highest price BTCUSD would see in this cycle, and the downtrend has started a long time ago. The colored dots you see on the chart represent the main pivots of the weekly candles that were forming the bullish structure. Now we are seeing this structure being broken one after the other. You can see the key/legend for the colored dots on the chart. Current Situation Bitcoin broke the first weekly candle's Higher Low (HL) on August 22nd. Since then, we've seen a Lower Low (LL) and a Lower High (LH) on the weekly chart. Now, the price is moving back towards that LL to break this LOW and form a new LL. Last time, we saw good support at $107K and this area could be a support zone this time as well. However, the bearish structure has formed, and we will likely only face temporary reactions. In this area, we will either see the price range or a break of support and the start of a larger trend towards $85k. Please note that this is just my opinion and it could be completely wrong. Even if it is correct, it might take a long time, or perhaps we'll move towards it with a sharp move!
Madoir
AVAX SHORT
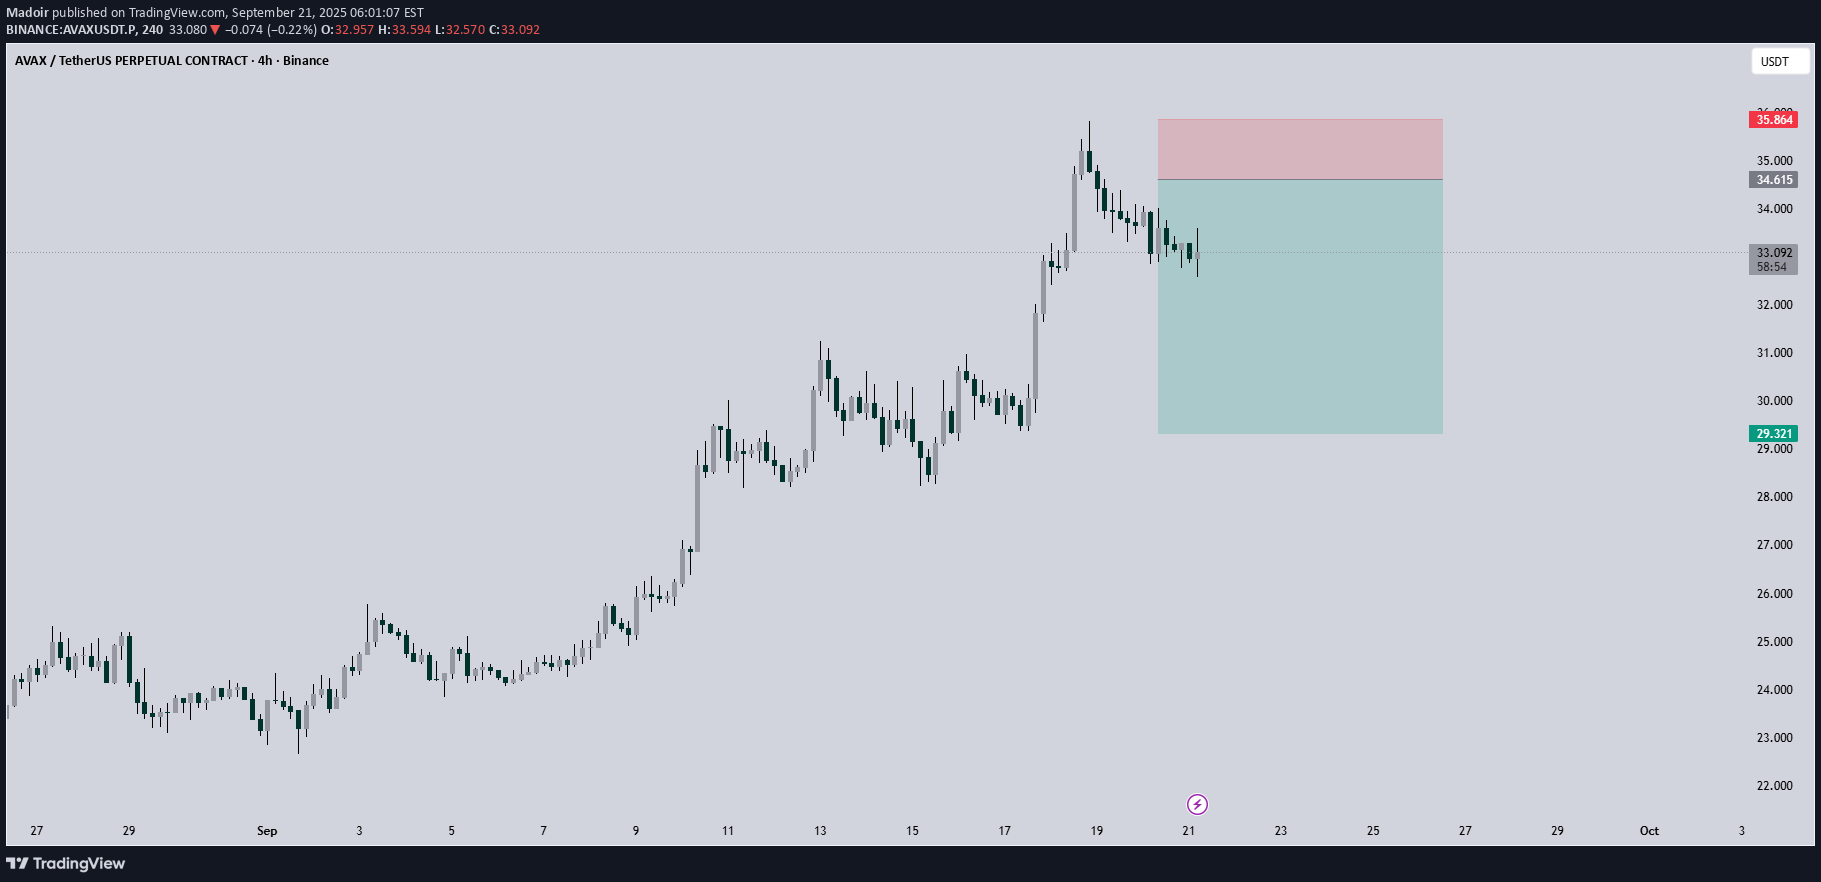
I'm taking this short position for AVAXUSDT.P . It's risky because it's near the top, and they can always eliminate the stop-loss with a shadow!
Madoir
LINK LONG AND SHORT IDEA
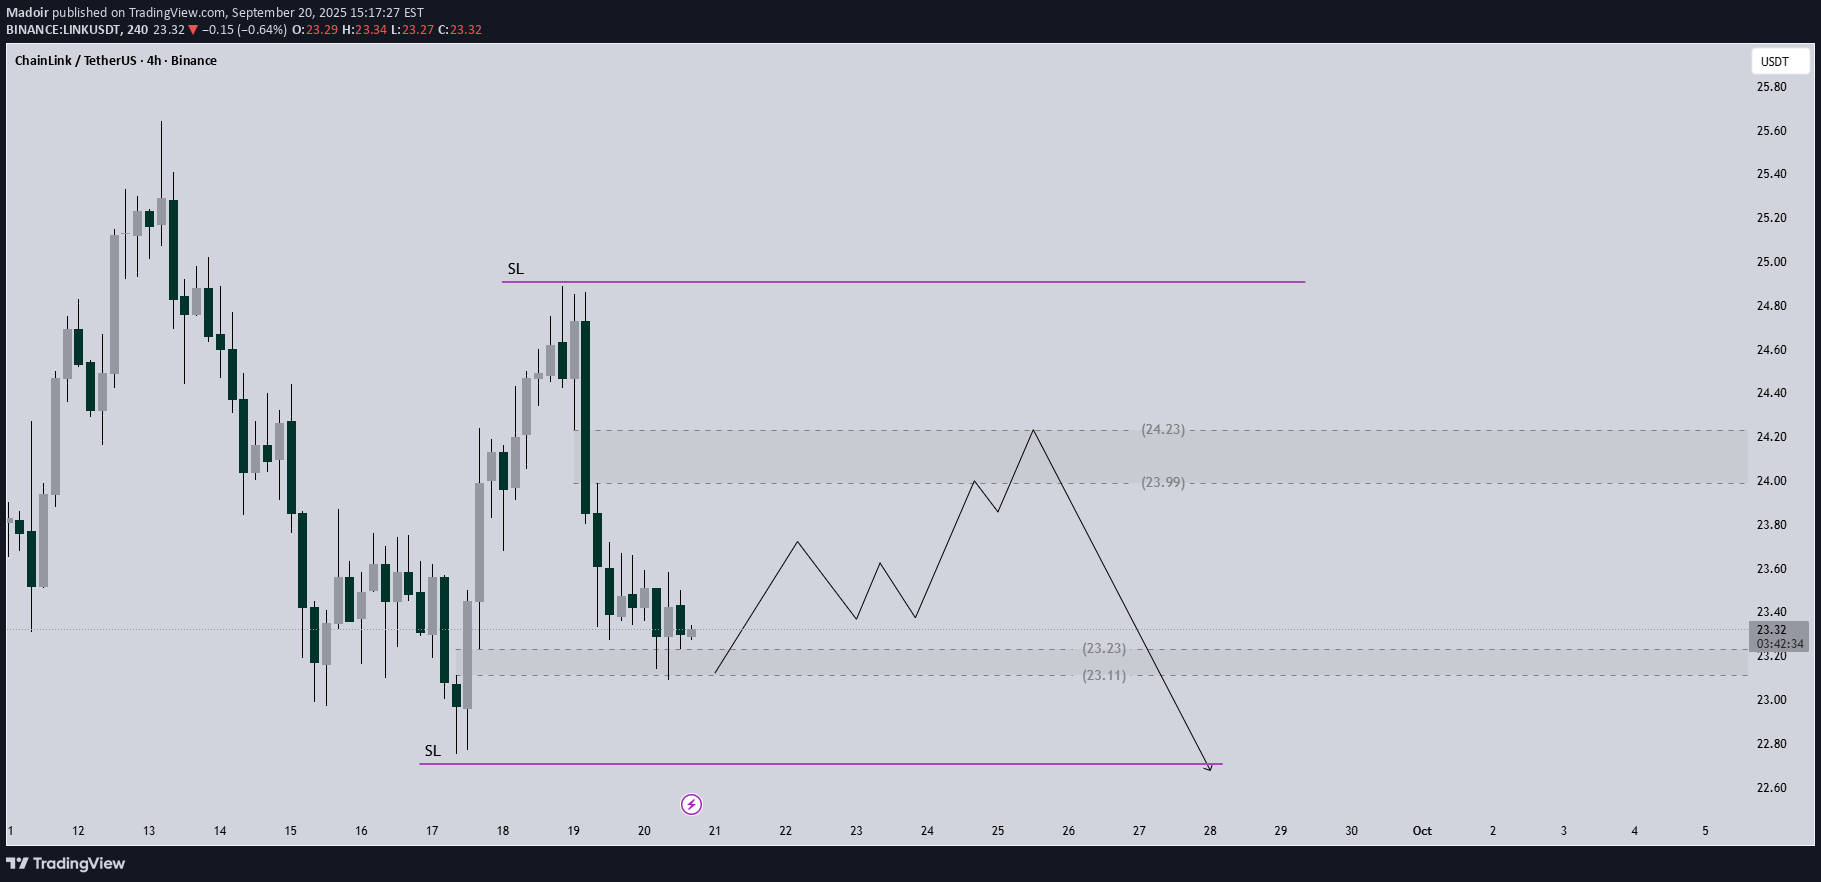
Hi guys . i have this setup for LINKUSDT a double position . a long to upper FVG then short from there . in both case my SL above and blow major pivots.
Madoir
BNB CAN MAKE A NEW ATH
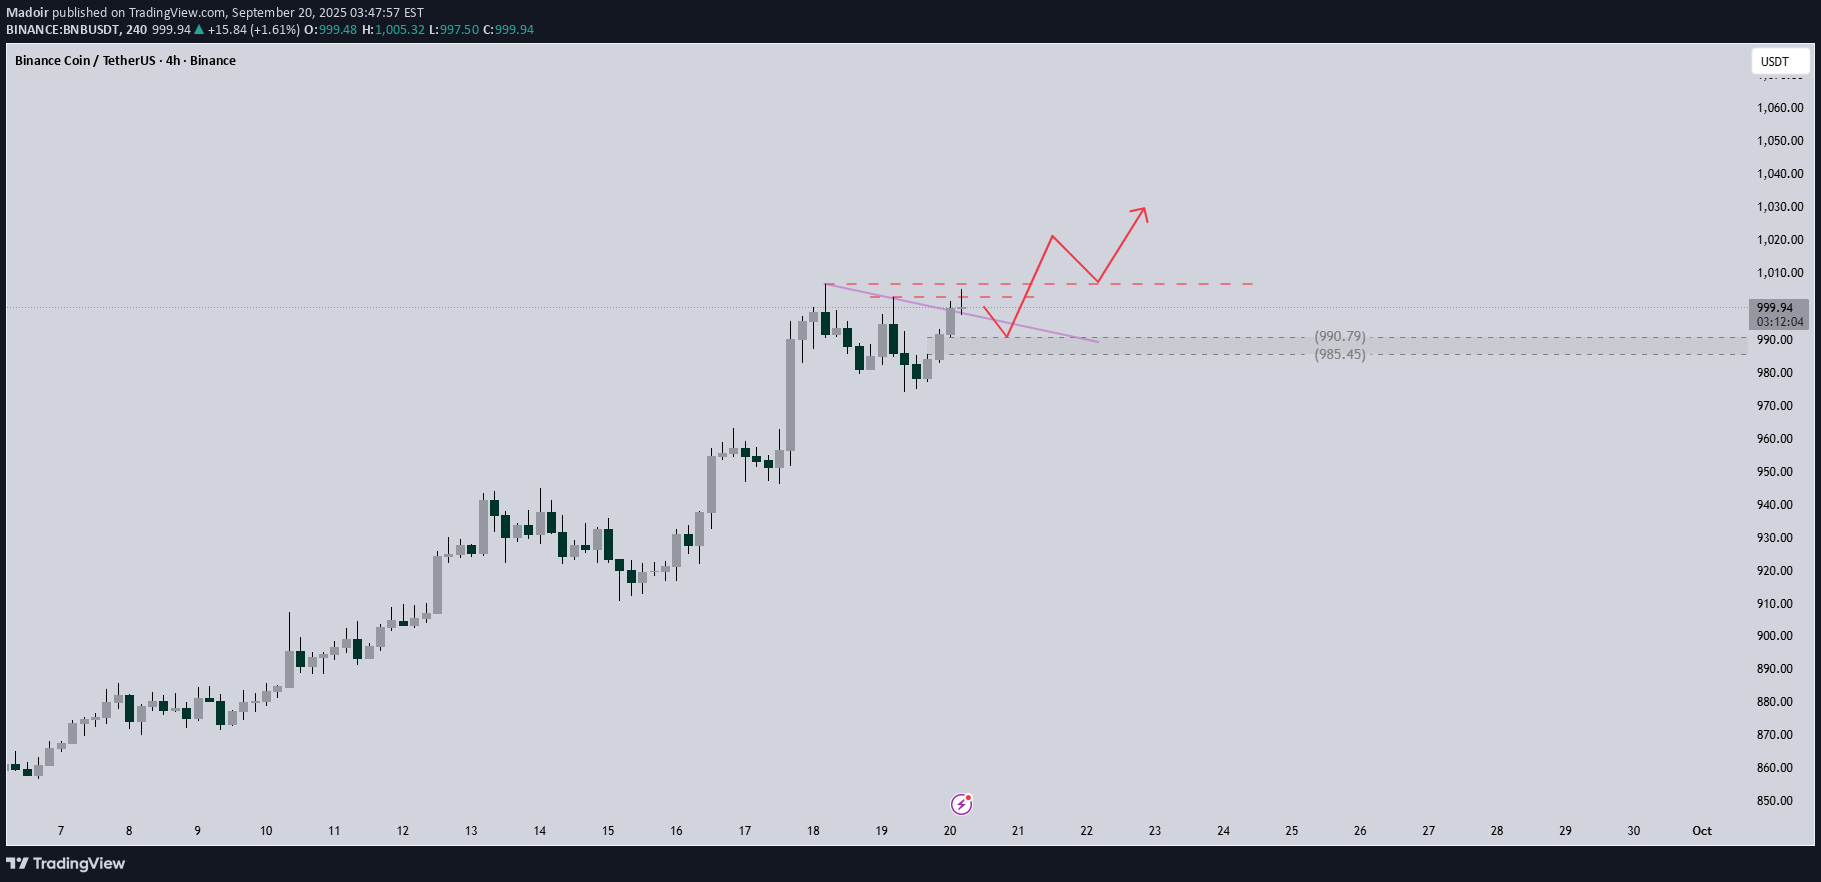
i think BNBUSDT still bullish and can make a new ATH in the next Hours . i don't know how far it can reach but a new ATH is in plan! best entry point can be in 4H FVGAs I expected, we saw a new all-time high (ATH). Unfortunately, I didn't get tagged, and I don't want to chase the price. This point could serve as a support zone for a potential pullback.
Madoir
AVAX Nearing Key Resistance Zone
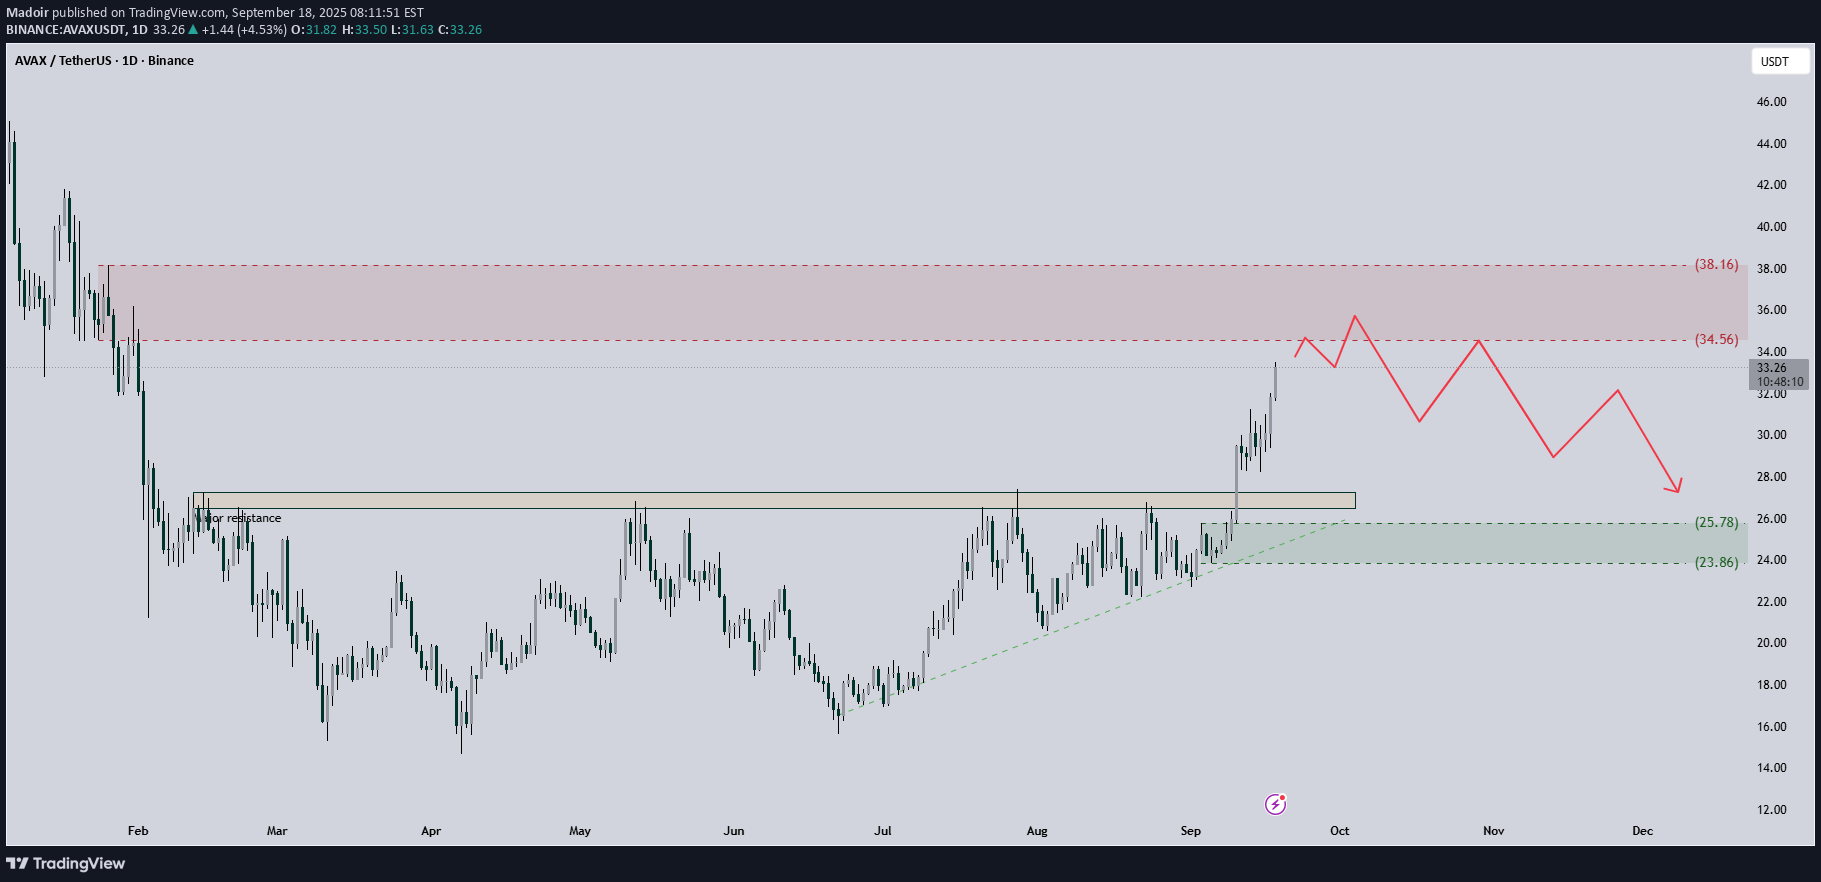
AVAX USDT Daily: Price Nearing Key Resistance Zone AVAXUSDT has demonstrated a strong upward trend, breaking through a significant, long-term resistance level that has been in place since early in the year. This breakout is a bullish signal, and it's exciting to see the momentum it's carried. However, the price is now approaching a new, crucial resistance zone between $34.56 and $38.16. This area previously acted as strong support before a significant downtrend. Based on my analysis, I anticipate a potential rejection from this zone, which could lead to a correction toward the previous resistance-turned-support area around $23.06 to $25.78. The short-term outlook suggests a possible pullback from the current levels, but the overall market structure looks promising as long as the price holds above the recently broken resistance. I'll be watching for a clear reaction in this resistance zone to confirm the potential move. What do you think? Drop your thoughts and analysis in the comments below!As expected, we saw a price reaction to the specified box in this area. However, the daily timeframe is still bullish, and we haven't received confirmation on the 4-hour timeframe. But on the lower timeframes, I've opened a small, short-term position. for swing trade we need more confirmations.
Madoir
SHIB Sell to BUY
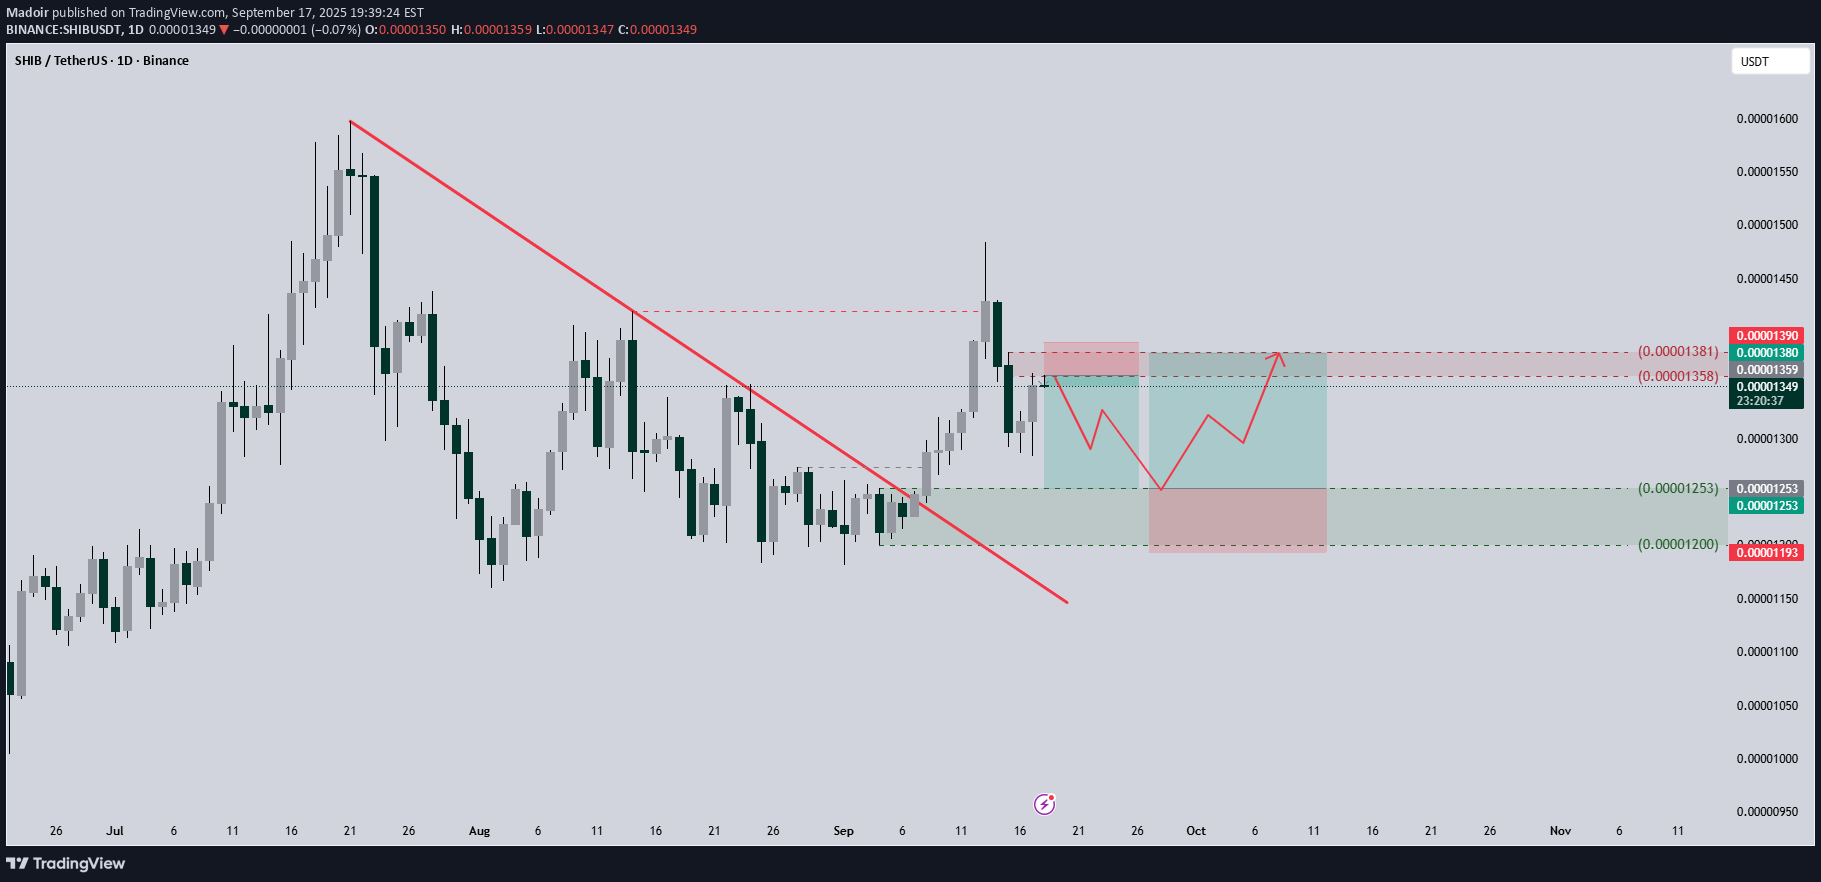
SHIBUSDT Market Update: After a significant downtrend and following a descending trendline on the daily timeframe, SHIB finally broke out and saw an impressive pump. However, I now anticipate a potential correction from the current level (the red box) down towards the green box. I expect to see strong support in that area, which could then lead to the next bullish leg higher.The price broke its support level, and a small pullback is expected on a lower timeframe. However, we haven't reached the target point yet, although profits are secured. But the more important question is whether we will see an upward move for a long position once we reach the main support.
Madoir
POL LONG IDEA
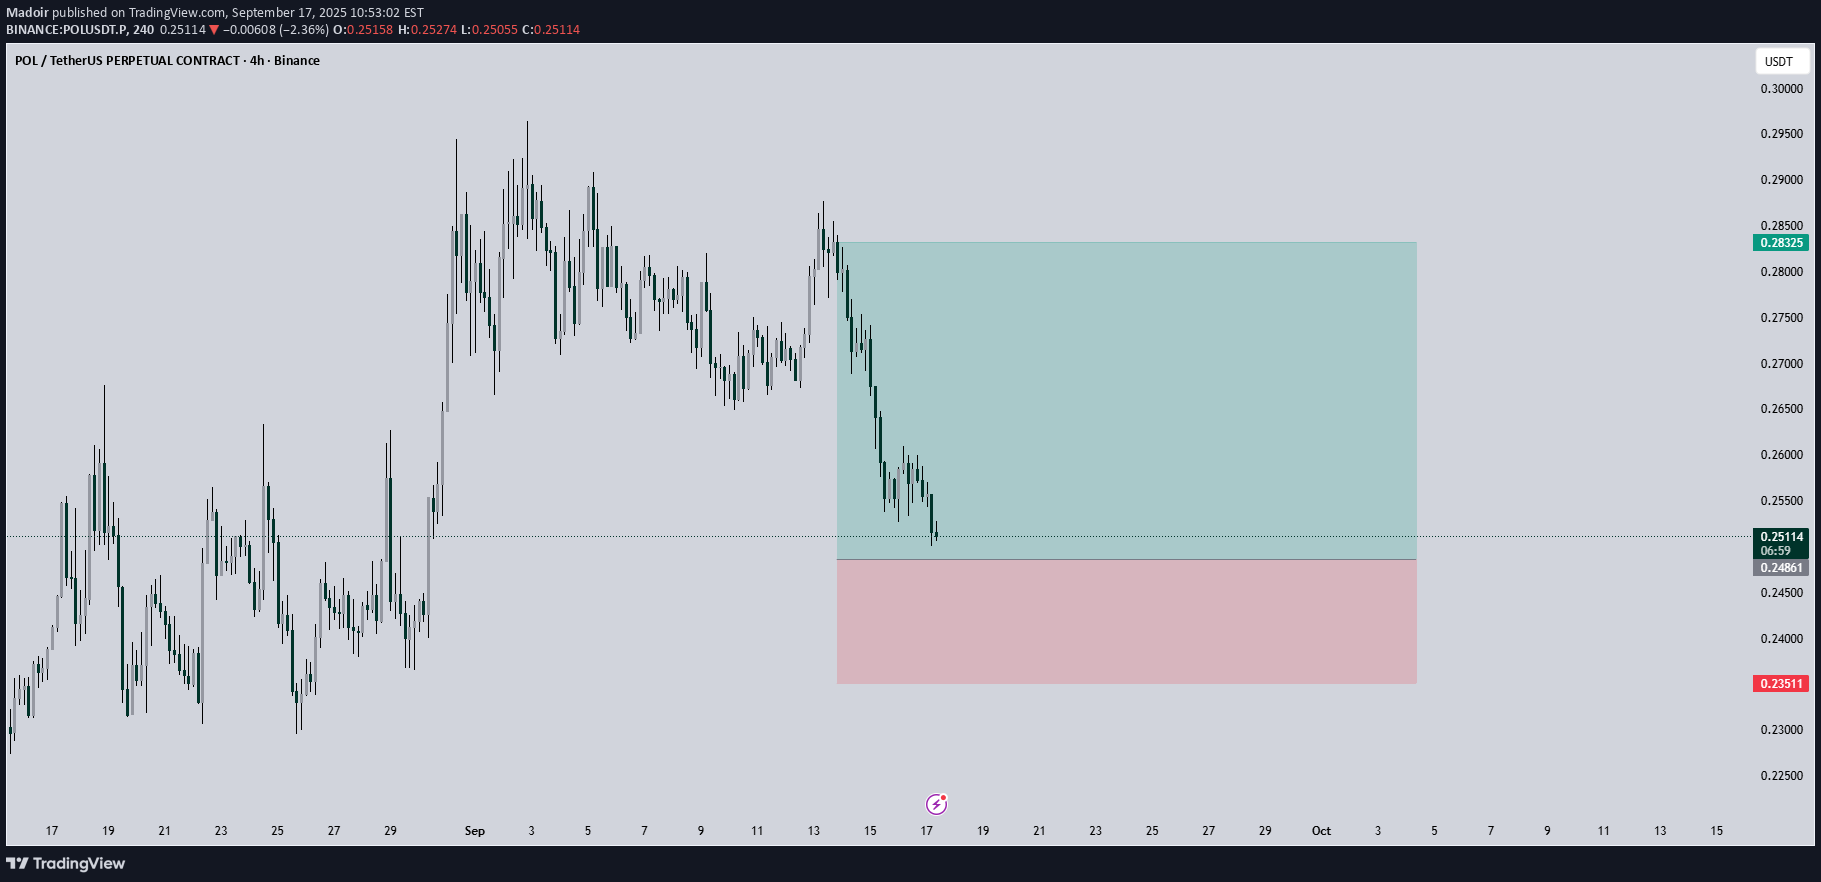
im taking a long position here for POLUSDT.P This is risky so I'm not responsible for your losses. DYR Entry SL TP are visible on the chart.
Madoir
The first sign of bears
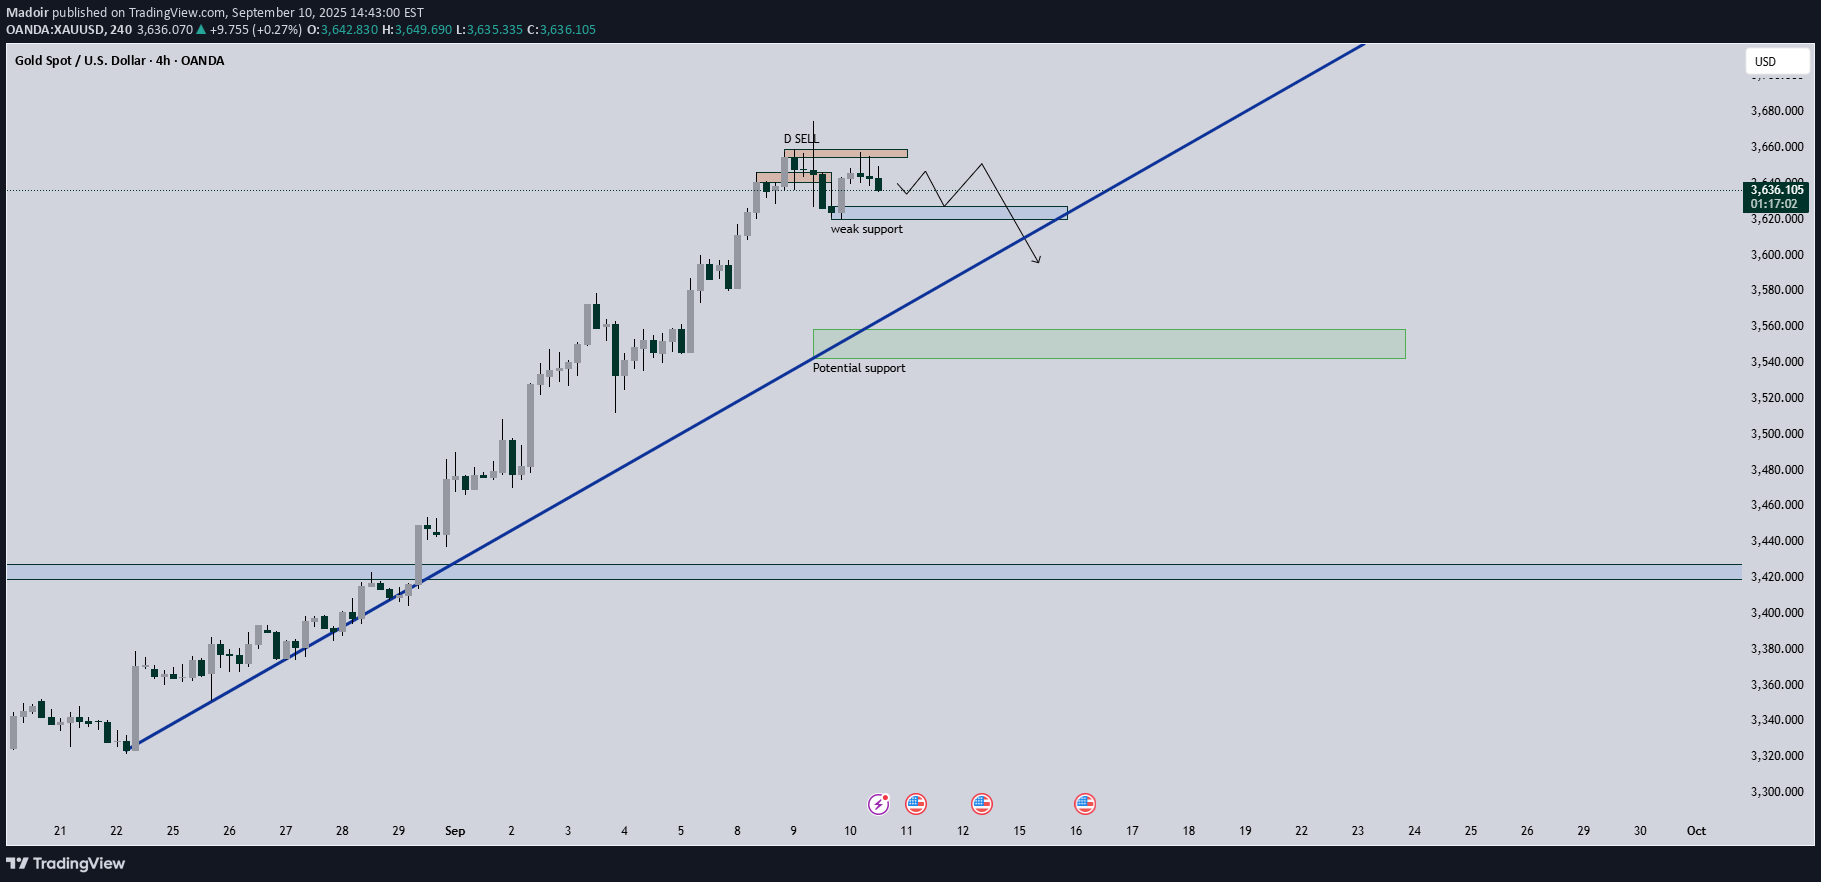
they are coming 🐻🐻🐻🐻🐻🐻 Gold has been on a remarkable bullish run over the past few weeks, setting multiple new highs. However, we are now seeing the first clear signs of seller presence entering the market. This looks like a potential turning point. While I cannot predict the exact magnitude or speed of the decline, the probability of a reversal from this point appears to be high. I am anticipating a significant pullback. Keep a close eye on key support levels. This could be the start of a new phase for gold.
Disclaimer
Any content and materials included in Sahmeto's website and official communication channels are a compilation of personal opinions and analyses and are not binding. They do not constitute any recommendation for buying, selling, entering or exiting the stock market and cryptocurrency market. Also, all news and analyses included in the website and channels are merely republished information from official and unofficial domestic and foreign sources, and it is obvious that users of the said content are responsible for following up and ensuring the authenticity and accuracy of the materials. Therefore, while disclaiming responsibility, it is declared that the responsibility for any decision-making, action, and potential profit and loss in the capital market and cryptocurrency market lies with the trader.