
MLDpwnz
@t_MLDpwnz

What symbols does the trader recommend buying?
Purchase History
پیام های تریدر
Filter
LTC/USDT — Market Structure
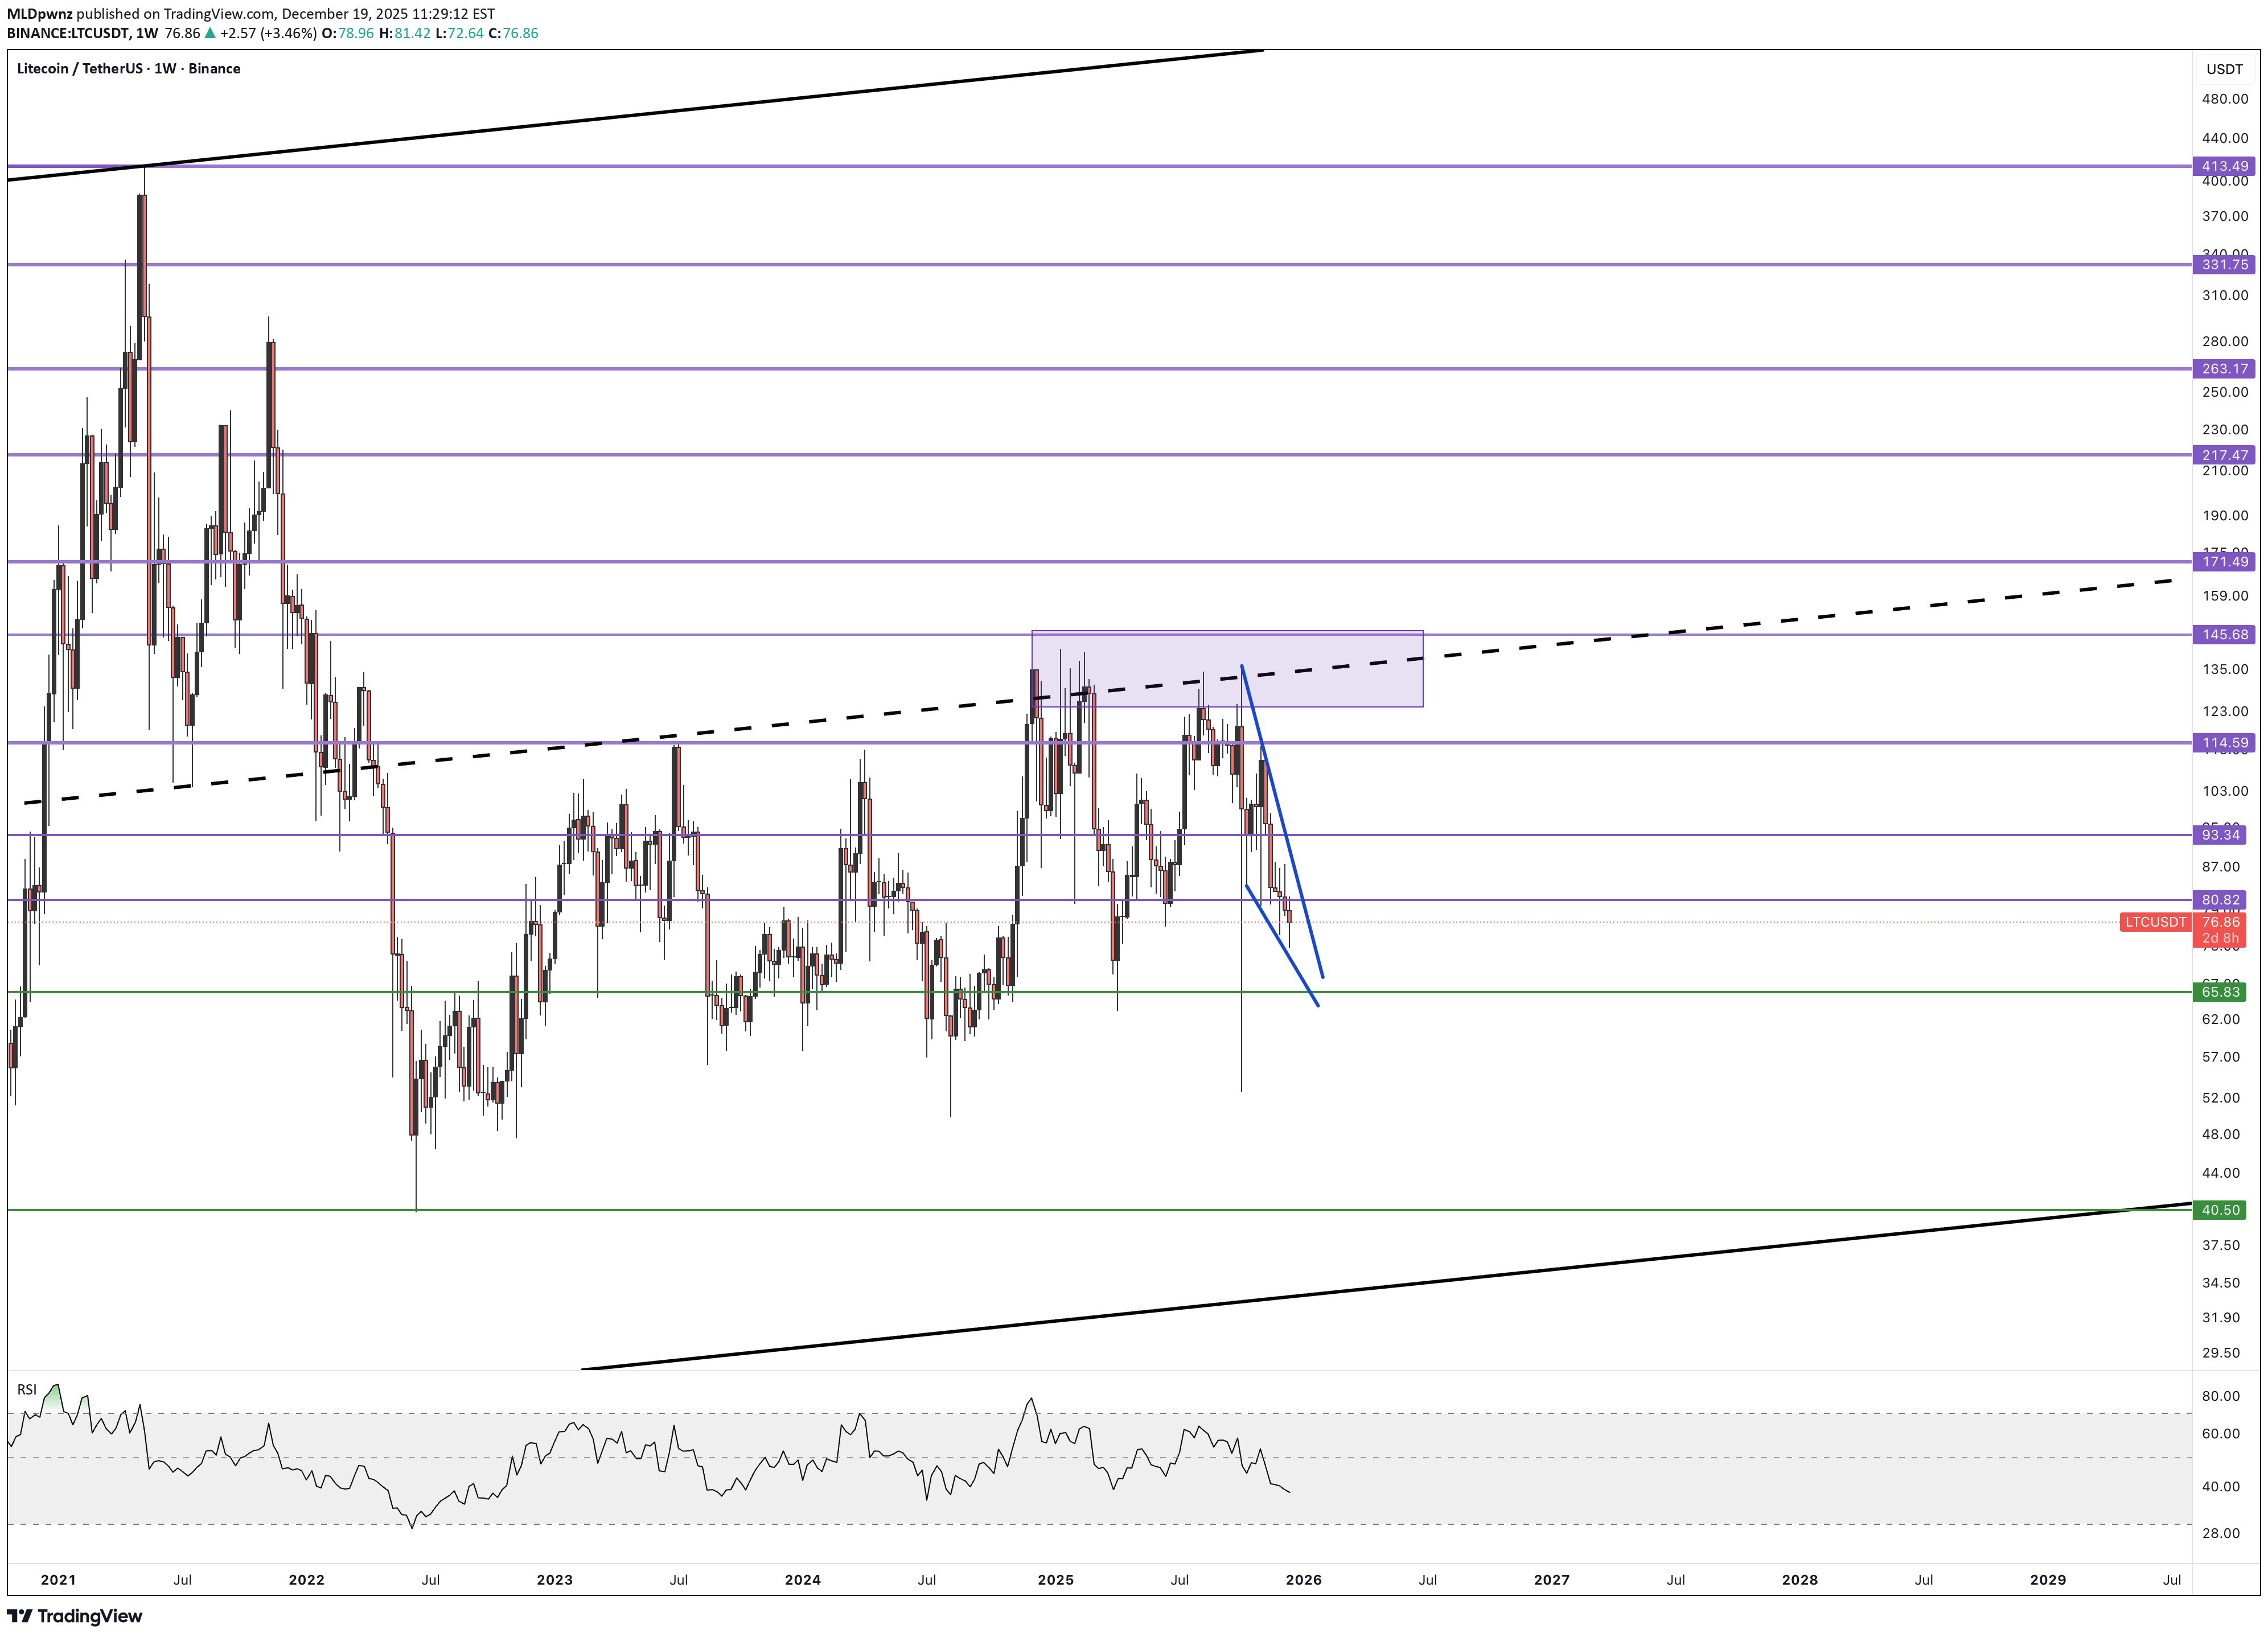
The resistance block and the channel midline proved too strong — after another test, price moved into a correction. The $70–95 range is the most heavily traded zone, where position building is taking place. A bullish wedge is currently forming within this range. Trade options: — accumulate inside the pattern with a mandatory stop-loss below it; — or wait for a confirmed breakout above the wedge’s upper boundary and enter on confirmation. 🎯 Primary targets: $93 and $110. Long-term targets should be considered only after a sustained break and hold above $150.
POL/USDT — Market Structure
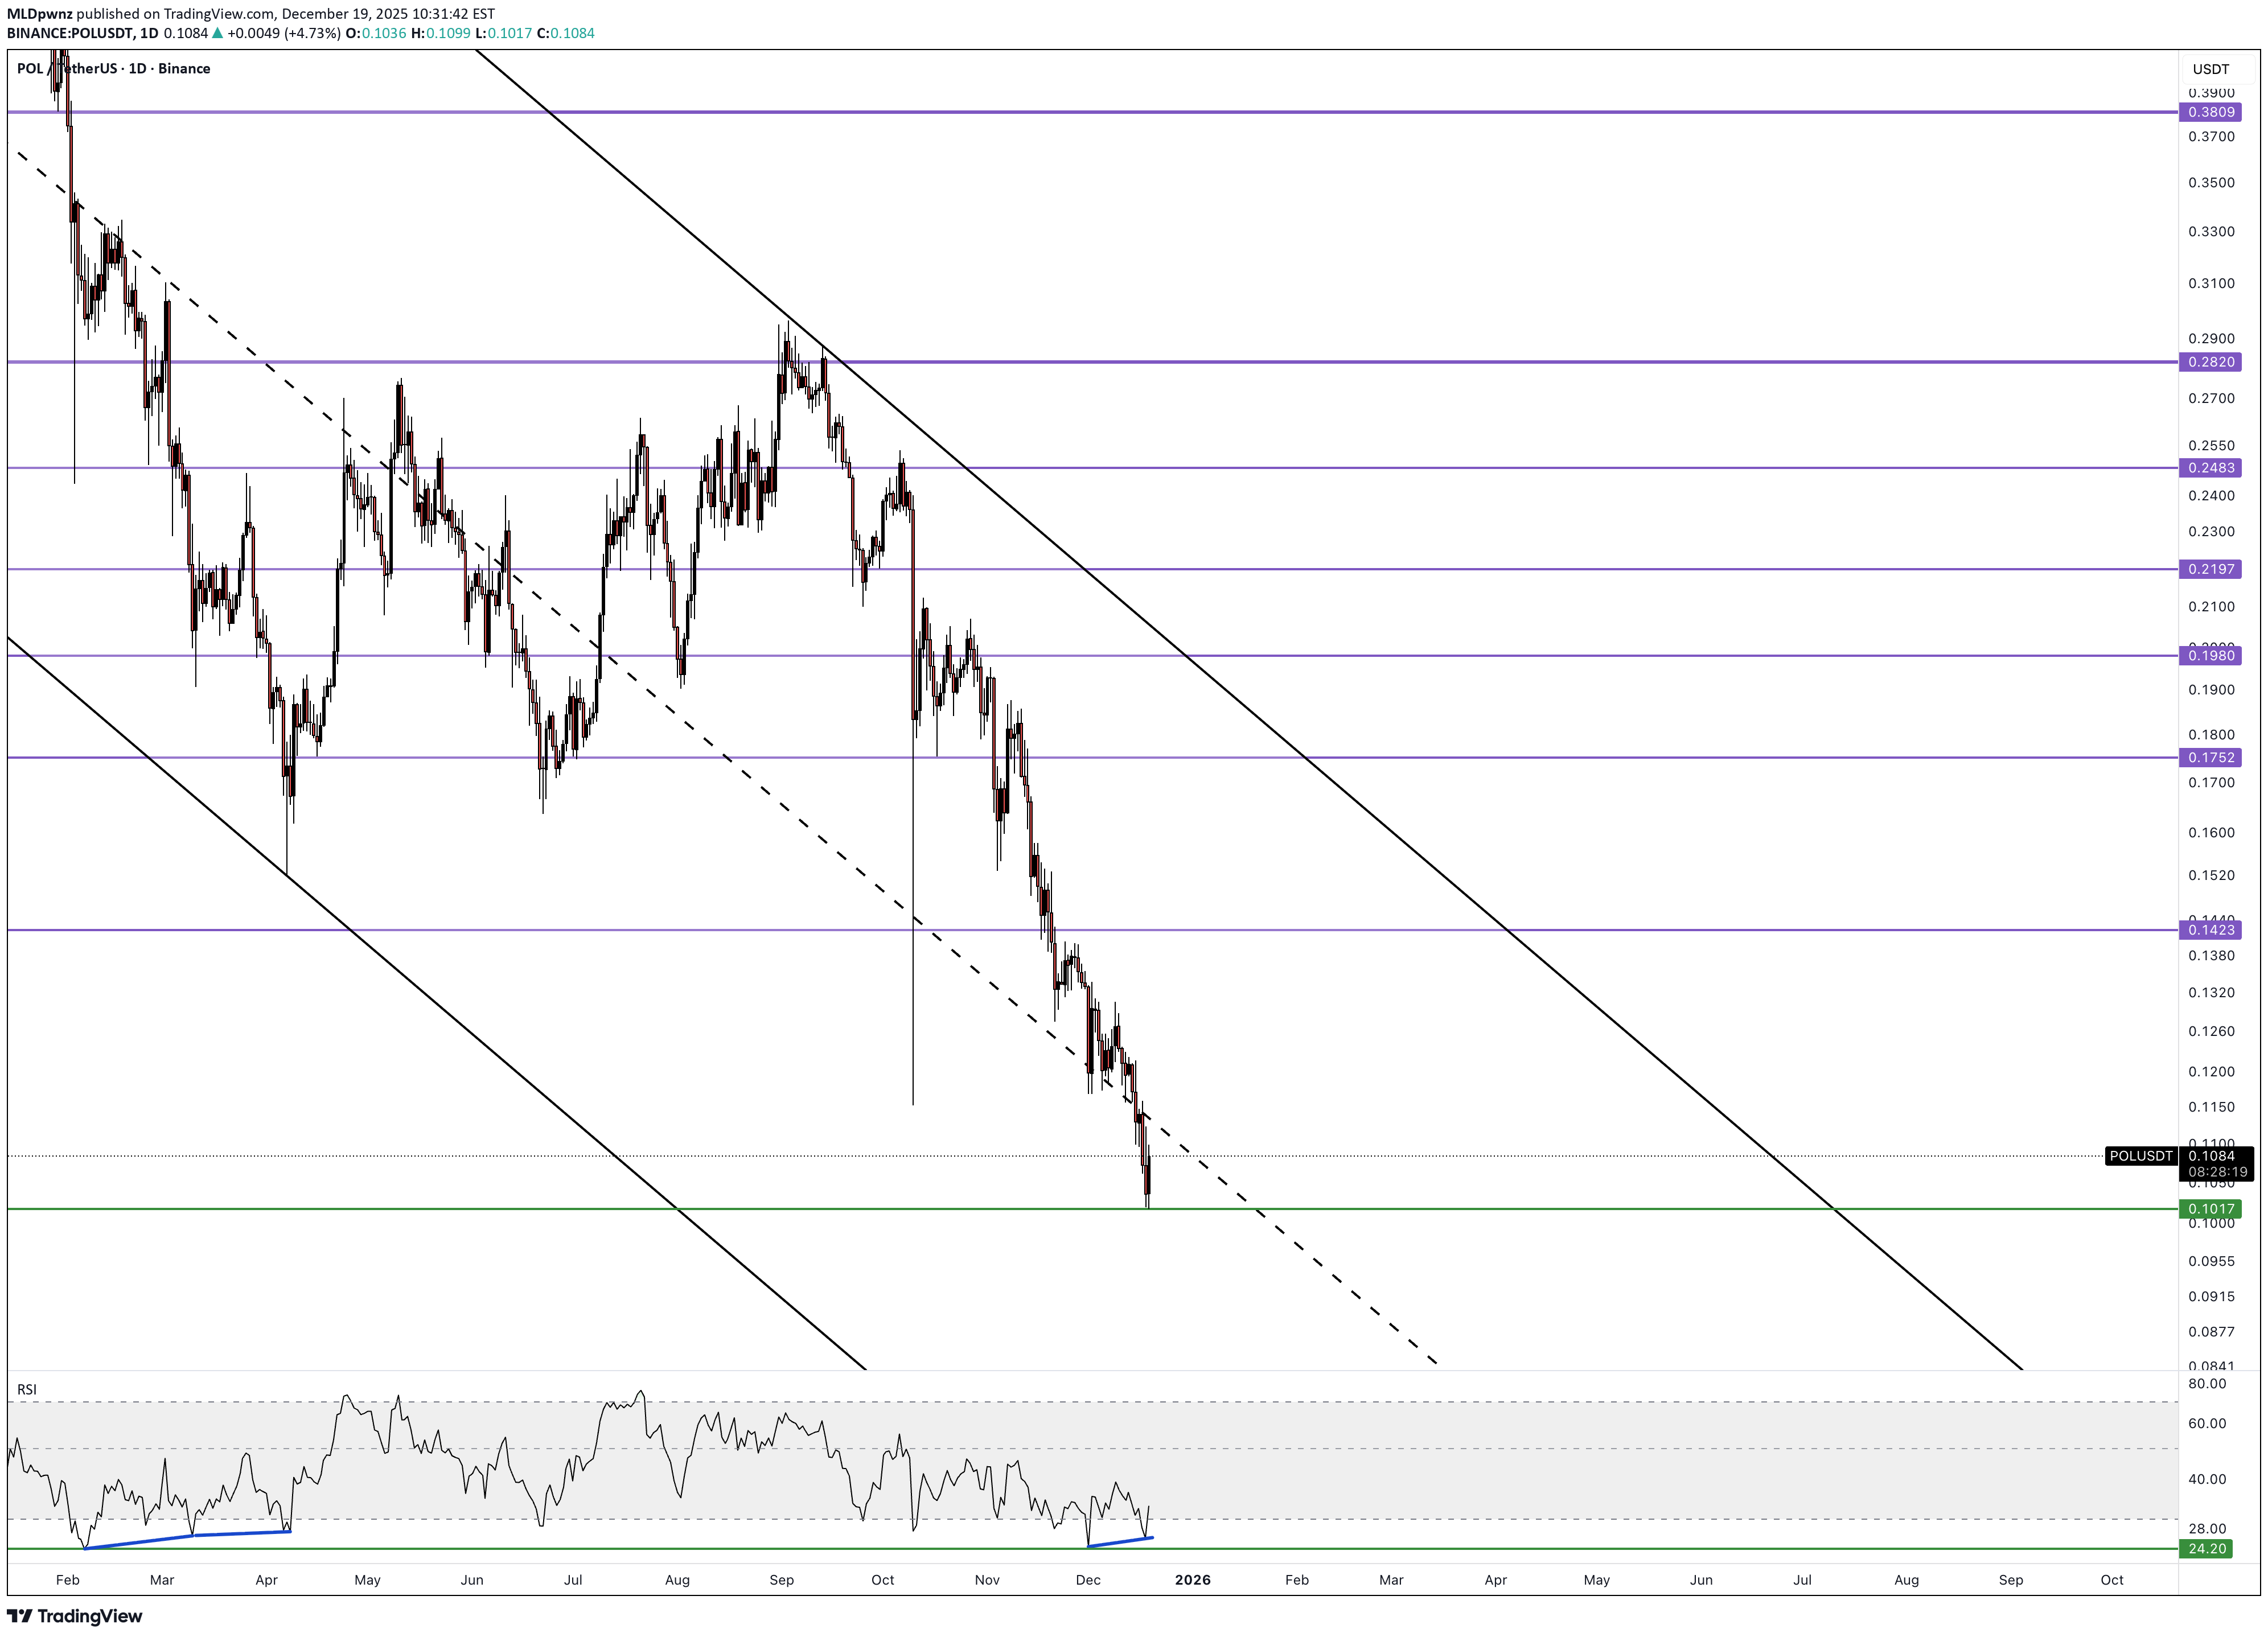
The MATIC → POL rebrand didn’t help: price is down 86% YoY. During this period, a descending channel formed, and price is now holding below the channel midline. RSI shows a bullish divergence after extreme oversold conditions. This is a strong bullish trigger, but it’s important to remember: it can play out with a significant delay. Last time, the reversal took over two months and only occurred after a double divergence formed. How to trade it: • Aggressive: buy at current levels with a stop below the low. • Safer: wait for a reclaim and hold above the channel midline, then enter with a stop below the low. 🎯 Primary target: the upper boundary of the channel. Higher targets make sense only after a confirmed breakout above it.
DOGE/USDT — Market Update
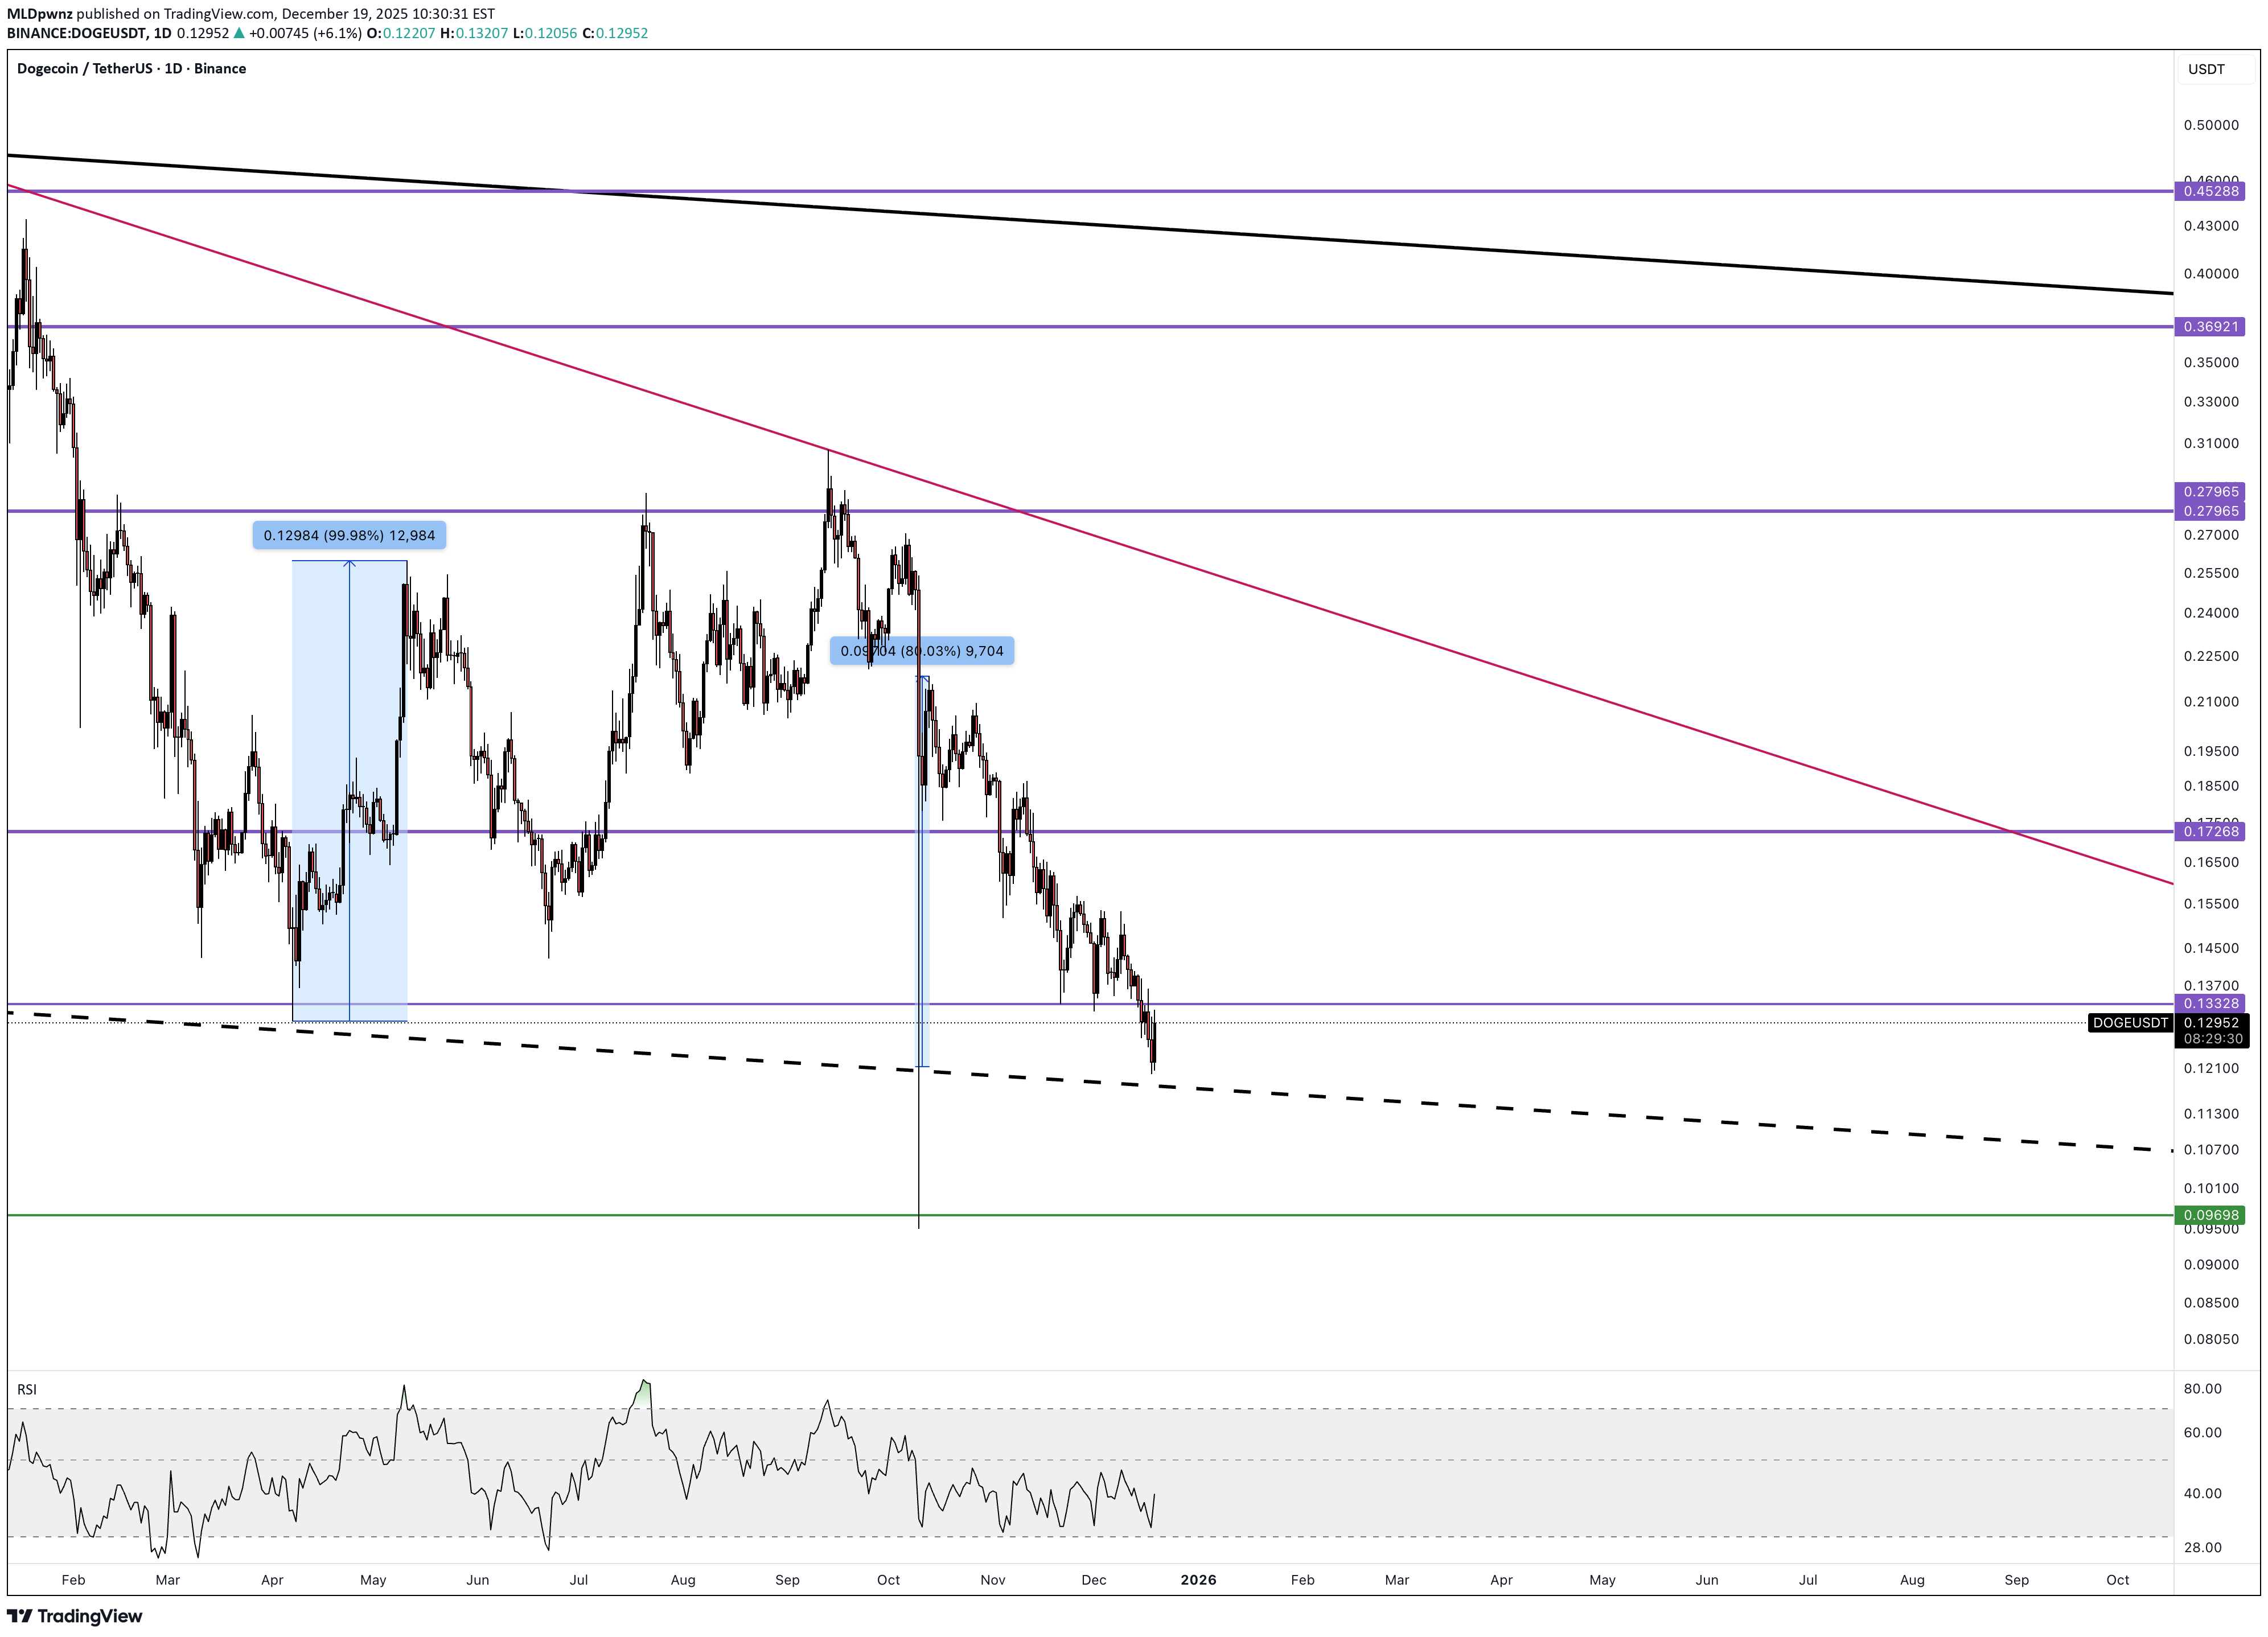
Since the last review, the structure has slightly changed. Price has once again reached the midline of the channel, and buyers are reacting again — a bullish engulfing pattern is forming. Last time, the bounce from the channel midline produced ~100% upside. During the flash crash, the rebound was around 80%. This creates a favorable risk/reward setup: — entry at current levels, — stop-loss below the local low, — targets: 0.17 → 0.20 → near the downtrend resistance.
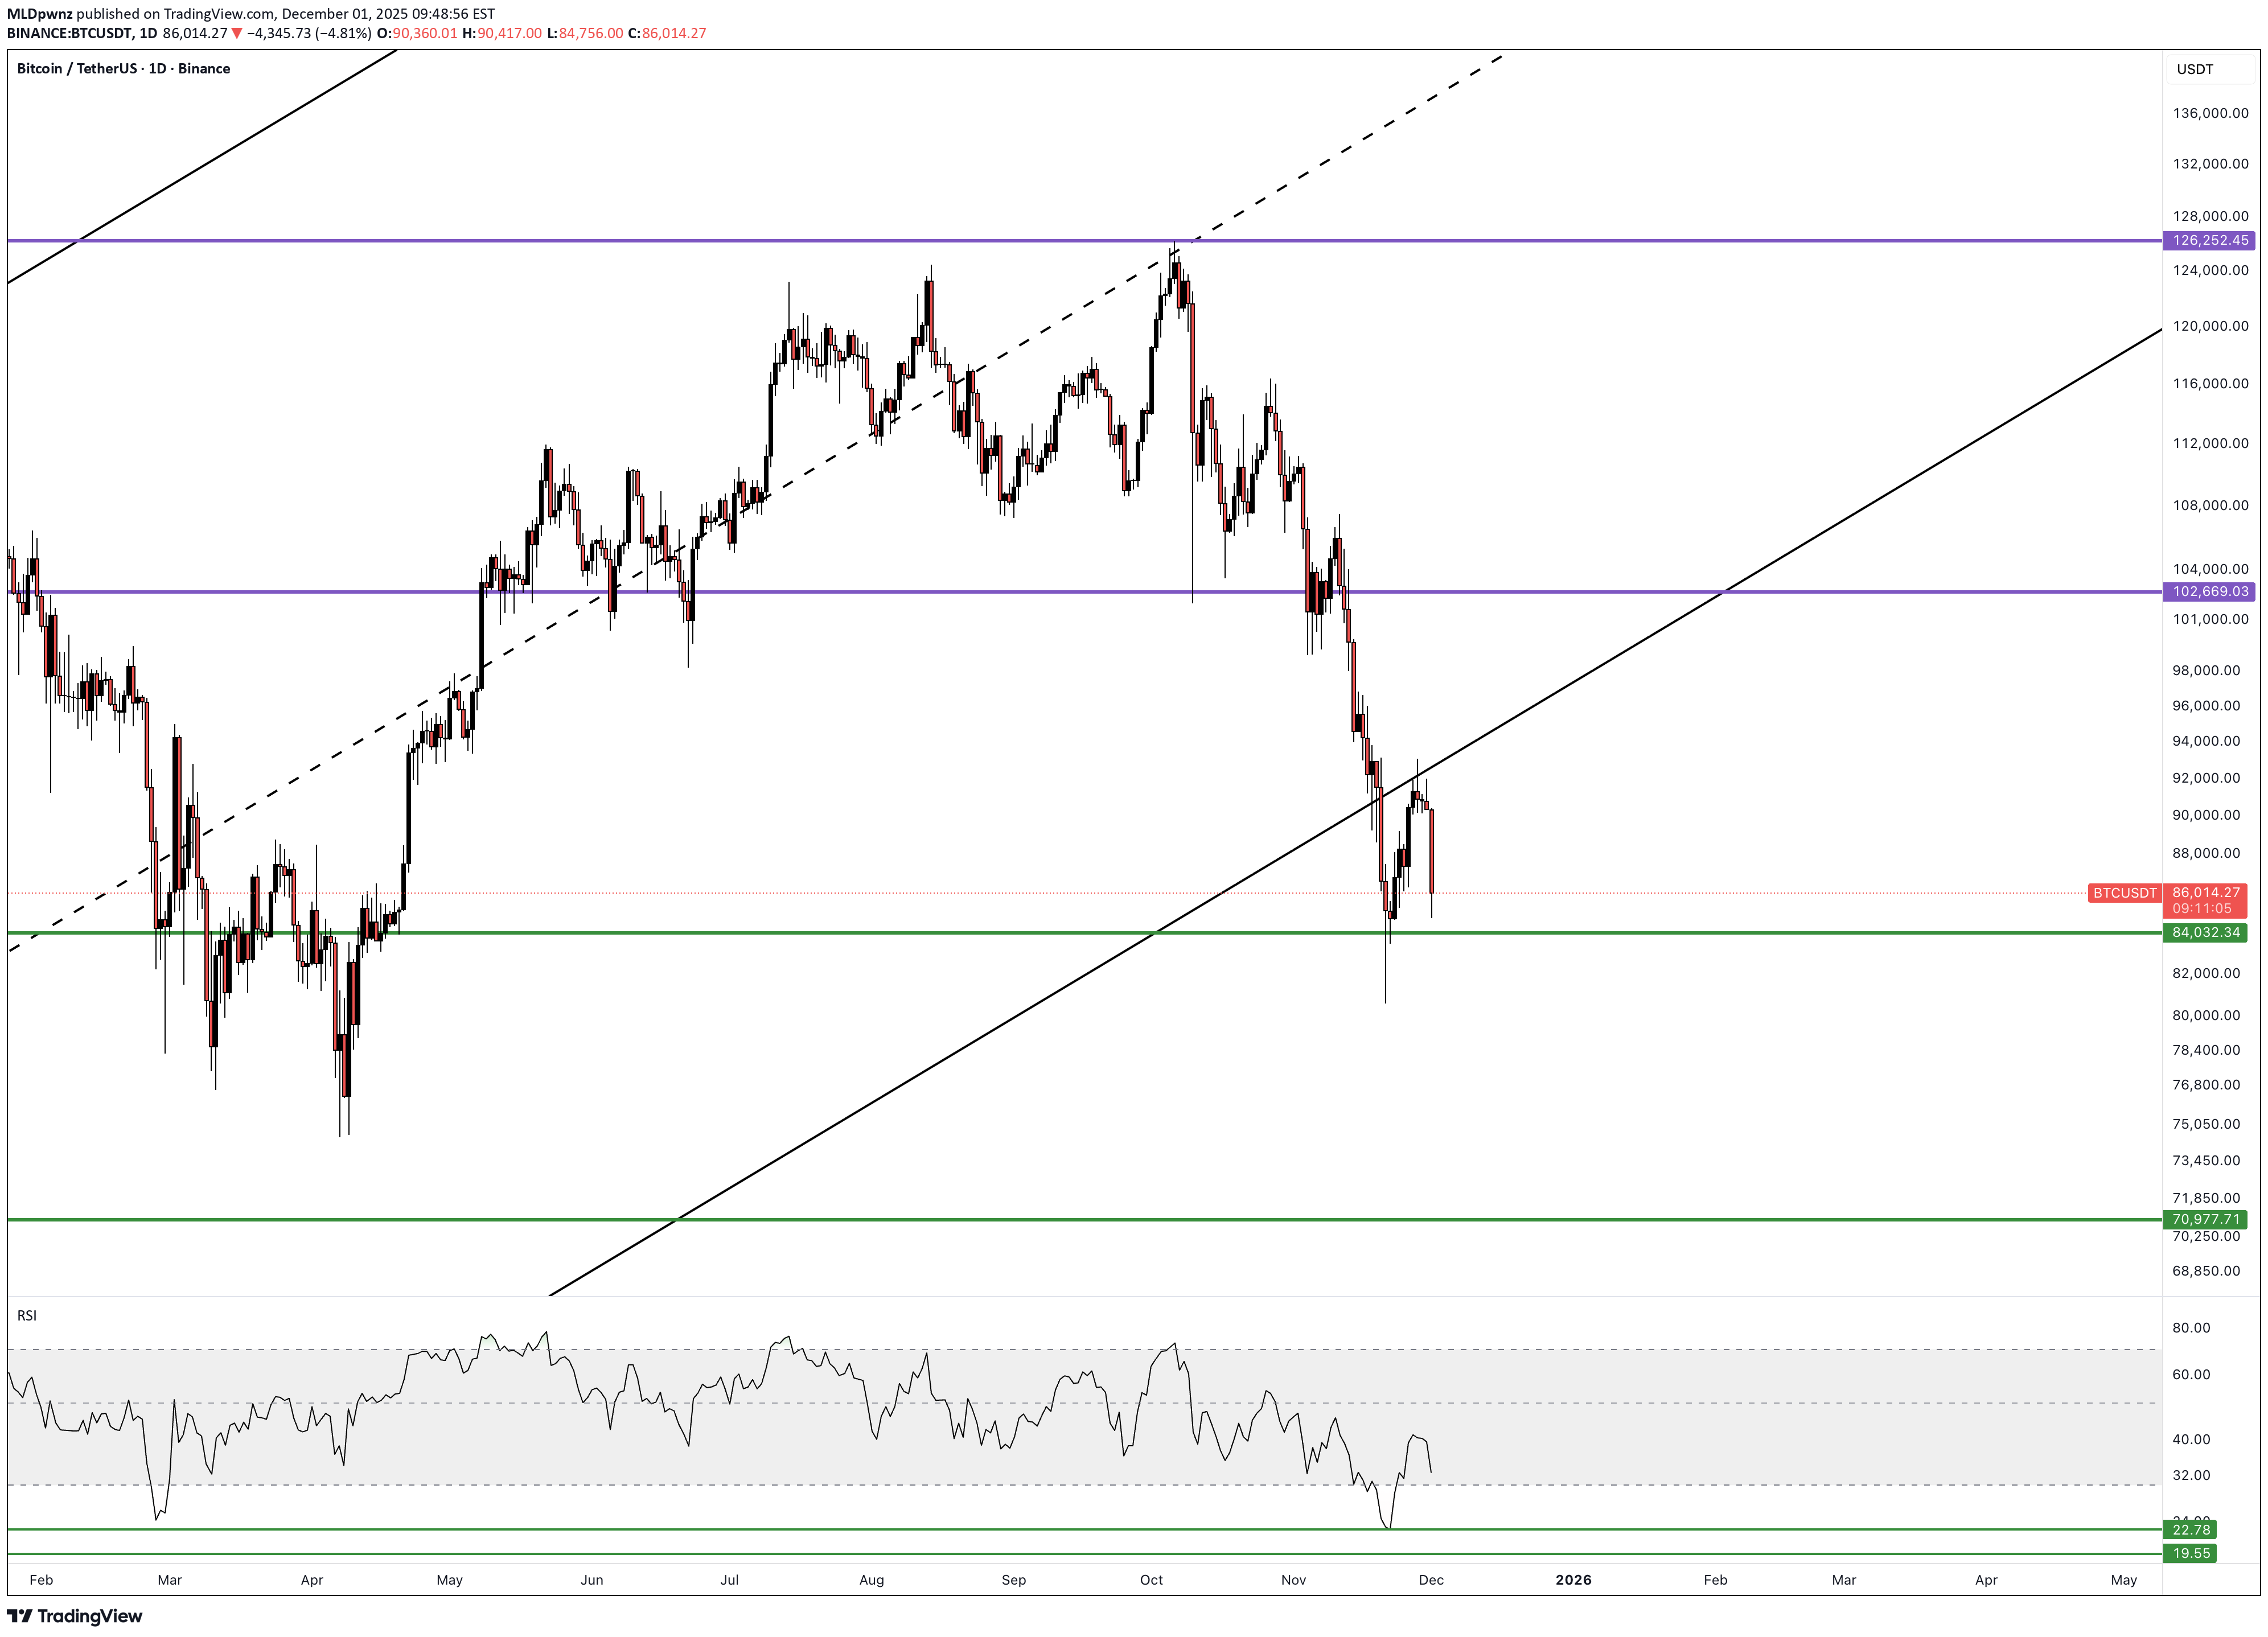
BTC/USDT - Weekly Outlook
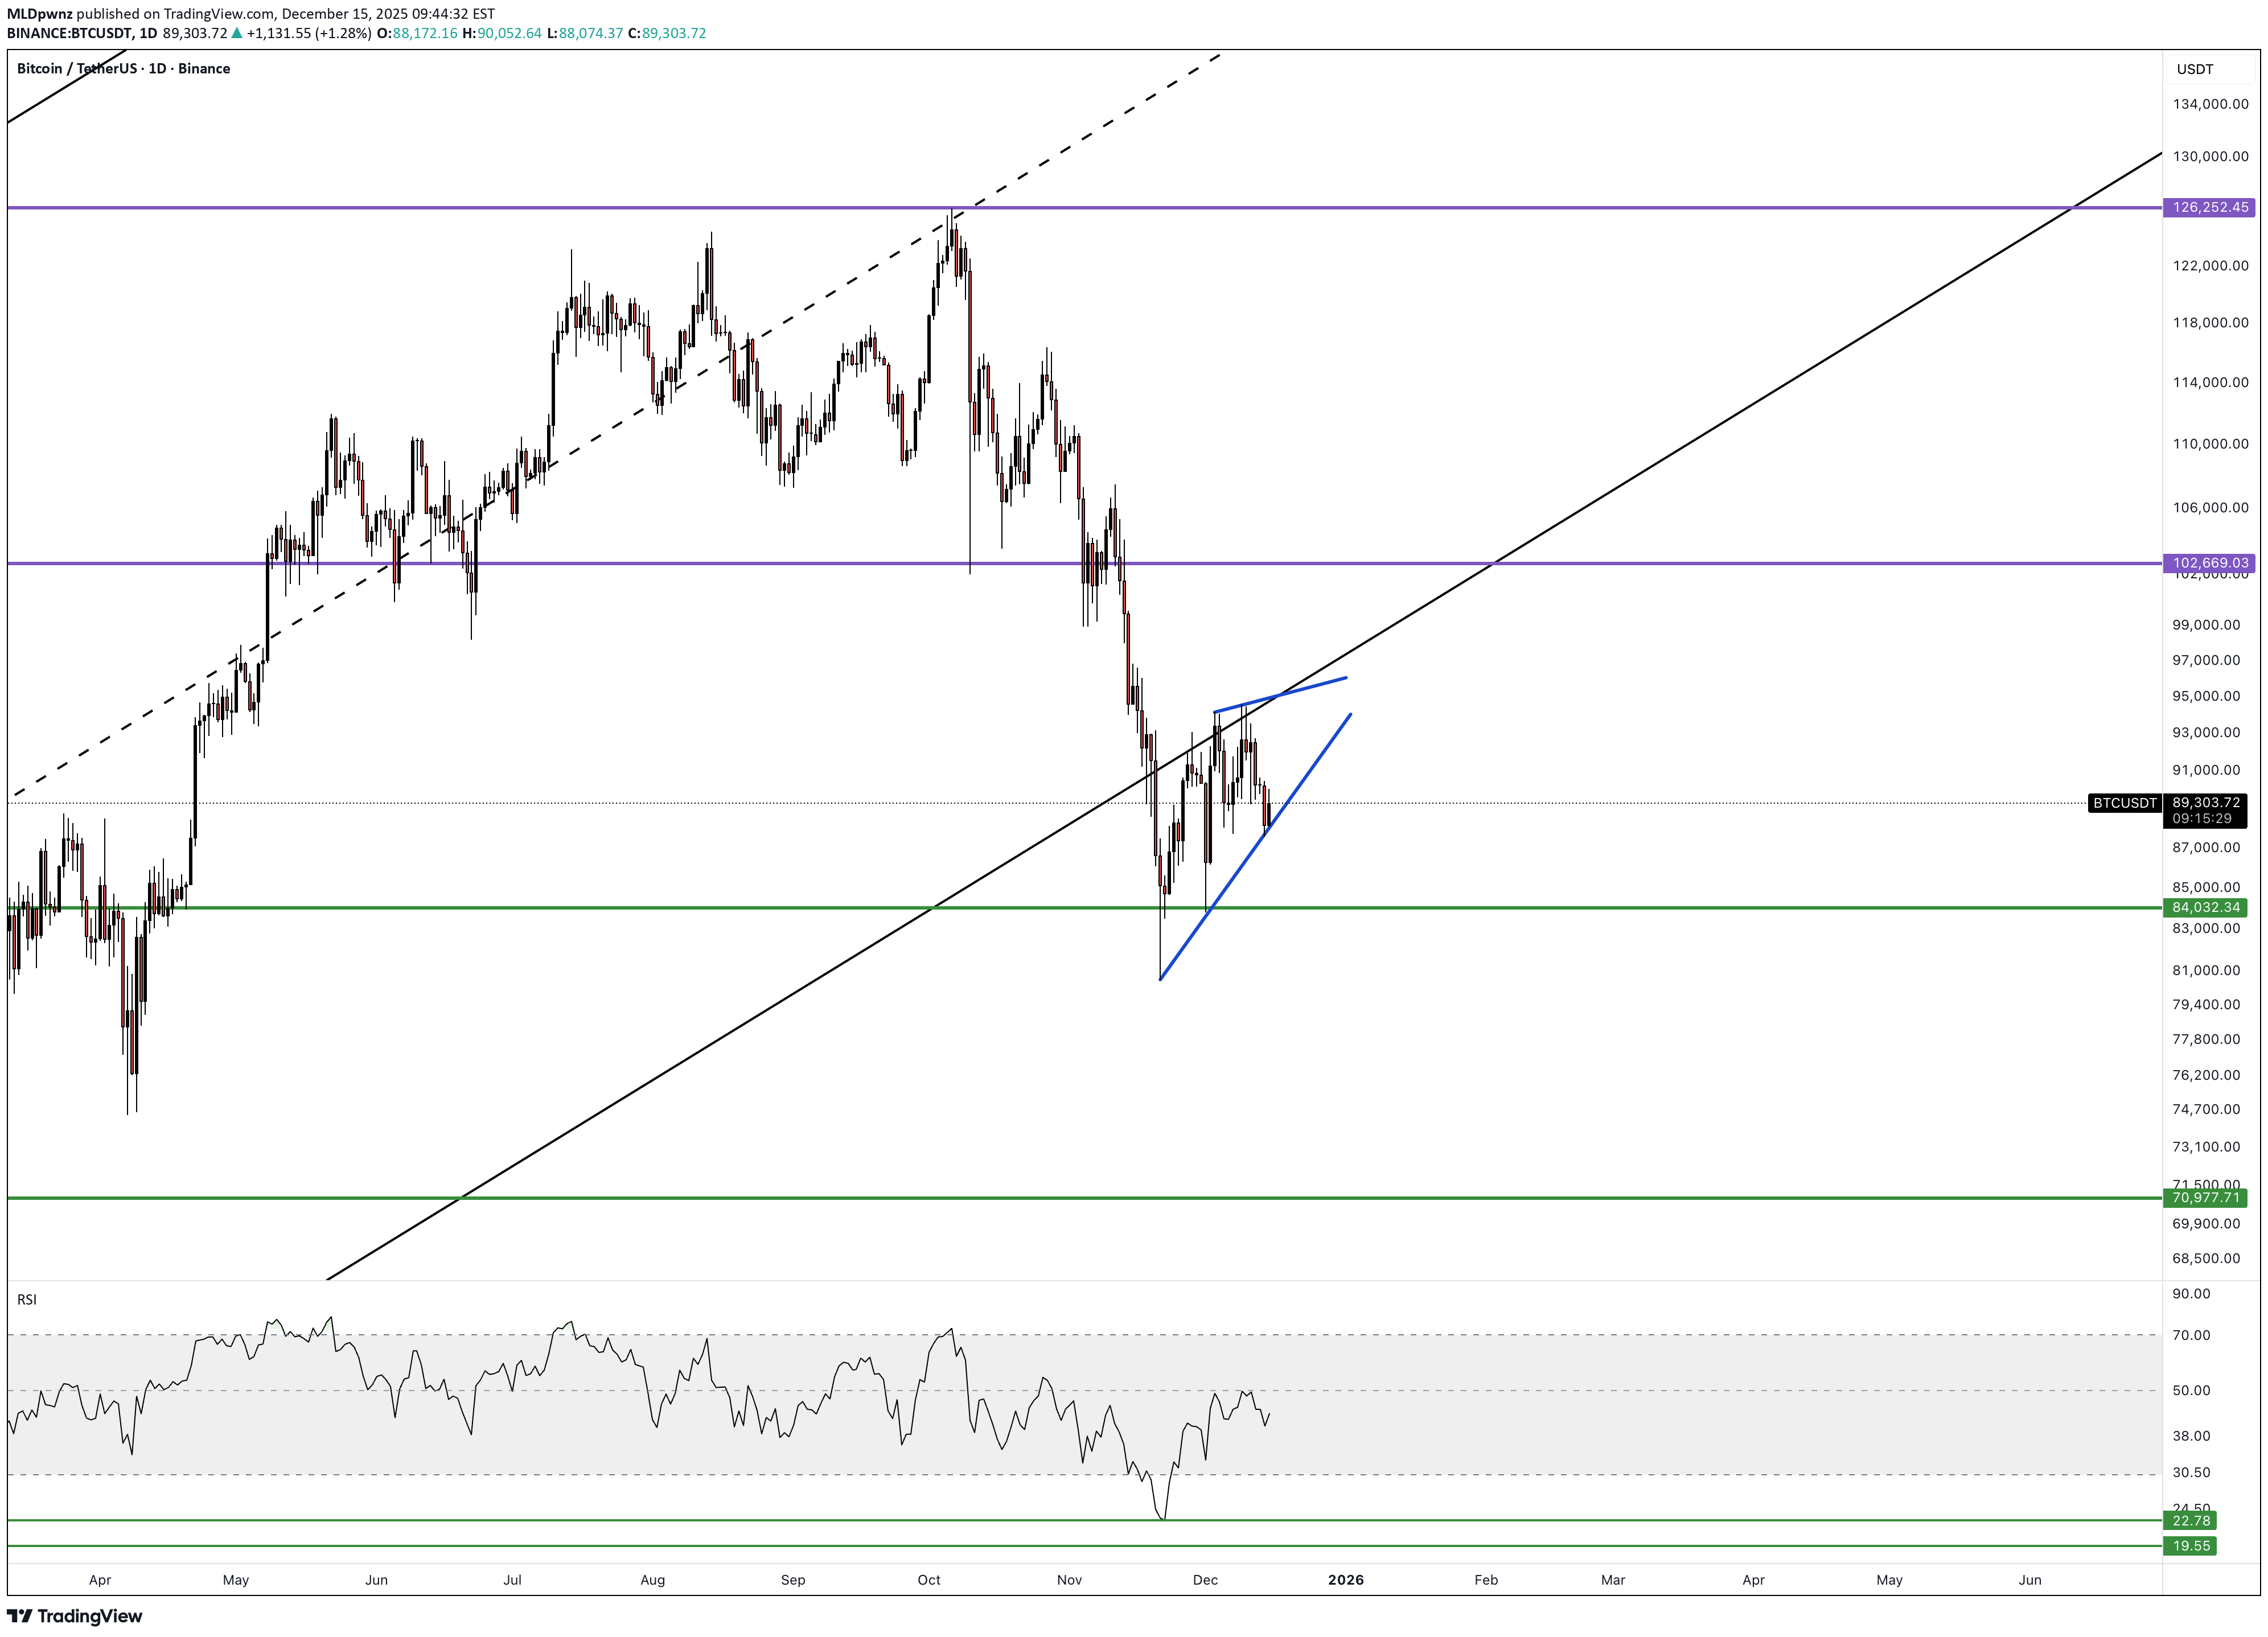
✔️ The week closed with a bearish candle with an upper wick, right after a doji. A bearish structure has formed. To invalidate it, price must reclaim and hold above 95k. 🟢 Macro conditions are improving. 🟢 ETF flows have turned positive again — funds continue to accumulate. 🟠 Open Interest has declined and is likely to keep falling into the holiday period. This is a phase when the market is especially easy to manipulate. 🟠 Sentiment is hovering between fear and extreme fear. 🔴 Negative cumulative delta: –$1.63B , indicating realized losses. 🔴 Price failed three times to break resistance from the lower boundary of the channel and the RSI 50 level. 🔴 A bearish pennant is forming — a classic trend continuation pattern to the downside . 🧠 The market does not look ready for an upside reversal. A real reversal usually comes as a surprise to the majority.
SUI/USDT - Market Structure
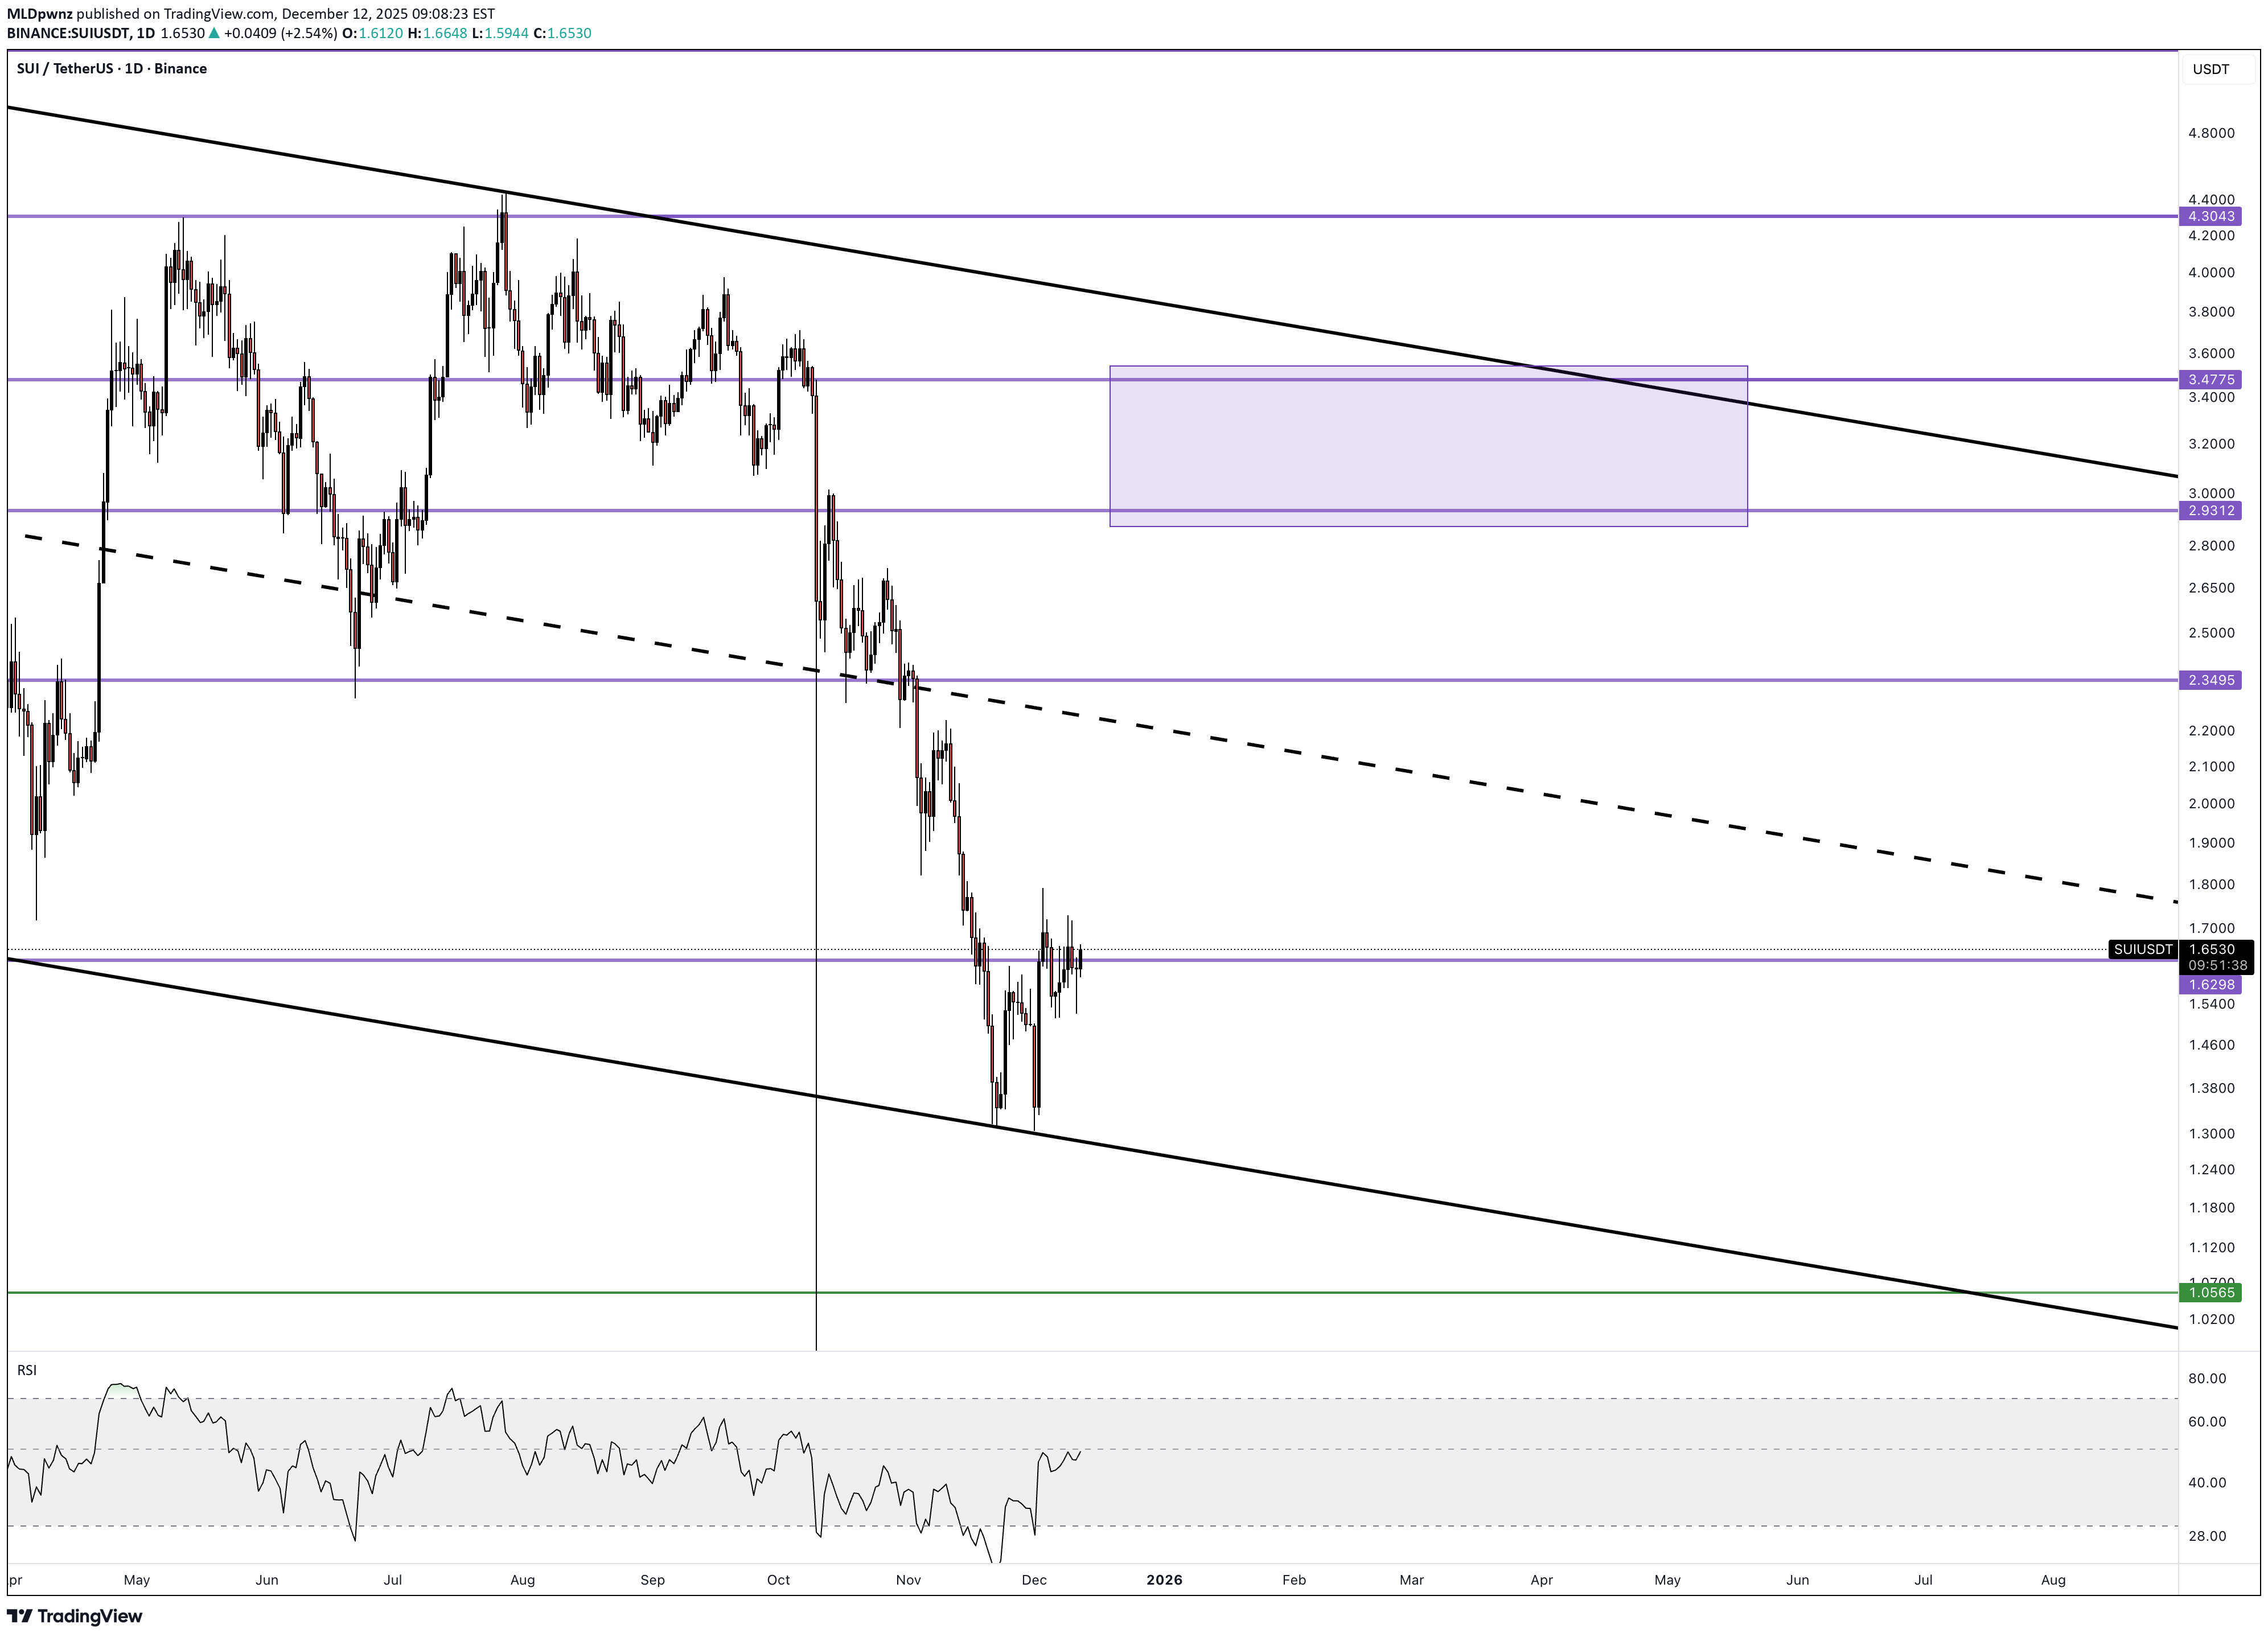
Price is attempting a reversal via a double bottom. The key resistance at the moment is the prior low zone at $1.70–1.90. RSI is also capped near the 50 level, preventing a move into bullish territory. On the weekly chart , the only potential reversal signal so far is extreme RSI oversold conditions — no other confirmations yet. Current structure allows for a long setup with clearly defined risk: — stop-loss below $1.50. Since price is trading inside a channel, the majority of the position should be taken off just below the channel midline.
SAGA/USDT - Market Structure

SAGA remains in a persistent downtrend. During the flash crash, price lost its support and is now trading roughly –65% below it. There is a chance this deviation gets filled: — a clear bullish divergence has formed on RSI, — on the weekly RSI, price is sitting at levels that previously produced a ~130% bounce. If you choose to trade this setup, a stop-loss is mandatory. Last time, the stop saved the position from a –90% drawdown. Consider taking most profits in the $0.12–0.19 range.
تحلیل ساختار بازار MINA/USDT: آیا کف قیمتی در راه است؟

MINA remains in a persistent downtrend. A large amount of supply has been distributed from $0.20 and above. Until price breaks and holds above this range, medium-term long positions are not justified. 🎯 A bounce can only be taken after a clear reversal setup forms — and there is none yet. Also worth noting: weekly RSI is approaching oversold levels. The 31–33 zone has historically produced bounces.
تحلیل ساختار بازار ترامپ (TRUMP/USDT): آیا سقوط ادامه مییابد یا یک الگوی صعودی پنهان است؟
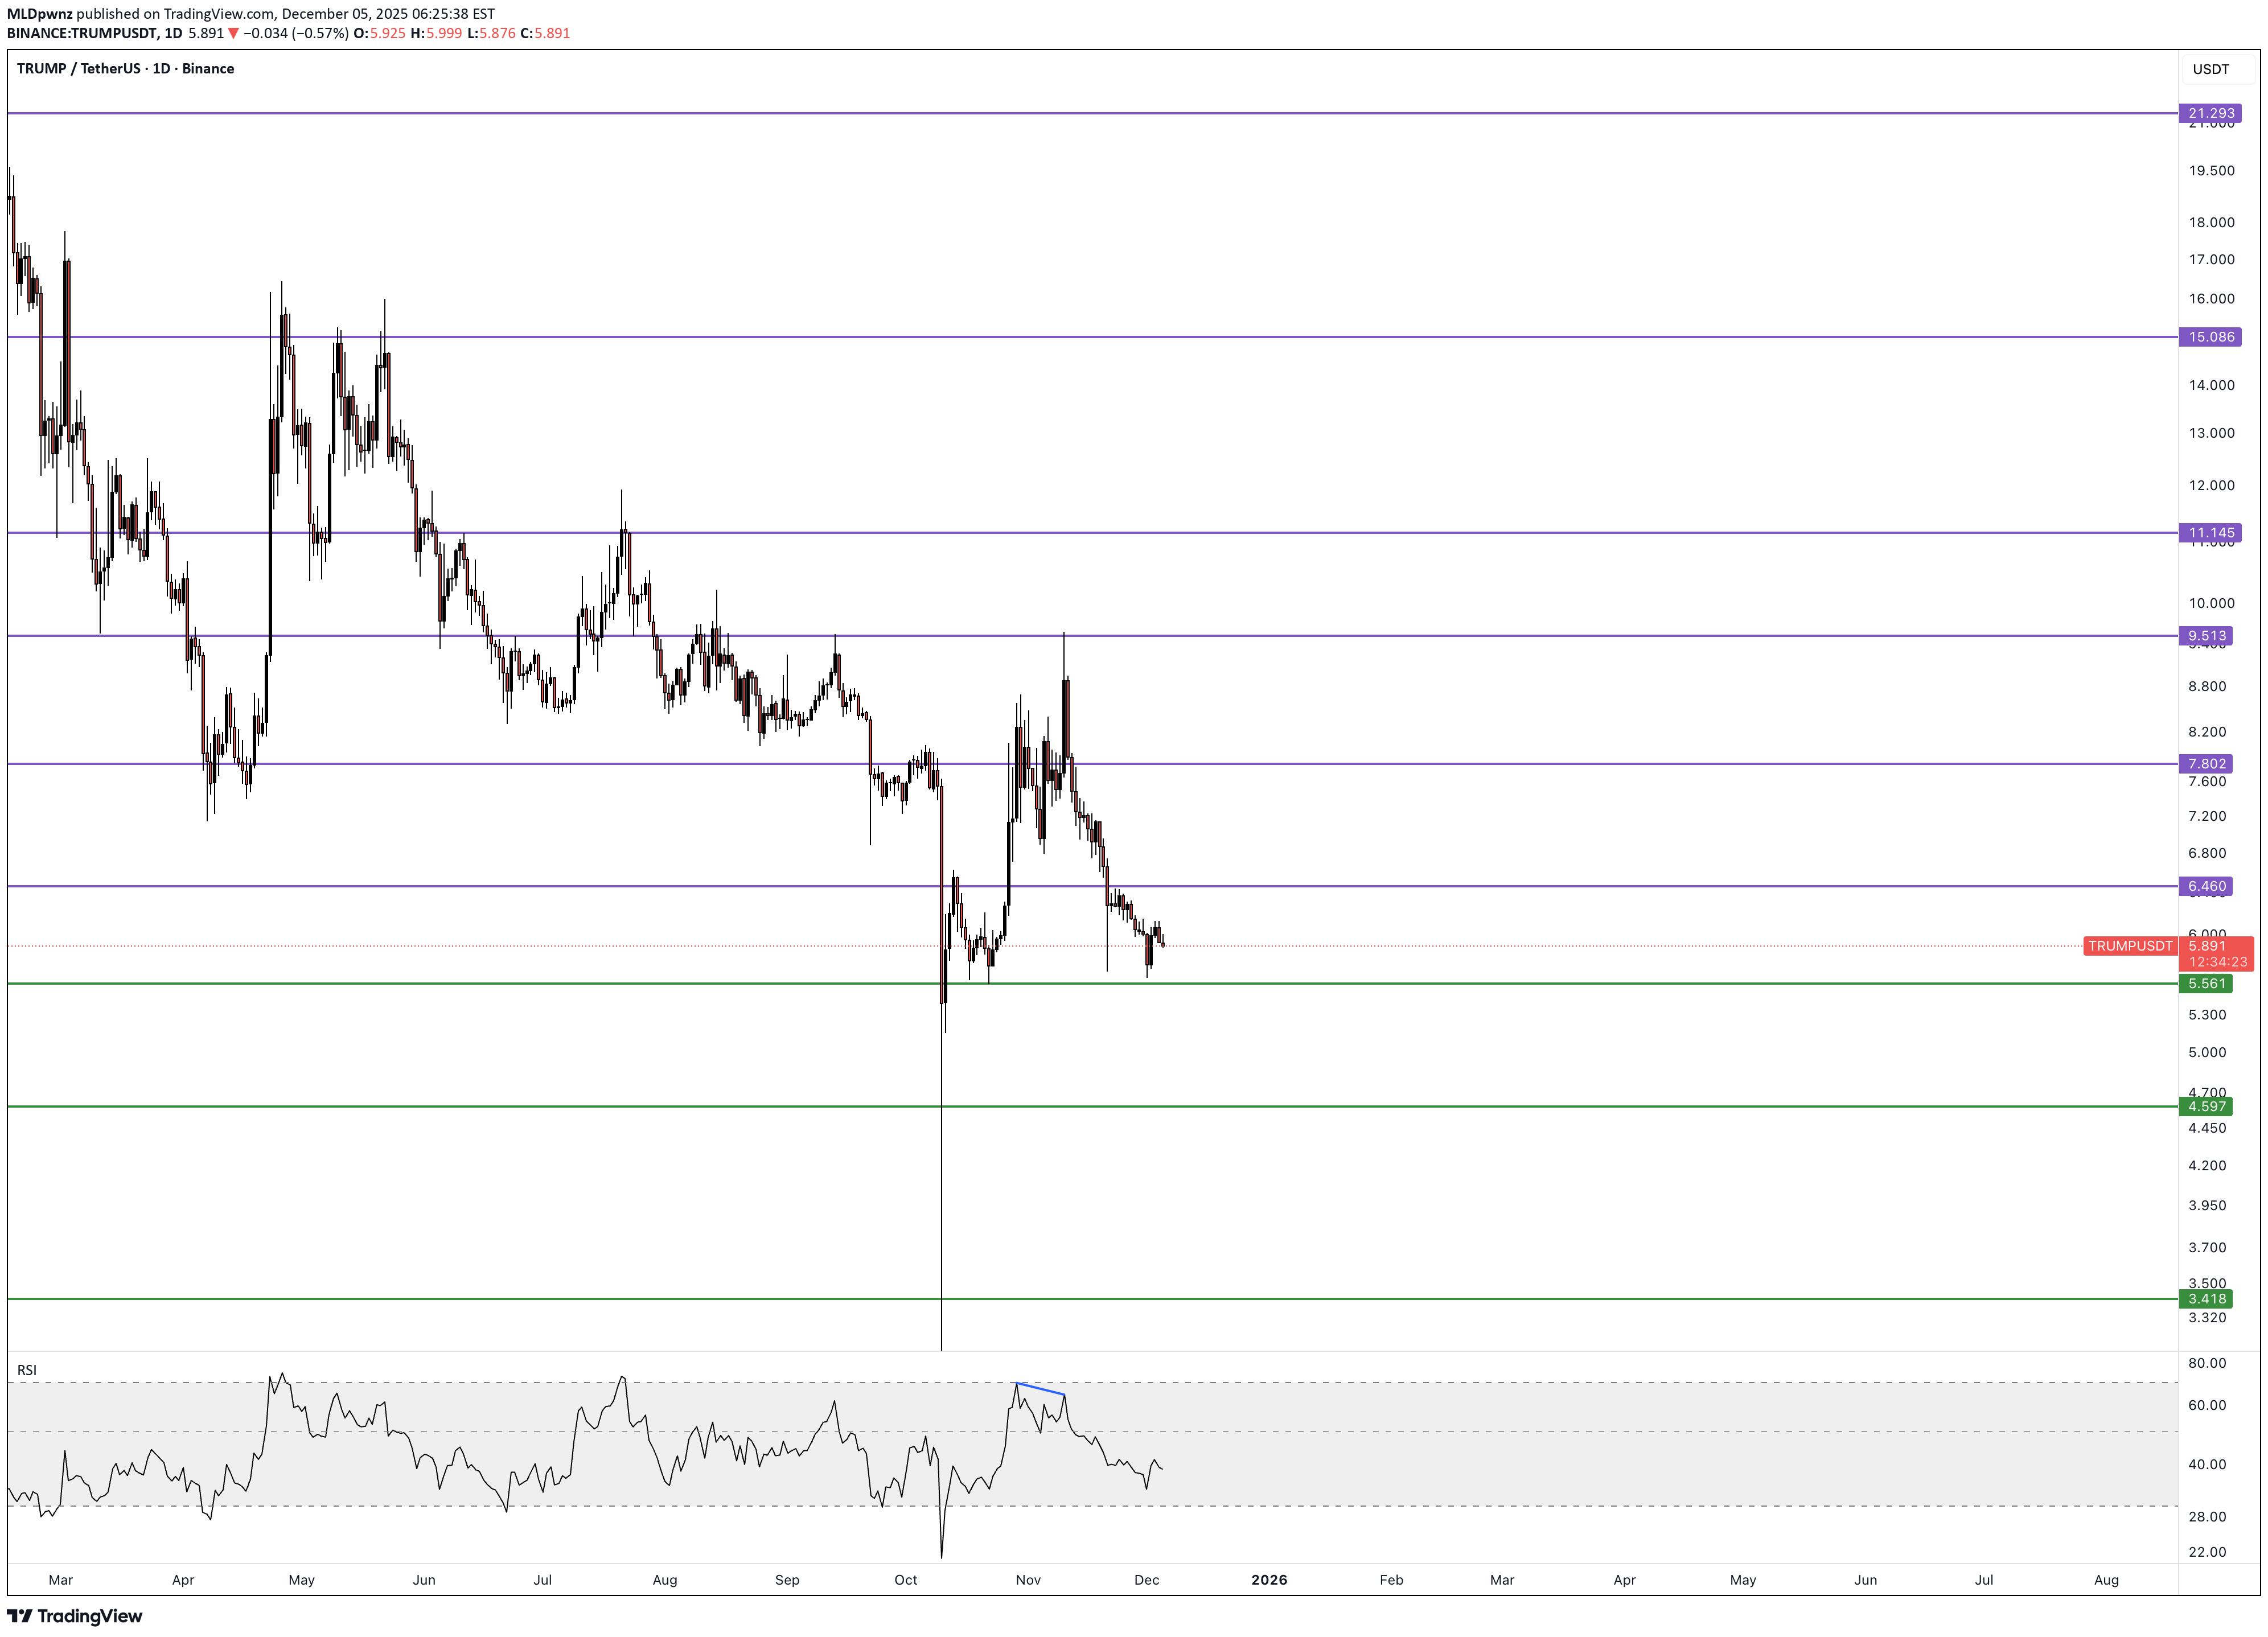
After the October flash crash, price bounced into resistance, where a bearish divergence formed. It is now playing out cleanly, and the downtrend continues. The only meaningful bullish argument at the moment is a large falling wedge on the weekly chart (after removing noise). Given the memecoin nature of TRUMP, the pattern has a chance to play out — but confirmation is required. Long entries should be considered only after a clear reversal setup forms. The 7.5–10$ range holds the main traded volume — this is the primary resistance block and the first major zone to offload positions. Only a sustained break above this range would open the way toward higher targets.
پیشبینی هفتگی بیت کوین (BTC/USDT): آیا ریزش بزرگ در راه است یا فرصت خرید نزدیک است؟
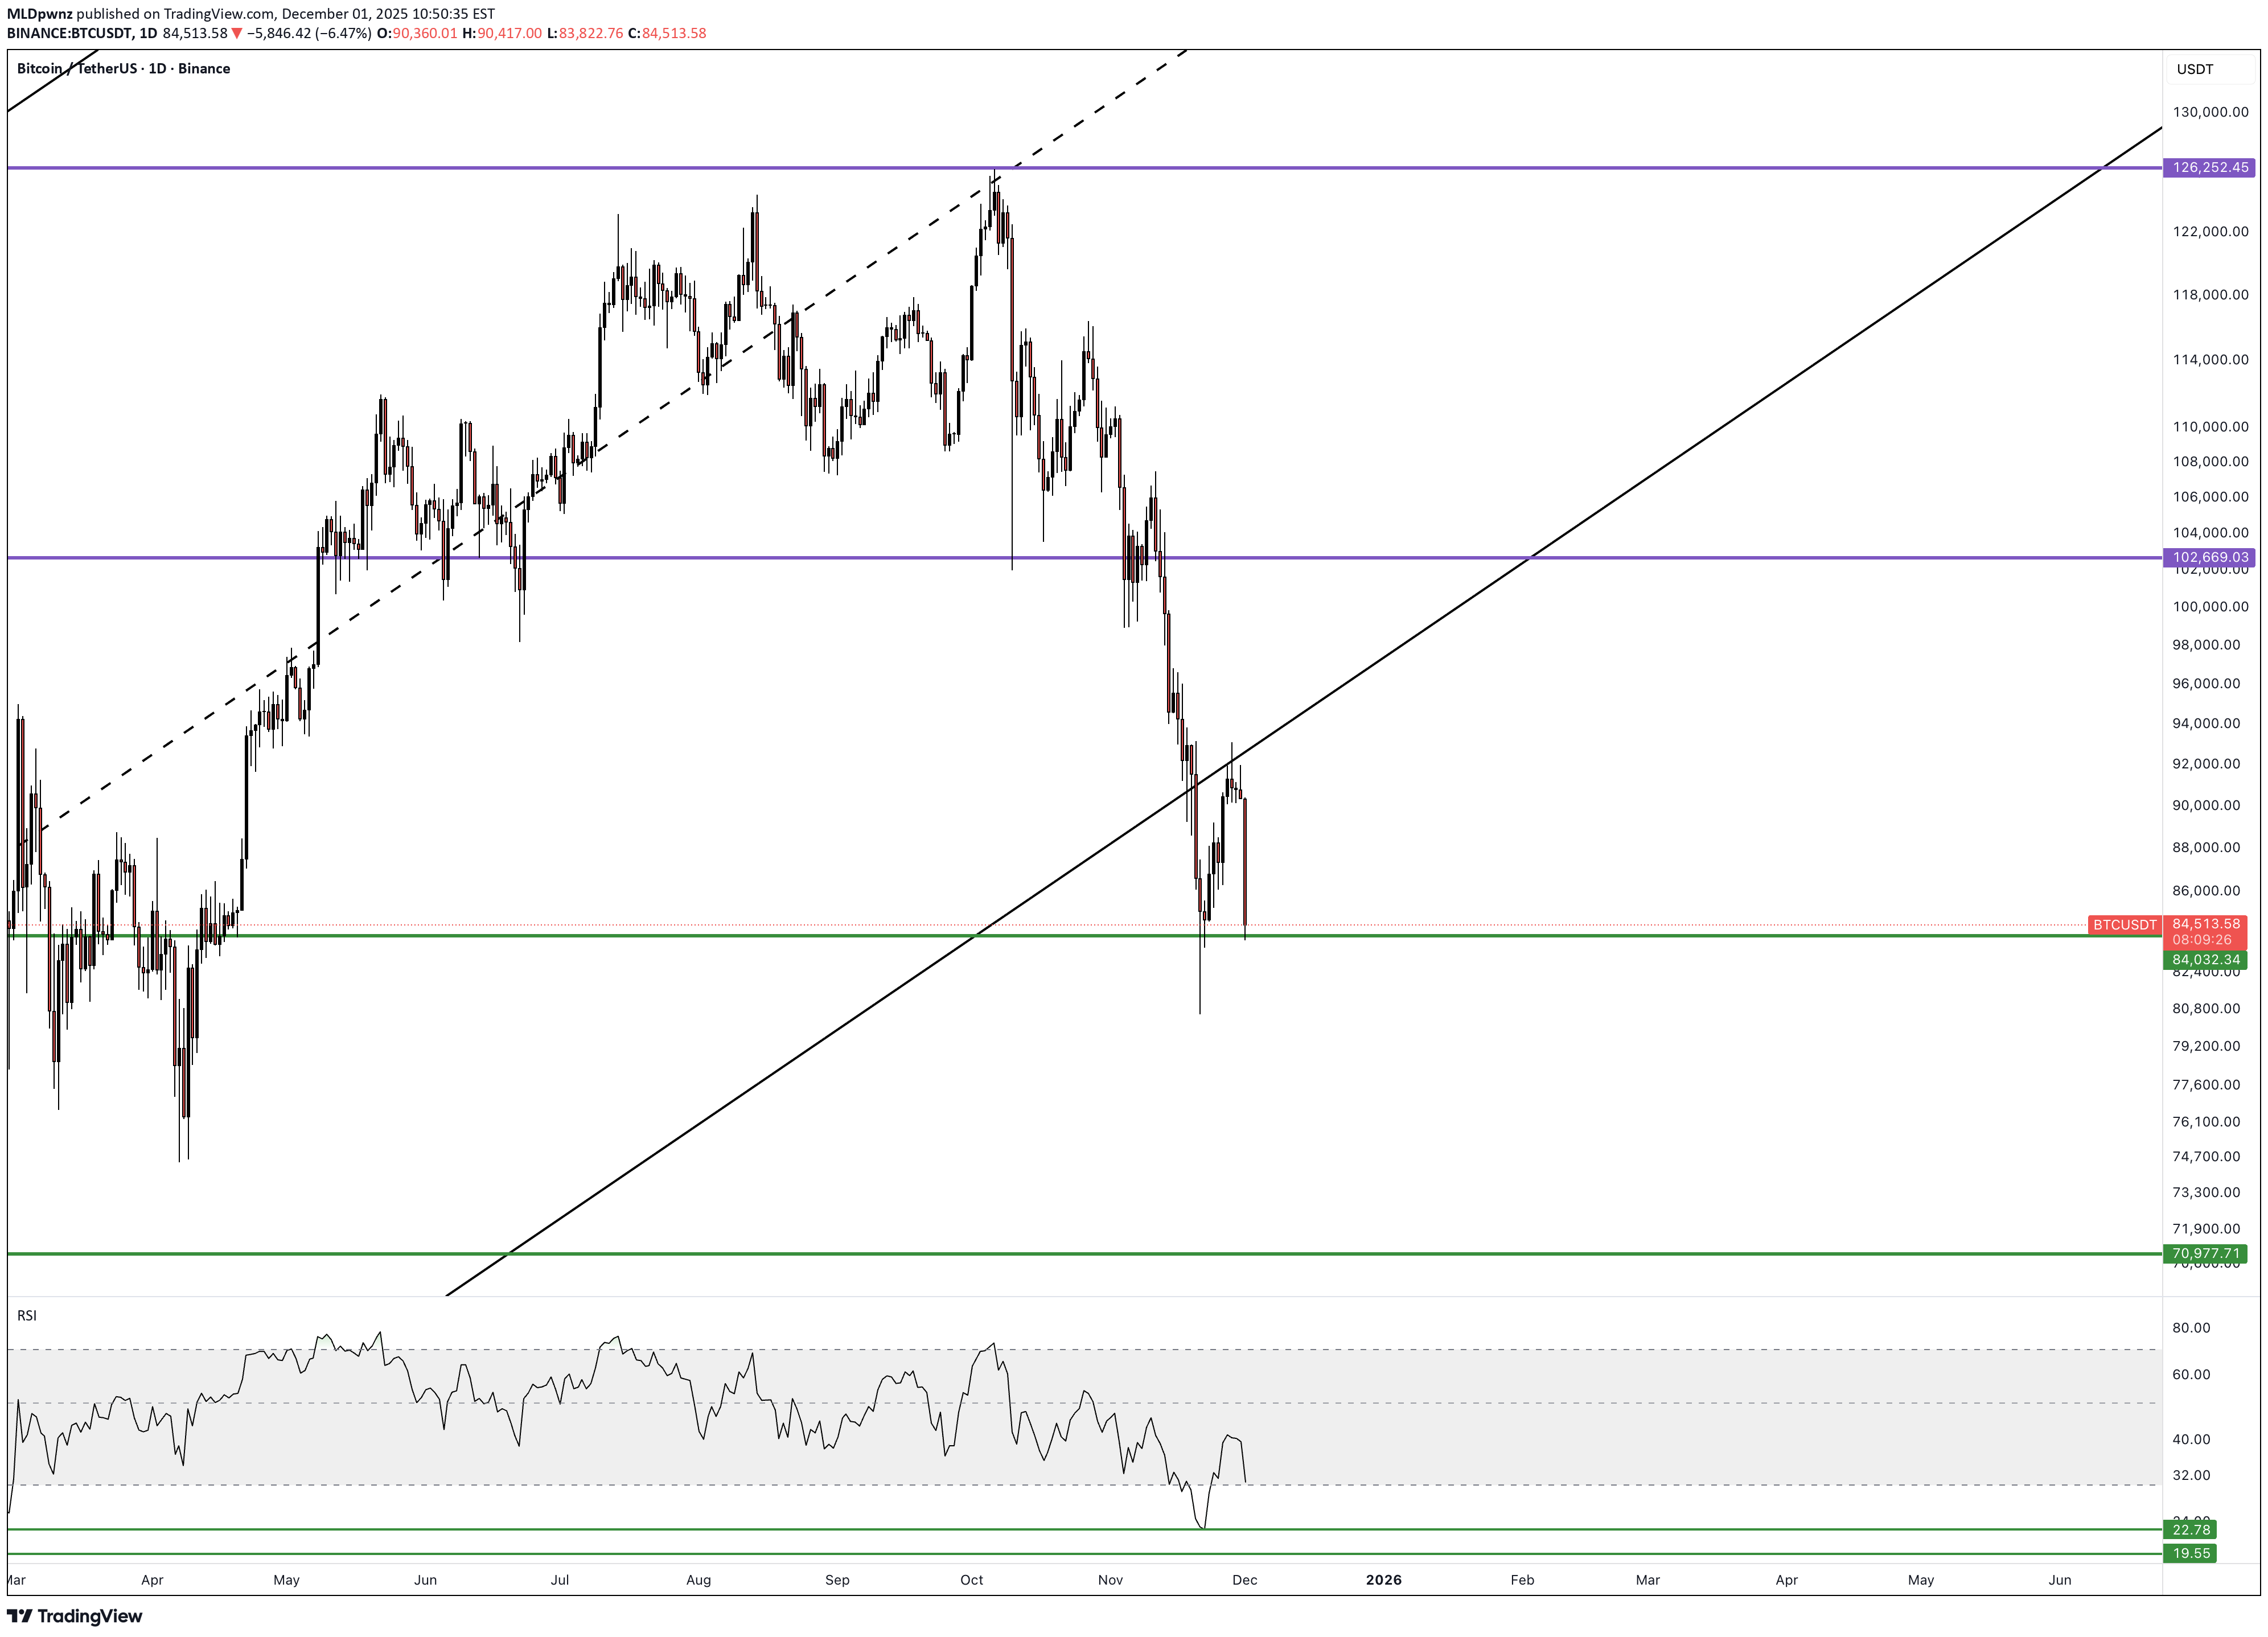
✔️ The monthly candle closed bearish with a lower wick. RSI has dropped into deep-correction territory (5 more points — and it hits the COVID-crash level). The structure increasingly resembles 2021. ✔️ Bitcoin recovered 4% during the week — but already lost 5% this morning. 🟢 QT officially ended today after 3.5 years . During this period, the Fed’s balance sheet shrank from $9T to $6.6T. 🟢 Positive cumulative delta: +$640M 🟠 Deviation below the channel has been closed — technically opening the path downward. 🟠 ETF flows: green on the week, red on the month. 🟠 Fear index moved from extreme fear back to regular fear — likely not for long. 🔴 Nearly the entire bounce has been retraced. A reversal is possible only after a clear reversal pattern forms. One step back before two steps forward. 🔴 The shortest bear phase in history lasted 1.5 months — that’s the most optimistic benchmark. 🧠 If the scenario plays out, we may see one more drop and a strong buyback within the next month. A sweep below 80k is possible. I expect a reversal starting from early January — holiday periods make market manipulation even easier.
تحلیل هفتگی بیت کوین: آیا ریزش سنگین در راه است یا پایان اصلاح نزدیک است؟
✔️ The monthly candle closed bearish with a lower wick. RSI has dropped into deep-correction territory (5 more points — and it hits the COVID-crash level). The structure increasingly resembles 2021. ✔️ Bitcoin recovered 4% during the week — but already lost 5% this morning. 🟢 QT officially ended today after 3.5 years . During this period, the Fed’s balance sheet shrank from $9T to $6.6T. 🟢 Positive cumulative delta: +$640M 🟠 Deviation below the channel has been closed — technically opening the path downward. 🟠 ETF flows: green on the week, red on the month. 🟠 Fear index moved from extreme fear back to regular fear — likely not for long. 🔴 Nearly the entire bounce has been retraced. A reversal is possible only after a clear reversal pattern forms. One step back before two steps forward. 🔴 The shortest bear phase in history lasted 1.5 months — that’s the most optimistic benchmark. 🧠 If the scenario plays out, we may see one more drop and a strong buyback within the next month. A sweep below 80k is possible. I expect a reversal starting from early January — holiday periods make market manipulation even easier. ----- ✔️ Місяць закрився ведмежою свічкою з тінню знизу. RSI знизилося до рівня глибокої корекції (ще 5 пунктів - і буде рівень ковідного дампу). Ситуація все більше нагадує 2021 рік. ✔️ За тиждень біткоїн зміг відновити 4% вартості. Але вже зранку втратив 5%. 🟢 Сьогодні офіційно завершився QT, який тривав 3.5 роки . За цей час баланс ФРС скоротився з $9 трлн до $6.6 трлн. 🟢 Позитивна кумулятивна дельта (+$640 млн) 🟠 Закрили випадіння з каналу. Дорога вниз технічно відкрита 🟠 Плюсовий тиждень за ETF, але мінусовий місяць. 🟠 З екстремального страху повернулися в “звичайний” страх. Схоже, не надовго 🔴 Зʼїли майже весь відскок. Розворт можливий після формування розворотного паттерну. Крок назад, щоб зробити два вперед. 🔴 Найкоротша ведмежа фаза в історії тривала 1.5 місяці - це найоптимістичніший орієнтир. 🧠 Якщо сценарій підтвердиться - протягом найближчого місяця побачимо ще одне зниження і відкуп. Ймовірно, оновимо лой під 80k. Буквально з першого січня очікую розворот. В свята маніпулювати ринком ще простіше.
Disclaimer
Any content and materials included in Sahmeto's website and official communication channels are a compilation of personal opinions and analyses and are not binding. They do not constitute any recommendation for buying, selling, entering or exiting the stock market and cryptocurrency market. Also, all news and analyses included in the website and channels are merely republished information from official and unofficial domestic and foreign sources, and it is obvious that users of the said content are responsible for following up and ensuring the authenticity and accuracy of the materials. Therefore, while disclaiming responsibility, it is declared that the responsibility for any decision-making, action, and potential profit and loss in the capital market and cryptocurrency market lies with the trader.