
Louigi_24
@t_Louigi_24

What symbols does the trader recommend buying?
Purchase History
پیام های تریدر
Filter
Louigi_24
ساختن نظم معاملاتی: ۸ عادت کلیدی برای حذف احساسات از ترید
Discipline is not something you rely on in the moment; it is something you build through habits that remove emotional decision-making from your trading process. 1. Define Rules Before You Trade Traders without predefined rules rely on emotion. Traders with rules rely on structure. Clearly define your entry criteria, risk per trade, maximum daily loss, and exit strategy. When these rules exist before the session starts, you eliminate most impulsive behaviors. 2. Limit Your Daily Decisions Every decision drains mental energy. The more choices you make, the weaker your discipline becomes. Reduce the number of markets you watch, the number of setups you take, and the amount of chart time you expose yourself to. Fewer decisions lead to higher-quality decisions. 3. Use a Pre-Session Checklist A checklist forces you into a disciplined routine. It can include: • Reviewing your trading plan • Checking upcoming news releases • Confirming your bias or market conditions • Ensuring your risk settings are correct The act of going through the checklist prepares your mind to follow structure. 4. Implement a Hard Stop for the Day One of the fastest ways to lose discipline is to trade while emotional. Set a maximum daily drawdown. Once it is hit, the session ends. No exceptions. This protects both your capital and your psychology. 5. Track Your Rule Breaks Most traders only track wins and losses. Disciplined traders also track deviations. Write down every time you break a rule, why it happened, and how you plan to prevent it next time. Over time, this builds awareness and accountability. 6. Delay Impulsive Actions If you feel the urge to jump into a trade that does not fit your plan, delay the action by 30 to 60 seconds. Impulses lose power quickly. By introducing a pause, you give your rational mind time to regain control. 7. Keep Your Environment Clean Distractions destroy discipline. Silence notifications, close irrelevant tabs, and avoid multitasking. A clean trading environment supports clean decisions. 8. End Each Session With a Routine A consistent end-of-day routine reinforces discipline. Examples: • Rating your discipline on a scale from 1 to 10 • Reviewing whether you followed your rules • Logging emotional triggers Ending the day with structure makes it easier to begin the next one with structure. Conclusion Discipline is not built through motivation but through habits that create consistent behavior. A structured trading routine removes uncertainty, minimizes emotional influence, and helps you operate like a professional rather than a reactive participant.Which Guide do you want to see next?
Louigi_24
چگونه ذهنیت معاملاتی سالم و موفق بسازیم؟ (راهنمای روانشناسی ترید)
Many traders underestimate how much psychology shapes their results. This guide outlines the foundations of a strong trading mindset that supports consistent and disciplined decision-making. 1. Understand That Emotional Discipline Is a Skill Trading naturally triggers emotions such as fear, frustration, greed, and impatience. These reactions are not weaknesses; they are human. What separates consistent traders from inconsistent ones is their ability to recognize emotions without acting on them. A resilient mindset comes from training, not talent. 2. Create Distance Between Yourself and Your Trades Do not tie your self-worth to the outcome of a single position. A loss does not mean you failed, and a win does not mean you are skilled. When traders begin to link identity to results, they make impulsive decisions. Use phrases like “this trade” instead of “my trade” to remove ownership bias. 3. Focus on Process, Not Profit Most traders sabotage themselves by obsessing over the end result. The market does not reward effort; it rewards alignment with probability. Instead of thinking “How much can I make?”, think “Did I execute according to my plan?” Your trading plan should define your entries, exits, risk, and market conditions. Follow it even when it feels uncomfortable. 4. Accept Uncertainty as Part of the Game No setup is guaranteed. Every trade, no matter how perfect, carries uncertainty. Accepting this prevents you from forcing control where none exists. When you fully accept uncertainty, you no longer fear it. 5. Build Consistency Through Routine A stable routine reduces mental noise. Examples include: • Reviewing your plan before each session • Limiting how many markets you monitor • Taking breaks after high-stress situations • Logging your trades with honest notes When your routine is consistent, your decisions become consistent. 6. Use Losses as Data, Not Drama A loss is not a personal attack from the market. It is information. Ask: “What does this loss teach me about my system or my mindset?” If you can extract value from losses, they become opportunities instead of obstacles. 7. Master Patience Most trading errors come from acting too soon, not too late. Patience means waiting for your setup without deviation. If you need to be in a trade at all times, it is no longer trading; it is compulsion. 8. Protect Your Mental Capital Mental capital is as important as financial capital. Overtrading, revenge trading, and excessive chart time drain your cognitive energy. Stop trading when you notice fatigue, frustration, or impulsiveness. A clear mind is an advantage. 9. Develop Long-Term Thinking Think in terms of series, not individual outcomes. A single win or loss means little. What matters is the overall direction of your equity curve. Professional traders think in months and years. Amateurs think in minutes. Conclusion A powerful trading mindset is built through consistency, self-awareness, and emotional control. By focusing on process and discipline rather than short-term results, you create a stable internal environment that supports longevity in the markets.Which guide do you want to see next?
Louigi_24
دینامیک نقدینگی بیت کوین: راز رسیدن به اوجهای جدید چیست؟
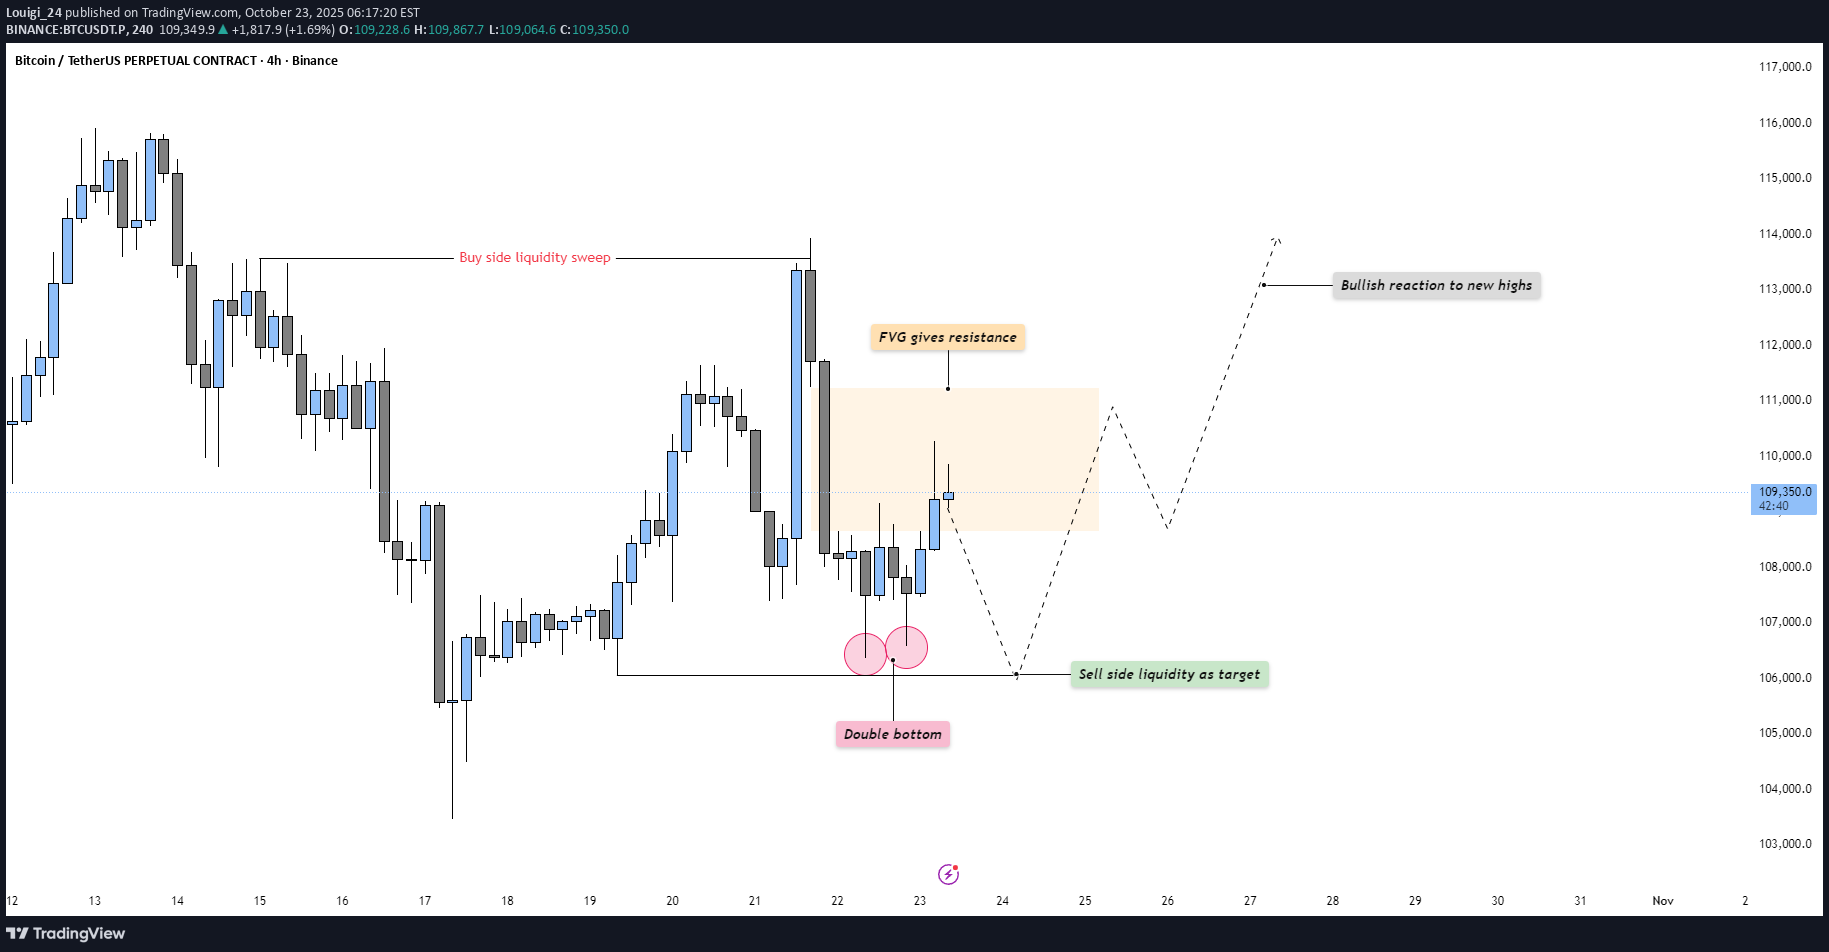
Market Context Bitcoin has shown a constructive reaction from the recent lows, printing a clean double bottom structure that suggests short-term demand entering the market. After a previous buy-side liquidity sweep and rejection, price has rebalanced and is now challenging a fair value gap (FVG) that previously served as resistance. This marks a key decision zone where the next directional move will unfold. Fair Value Gaps & Structure The FVG overhead has already acted as resistance, capping the first impulsive move from the lows. Should price retrace slightly to take out the remaining sell-side liquidity below the double bottom before re-engaging higher, it would confirm the area as a springboard for a bullish continuation. A clean reclaim and hold above the FVG zone would signal a shift in order flow favoring buyers. Liquidity Dynamics The current setup offers both sides of the market clear liquidity targets: sell-side liquidity resting under the double bottom and buy-side liquidity resting above the prior high. Smart money could engineer a sweep of the lower side first to accumulate before expansion, or alternatively, break directly through resistance to trigger a larger bullish leg. Final Thoughts The structure reflects a balanced but bullish-leaning scenario — a classic accumulation and breakout setup. A deeper retest to clear out lower liquidity would strengthen the foundation for continuation, while sustained strength above the FVG opens the door for a reaction toward new highs. If this analysis aligned with your view, drop a like — do you think we clear the lows first, or head straight for a bullish breakout?Do you agree?Went higher then expected but can still play out!On to the next!
Louigi_24
بیت کوین در آستانه سقوط بزرگ؟ سناریوی قطعی قدرت ۳ برای BTC!

Market Context Bitcoin has entered a phase of compression after an extended bearish leg, with price currently consolidating near recent lows. The previous selloff created a clean structure of inefficiencies and untouched fair value gaps (FVGs) above, now acting as potential magnet zones for short-term retracements. The broader context remains bearish until those imbalances are efficiently mitigated. Fair Value Gaps & Manipulation Zones A clear pocket of untouched FVGs sits above the current range, aligning with resistance from prior breakdown points. Price could engineer a manipulation move into this zone, enticing late buyers before resuming the macro bearish direction. Such a move would serve as a liquidity grab and offer premium pricing for distribution before continuation lower. Liquidity Dynamics The market structure shows resting sell-side liquidity (SSL) below the recent “news/data low,” marked as a potential target for a deeper sweep. Once manipulation into the upper inefficiencies completes, the market could shift momentum to the downside, distributing into that liquidity and seeking new lows for rebalancing. Final Thoughts The current structure points toward a classic bearish continuation setup: consolidation, manipulation into premium inefficiencies, and a drive toward sell-side liquidity. Unless price breaks decisively above the untouched FVG chain, the expectation remains for a redistribution phase leading into the news low or beyond. If this breakdown helped frame your bias, a like goes a long way — do you think price runs the FVG first, or dives straight into the liquidity below?Do you agree?Trade still active!On to the next one!
Louigi_24
بیت کوین پس از قله تاریخی: آیا زمان توزیع و ریزش فرا رسیده است؟

Market Context Bitcoin has completed a clear liquidity sweep at the all-time high (ATH) and is now transitioning into a corrective phase. After taking all the liquidity above the prior high, price aggressively rejected and shifted structure to the downside, signaling that smart money may now be engineering a retracement. The move lower has found a temporary pause within a lower accumulation zone where liquidity is rebuilding. Fair Value Gaps & Manipulation Following the ATH sweep, price manipulated back into a fair value gap (FVG) chain, where it met resistance. This area acted as a precise reaction point, rejecting further bullish attempts and confirming the FVG as an active supply zone. Each touch into this chain has resulted in lower highs, supporting the idea that distribution is underway. The fair value gaps below are likely to be targeted next as price seeks efficiency. Liquidity Dynamics Liquidity above has already been collected — the current draw now lies beneath. The accumulation zone below current price holds resting sell-side liquidity, and the market could aim to fill those inefficiencies before finding new demand. A retracement into these lower levels would act as a healthy correction to the prior bullish impulse, maintaining structural balance. Final Thoughts The market has shifted from an aggressive expansion phase to a potential distribution stage. With liquidity taken at the highs and FVGs now providing resistance, the bias leans toward a corrective move lower before any renewed bullish continuation. A break below the local accumulation floor would confirm deeper targets. If this breakdown helped clarify the current BTC structure, a like is always appreciated — and let me know: are you positioning for the correction, or waiting for the next bullish leg to form?Do you agree?Looks like its not really choosing a side...Target Reached!
Louigi_24
BTC - Are the bulls looking for a liquidity grab?

Market Context Bitcoin is holding strong after bouncing from a higher support zone and is now pressing into an area packed with liquidity. The recent bullish price action has carved out multiple fair value gaps on the way up, each serving as confirmation of demand and strengthening the bullish structure. Above current price lies a major cluster of buy-side liquidity — a magnet for price. Fair Value Gaps & Confirmations On the way up, price created several bullish fair value gaps that have each been respected as support. The first, second, and now third retests into these imbalances show that demand continues to step in, absorbing supply and building pressure upward. Adding to that, a bullish inversion fair value gap (IFVG) has formed, giving extra confirmation that buyers are in control. Liquidity Target Above The most obvious draw for price is the heavy buy-side liquidity resting above recent highs. With so many stops positioned there, the market is incentivized to push higher and sweep that zone. The path toward it could involve another retest into one of the fair value gaps below before expansion takes place, or a direct continuation straight into the liquidity pocket. Final Thoughts This structure is showing textbook bullish strength: stacked fair value gaps, IFVG confirmation, and a clear liquidity pool overhead. Unless the market breaks back below the deeper support zone, the expectation remains a run into buy-side liquidity. If this breakdown sharpened your view, a like is appreciated — and I’d love to hear from you: do you expect a retest first, or do we shoot straight into liquidity?Are you also bullish?lets see if we can take out the high!
Louigi_24
BTC - Bullish continuation in the making

Market Context BTC has recently broken out of a long-standing descending trendline, marking a significant shift in sentiment. This breakout signals the end of the controlled downtrend and sets the stage for a possible bullish continuation. At the same time, the chart shows a clear sweep of sell-side liquidity at the lows, which often serves as the fuel for a reversal. Trendline Breakout & Liquidity Sweep The bullish breakout of the old upper trendline is an important technical event. Combined with the earlier sell-side liquidity sweep, this suggests that downside liquidity has been cleared and that the path of least resistance could now be higher. Such a combination often marks the start of a new leg in the trend. Market Structure Shift Retest Following the breakout, price has pushed higher and printed a market structure shift (MSS). The current retest of this MSS zone will be key — if it holds, it provides the ideal spot for bulls to reload positions. This retest acts as confirmation that the breakout is valid, not just a short-lived deviation. Next Liquidity Grab & Upside Targets Above the current range sits a clear buy-side liquidity pool. The next logical move would be a grab of that liquidity, which could extend into a more aggressive bullish expansion toward higher levels. The structure suggests a stair-step move higher: liquidity grab, retest, and then continuation toward 115k–117k zones. Final Thoughts The sell-side liquidity sweep, trendline breakout, and market structure shift all point to a bullish shift in momentum. The key lies in how price reacts to the retest — hold it, and the next liquidity levels are likely to be taken. If this breakdown helped clarify the setup, a like is much appreciated — and let me know in the comments: are you playing the retest, or waiting for the liquidity grab above?Are you also bullish?It did not perfectly play out yet! I’m still bullish tho.Target reached!
Louigi_24
BTC - Consolidation, Manipulation & Distribution into new Highs

Market Context BTC is currently printing a series of higher lows, which signals a bullish underlying trend despite short-term volatility. Each dip has been defended, showing that buyers are stepping in earlier with every pullback. This type of structure often builds the foundation for an eventual breakout higher. Consolidation Phase After the strong bounce from recent lows, price has moved into a tight consolidation range. This is a classic "cooling-off" period where liquidity builds up and traders wait for direction. Consolidations at this stage often precede expansion moves, and the side that breaks tends to dictate the next wave of momentum. Bullish Fair Value Gap & Fakeout Just below the consolidation lies a Bullish Fair Value Gap. Price may fake out to the downside into this zone, trapping breakout sellers and filling imbalance before reclaiming levels. This setup is particularly interesting because the higher-timeframe structure still favors the bulls, making the FVG a potential springboard for continuation. Distribution into New Highs If the FVG reacts as expected, the next phase would likely be distribution into new highs. That means clearing out liquidity above the consolidation and targeting the next round of upside expansion. In this scenario, the higher lows, the fakeout trap, and the FVG all align to fuel the breakout. Final Thoughts The higher-low structure gives this setup a bullish tilt, but the real clue will come from how price behaves around the Fair Value Gap. A clean reaction there could be the trigger for a sharp push into new highs. If this breakdown gave you clarity on the structure, a like would be appreciated — and drop your thoughts in the comments. Do you expect the fakeout into the FVG, or are you positioned differently?Are you also bullish?Lets see if we can complete the PO3 now!Kind of played out!
Louigi_24
BTC - Perfect Bullish Setup

Price Action Breakdown After running the lows with a clear Sell Side Liquidity Sweep, BTC quickly reversed and printed a Market Structure Shift (MSS). This marked the first real sign that the market might be ready to transition from weakness into strength. Retracement Zone Price is now retracing into a very interesting area — the overlap of a Bullish Fair Value Gap, an IFVG, and the Golden Pocket. When multiple imbalances and Fibonacci levels line up like this, it often builds a high-probability zone where institutions look to re-accumulate positions before the next move higher. Upside Target If this area holds and buyers step in, the next logical draw on liquidity sits above Buy Side Liquidity. That pool of stops acts like a magnet, and with the prior lows already cleaned, the path of least resistance could be higher. Invalidation On the other hand, a failure to hold inside the Golden Pocket would weaken this bullish narrative. A clean break below the sweep low would suggest that this rebound was only temporary relief before further downside. Final Thoughts This setup is all about how price reacts inside the retracement zone. If we see strength here, the run toward Buy Side Liquidity is very much in play. If not, patience will pay, as deeper levels will likely come into focus. What’s your take — do you see this zone holding, or are you expecting another flush?Are you also bullish?The dip was stronger than expected but we are going to the target!Target Reached!
Louigi_24
GOLD - Ascending Triangle into new All Time High
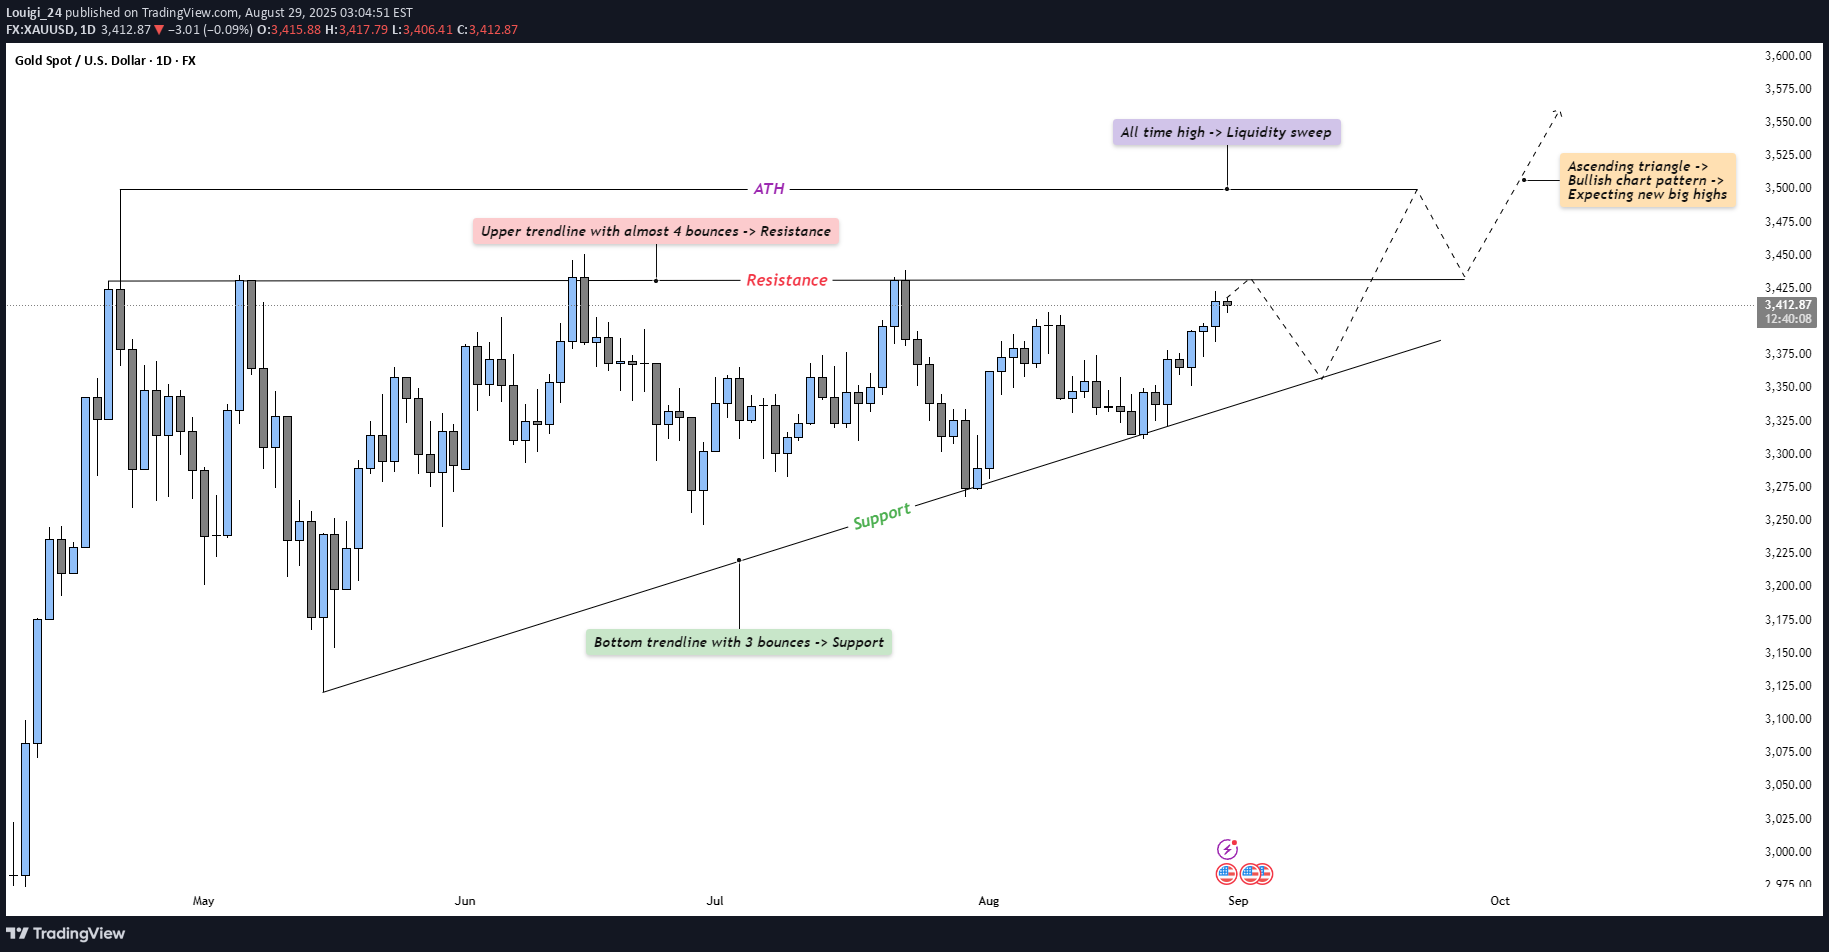
Market Context Gold has been steadily climbing, forming an ascending triangle pattern over the past few months. Buyers continue to defend higher lows, while sellers repeatedly reject price near resistance. This type of structure often signals building pressure, with volatility likely to expand once a breakout occurs. Consolidation Phase The range between the ascending support trendline and the horizontal resistance has created a textbook consolidation. Each bounce off support shows accumulation, while the repeated touches of resistance highlight where liquidity is building. The longer price compresses within this pattern, the more explosive the eventual breakout is expected to be. Bullish Breakout Scenario If price manages to break above resistance and sweep the all-time high, it would likely trigger a wave of liquidity from trapped shorts and breakout buyers entering. This move could fuel momentum into fresh price discovery, validating the ascending triangle as a bullish continuation pattern. The sweep of liquidity above ATH could serve as the catalyst for acceleration toward new highs. Bearish Retest Scenario On the other hand, if resistance holds once again, a deeper retracement back toward the ascending trendline is likely. This would test the conviction of buyers and determine whether the trendline support continues to act as the foundation for the structure. A clean break below support would weaken the bullish outlook and signal a potential shift in momentum. Final Words Patience here is key — ascending triangles often test traders’ resolve before making their decisive move. Let the market reveal its hand before committing to either direction. If you found this breakdown helpful, a like would be much appreciated! Drop a comment and let me know: are you expecting the breakout to bring new highs, or do you see sellers defending this level once again?Are you also bullish on gold?Looks like we will have to wait for Monday! Let’s see if we break out…Tomorrow the charts will be moving again! Let’s see…
Disclaimer
Any content and materials included in Sahmeto's website and official communication channels are a compilation of personal opinions and analyses and are not binding. They do not constitute any recommendation for buying, selling, entering or exiting the stock market and cryptocurrency market. Also, all news and analyses included in the website and channels are merely republished information from official and unofficial domestic and foreign sources, and it is obvious that users of the said content are responsible for following up and ensuring the authenticity and accuracy of the materials. Therefore, while disclaiming responsibility, it is declared that the responsibility for any decision-making, action, and potential profit and loss in the capital market and cryptocurrency market lies with the trader.