Technical analysis by Louigi_24 about Symbol PAXG: Buy recommendation (5/15/2025)

Louigi_24
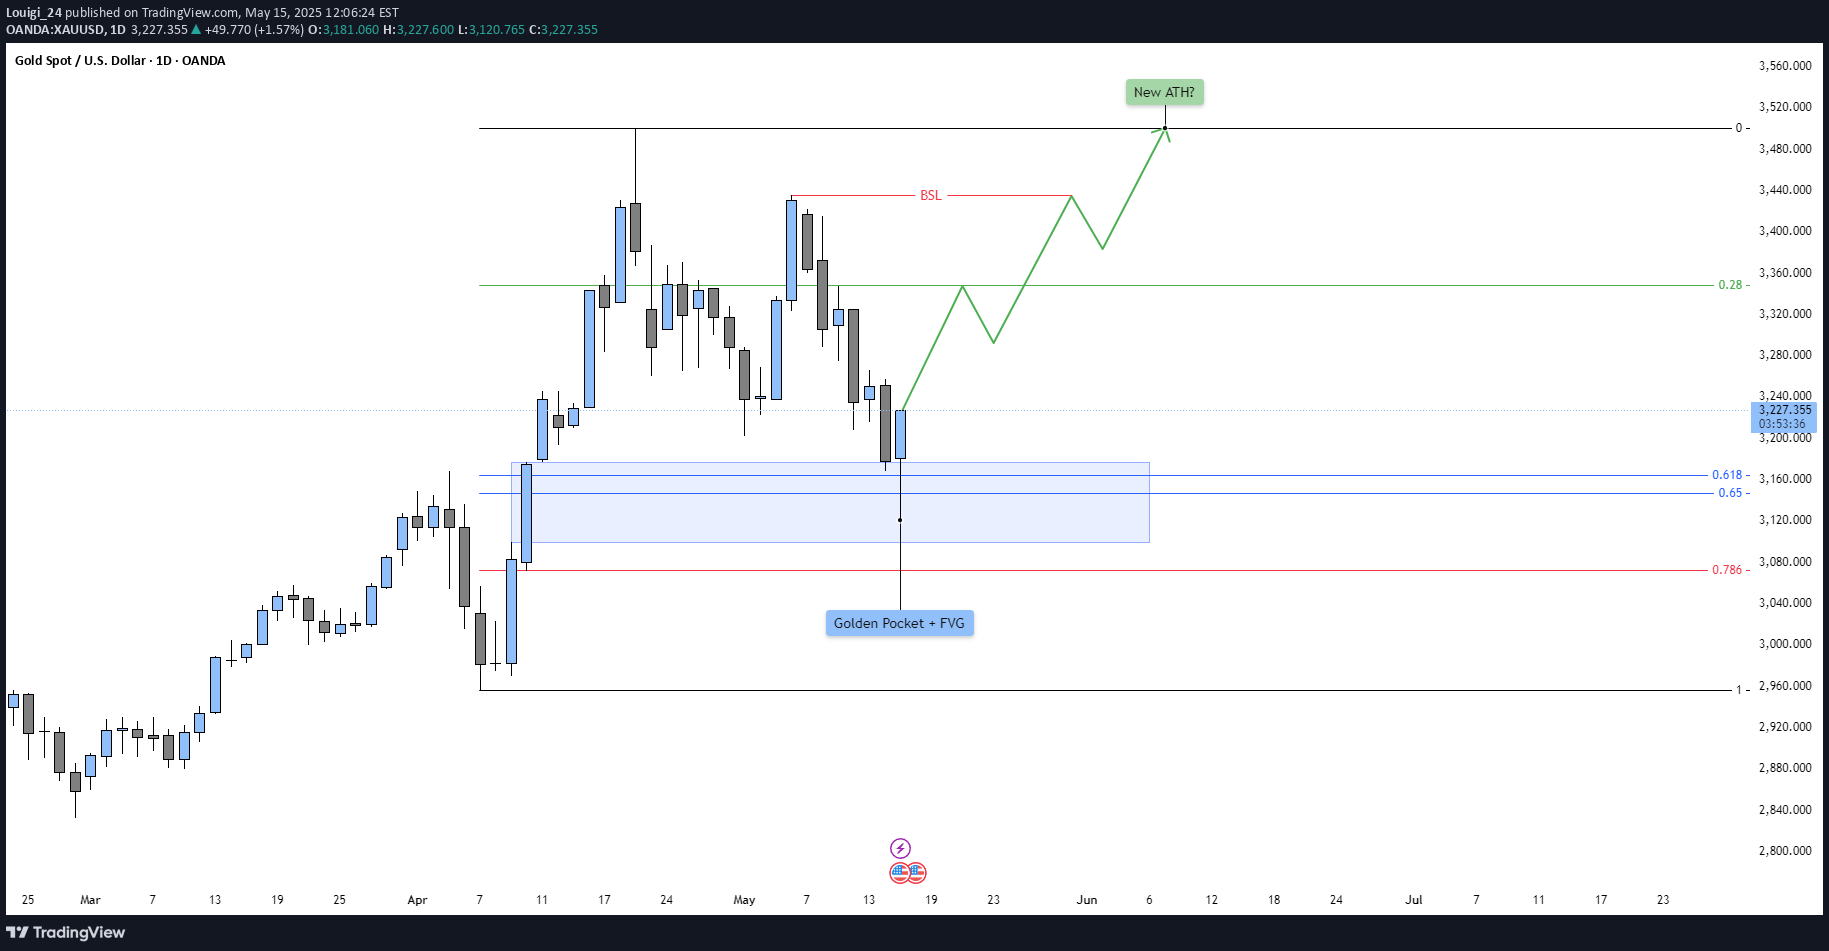
Overall Market ContextThis daily timeframe chart of Gold (XAU/USD) reflects a textbook example of a bullish retracement within a broader upward trend. The price has recently pulled back after printing a significant swing high, which is currently the all-time high (ATH). This retracement brings Gold into a high-probability reversal zone, aligning several technical elements that point toward potential bullish continuation.Retracement Into A Confluence ZonePrice has retraced into a key technical area defined by the Fibonacci golden pocket (0.618–0.65) and a Fair Value Gap (FVG). The golden pocket is widely regarded as one of the most reactive retracement levels in Fibonacci analysis, where institutional participants often enter or scale into positions. The addition of an FVG overlapping this zone strengthens its importance. An FVG is typically created by an aggressive move that leaves behind inefficient price action or unmitigated imbalances, and in this case, it represents an area where demand previously overwhelmed supply.The combination of the golden pocket and FVG creates a strong demand zone, from which a bullish reaction is expected if the overall macro sentiment remains supportive.Bullish Reaction And ConfirmationPrice wicked slightly below the FVG, likely triggering liquidity stops resting beneath prior swing lows before showing signs of a strong bounce. This type of price action—known as a liquidity grab or "spring"—is often a precursor to significant reversals when it aligns with higher timeframe bullish order flow.The current bounce from this zone suggests that smart money may have accumulated long positions here. If price continues to hold above this zone, it confirms a successful defense of this key area and increases the probability of bullish continuation. The market is showing signs of shifting from a retracement phase back into an impulsive phase.Break Of Structure And Targeting Buy-Side LiquidityThe next key area of interest is the buy-side liquidity resting above the most recent swing high, labeled as the "BSL" (Buy-Side Liquidity). If price breaches this level, it will confirm a break of market structure to the upside and signal a continuation of the overall bullish trend.Such a break would invalidate the idea of deeper retracement and instead align with an impulsive leg that could target the previous ATH—and potentially exceed it. This makes the current zone a critical pivot point in determining whether gold resumes its long-term bullish trajectory.New All-Time High ScenarioShould the BSL be breached and momentum maintained, price is likely to head toward printing a new all-time high. From a psychological and technical standpoint, the break of an ATH often leads to price discovery, where resistance is minimal, and price action becomes more volatile and parabolic.Traders and institutions monitoring historical highs often front-run such moves or aggressively participate once confirmed, driving increased volume and volatility. This behavior can lead to rapid upside extension, especially when supported by macroeconomic narratives such as inflation hedging, geopolitical tensions, or declining real yields—all traditionally bullish catalysts for gold.Let me know what you guys think! New ATH or not?All options are still wide open!
